Late-time observations of SN 2006gy: Still Going Strong
Abstract
Owing to its extremely high luminosity and long duration, supernova (SN) 2006gy radiated more energy in visual light than any other known SN. Two hypotheses to explain its high luminosity at early times — that it was powered by shock interaction with circumstellar material (CSM) as implied by its Type IIn spectrum, or that it was fueled by radioactive decay from a large mass of 56Ni synthesized in a pair-instability SN — predicted different late-time properties. Here we present observations of SN 2006gy obtained more than a year after discovery. We were unable to detect it at visual wavelengths, but clear near-infrared (IR) and -band detections show that it is still at least as luminous as the peak of a normal Type II SN. We also present spectra giving an upper limit to the late-time H luminosity of 1039 erg s-1. Based on the weak late-time H, X-ray, and radio emission, combined with the difficulty of explaining the shift to IR wavelengths, we can rule out ongoing CSM interaction as the primary late-time power source of SN 2006gy. Instead, we propose that the evolution of SN 2006gy is consistent with one of two possible scenarios: (1) A pair-instability SN plus modest CSM interaction, where the radioactive decay luminosity shifts to the IR because of dust formation. (2) An IR echo, where radiation emitted during peak luminosity heats a pre-existing dust shell at radii near 1 light year, requiring the progenitor star to have ejected another shell of 10 M⊙ about 1500 yr before the SN.
Subject headings:
circumstellar matter — stars: evolution — supernovae: individual (SN 2006gy)1. Introduction and Predictions
At late times, most supernova (SN) explosions are powered by the radioactive decay sequence 56Ni 56Co 56Fe. Typically, less than 0.1 M⊙ of 56Ni is synthesized in the explosion resulting from a massive star’s core collapse, producing a light curve following the decay rate of 56Co at late times.
Some supernovae (SNe) draw additional fuel by converting shock energy into light when the ejecta blast wave collides with the circumstellar medium (CSM). The relatively slow CSM gas (a few 102 km s-1, compared with 104 km s-1 for SN ejecta) is usually observed to be H rich, causing bright “narrow” H lines in the spectrum that define the Type IIn subclass (Schlegel 1990; see Filippenko 1997 for a review). A Type IIn spectrum is therefore a hallmark of CSM-interaction SNe. Sufficiently dense CSM can decelerate the blast wave, draining the shock of kinetic energy that is converted to X-rays and visual light. In this way, SNe IIn can be more luminous than normal SNe II (e.g., Chevalier & Fransson 1985; Chugai 1991, 1992).
The recent event SN 2006gy challenged this picture because it radiated far more visual light than any other known SN (Ofek et al. 2007; Smith et al. 2007, hereafter Paper I). Its soft X-ray emission (Paper I) and its Type IIn spectrum (Ofek et al. 2007; Paper I) showed signs of CSM interaction, but they indicated a level of interaction that was too weak for SN 2006gy’s extreme energy demands.
1.1. CSM Interaction as the Engine
Previously (Paper I), we discussed both sides of this issue in detail, noting problems with a conventional CSM-interaction scenario. While tell-tale signatures of some level of CSM interaction are seen in SN 2006gy, they indicate that it is too weak by 2–3 orders of magnitude to power the luminosity. Thus, a traditional model of ongoing CSM interaction, where the SN luminosity is powered by radiation directly from the post-shock cooling zone, cannot fully account for the energy budget of SN 2006gy during the main peak of its light curve. Moreover, Smith & McCray (2007) pointed out that the requisite CSM mass of 10 M⊙ makes the interaction region opaque and largely invisible. If CSM interaction powers SN 2006gy, a different conceptual model is needed.
Smith & McCray (2007) argued that if 1.51051 erg of ejecta shock energy were thermalized throughout an opaque envelope with initial radius 160 AU (the pseudo photosphere of an unbound shell), adiabatic losses could be averted in a manner analogous to that of most SNe II. As the initially opaque envelope expands and thins, trapped thermal energy can leak out. In this “shell-shocked” model, subsequent diffusion of energy can account for the high luminosity and shape of the light curve of SN 2006gy. A prerequisite is that the star ejected an opaque 10–20 M⊙ shell in a luminous blue variable (LBV)-like outburst (Smith & Owocki 2006), fortuitously occurring in the decade before the SN. Woosley et al. (2007) presented a similar CSM-interaction model with a 25 M⊙ pre-SN shell, wherein the precursor outburst was triggered by the pulsational pair instability in a very massive star, yielding model light curves approximating that of SN 2006gy. (Note that a pulsational pair instability ejection is different from a genuine pair-instability SN that destroys the star; see Heger & Woosley 2002.)
1.2. The Pair-Instability SN Hypothesis
The other potentially viable model to account for the high luminosity and long duration of SN 2006gy is that it shares the same radioactive energy source as most SNe, but that the initial mass of 56Ni is 50–100 times larger. This would require a pair-instability SN event (Barkat et al. 1967; Rakavy & Shaviv 1968; Bond, Arnett, & Carr 1982), where several solar masses of 56Ni are synthesized in the explosion. Nomoto et al. (2007) produced a pair-instability model roughly matching the light curve of SN 2006gy using 15 M⊙ of 56Ni.
1.3. Predictions
The shell-shocked model and the pair-instability model make different predictions for the late-time (1 yr) luminosity, although it should be noted that both models require the progenitor of SN 2006gy to have been an extremely massive star, with a likely initial mass above 100 M⊙ (Paper I; Woosley et al. 2007).
While the shell-shocked model may explain the main peak of the light curve of SN 2006gy, the energy source cannot last: as the material continues to expand and thin out, radiation leaks away at a faster pace and the shocked envelope suffers adiabatic losses, so the emitted energy plummets rapidly at late times. This hypothesis therefore predicts that after about a year the SN would quickly fade beyond detectability (Smith & McCray 2007). The model of Woosley et al. (2007) makes a similar prediction. If the SN still shines brightly after that time, there must be some continuing energy deposition.
That sustained source of energy deposition could, in principle, arise from continued CSM interaction with additional material encountered by the expanding blast wave after passing through the massive opaque shell. This would correspond to the progenitor’s normal wind before the precursor shell ejection. This type of ongoing CSM interaction is the late-time engine for most SNe IIn that remain luminous. In all such cases, however, the lasting luminosity is accompanied by very strong, relatively broad H emission. This is not the case for SN 2006gy, as we will demonstrate in this paper, making the ongoing CSM interaction hypothesis improbable.
The pair-instability SN hypothesis predicts that the luminosity will decline slowly, following the 56Co decay rate or slightly faster, so it should remain luminous. An important point is that the decay rate can be faster than the intrinsic 56Co decay rate if the material becomes optically thin, and this effect may be important in allowing a self-consistent pair-instability explanation for SN 2006gy.
The different expectations for radioactive decay and the shell-shocked model would seem to provide a straightforward test: if SN 2006gy faded rapidly, it was not a pair-instability SN. By day 230 after explosion, SN 2006gy appeared to be fading slower than expected in the shell-shocked model, but thereafter it became lost in the Sun’s glare. Here we set out to test the aforementioned predictions by attempting to detect SN 2006gy at late times after it re-emerged from behind the Sun. As we shall see, the surprising results do not fully solve the mystery, and they introduce a new twist to the story.
2. Observations
Once SN 2006gy became observable again, we began a monitoring campaign of unfiltered optical photometry with the Katzman Automatic Imaging Telescope (KAIT; Filippenko et al. 2001), -band photometry with the low-resolution imaging spectrometer (LRIS; Oke et al. 1995) on the Keck I 10-m telescope, and and photometry with the Near-Infrared Camera 2 (NIRC2) and the laser guide star (LGS) adaptive optics (AO) system (Wizinowich et al. 2006) on Keck II. Two optical spectra were also obtained with LRIS on Keck I.
The unfiltered KAIT photometry resumed on 2007 Aug. 17 (day 362; UT dates are used throughout this paper), but we could only establish limits due to its position in the bright inner regions of its host galaxy. Using fake-star injection tests on images with host galaxy light subtracted, we estimate that SN 2006gy had an unfiltered apparent magnitude fainter than about 19.5 on days 362 and 394, or an absolute magnitude fainter than 16.5 with the same parameters as in Paper I. Similarly, we estimate an -band magnitude fainter than 20.0 from the Keck image obtained on 2007 Oct. 16 (day 422).
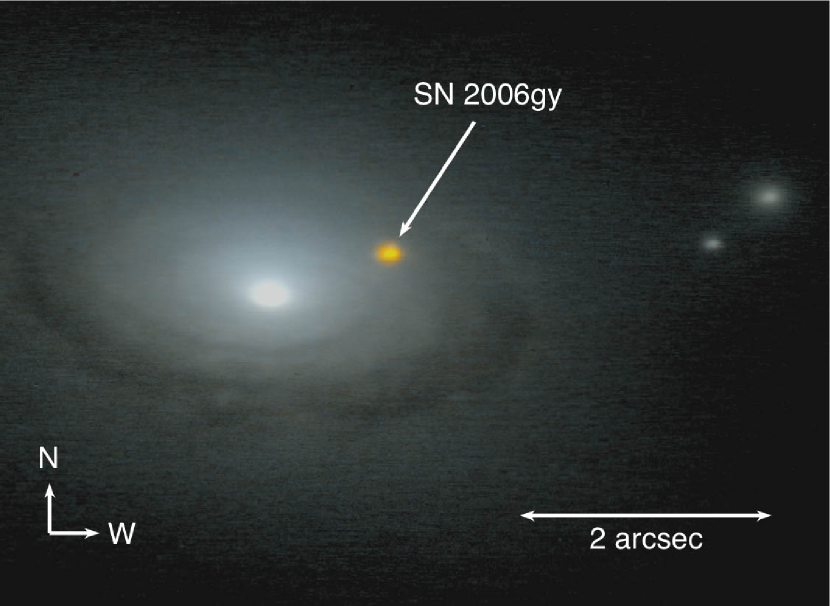
Using NIRC2 LGS AO, we obtained photometry on 2007 Sep. 29 in wide-field mode, and and -band photometry on 2007 Dec. 1 in narrow-field mode. SN 2006gy was clearly detected in all bands at both epochs (Fig. 1). Based on a comparison with the only two well-isolated 2MASS stars in common within our small field, we measured mag on day 405, and mag on day 468. The -band photometry could not be calibrated owing to the even smaller field of view for the Dec. 1 observation, in which there were no good 2MASS comparison stars. (The photometry on Dec. 1 could be reliably flux calibrated, however, because of field stars in common with the larger field-of-view image obtained on Sep. 29.)111Figure 1 also shows clear evidence for a dark dust lane at a projected radius of 2″ or 700 pc from the nucleus of NGC 1260. This confirms structures seen by Ofek et al. (2007), and reinforces the possibility that the host galaxy has active massive star formation.
Given the questions concerning CSM interaction as a potential energy source at late times, we also obtained a deep optical spectrum to search for any lingering intermediate-width H emission coming from the shocked CSM gas. Our LRIS spectra were obtained on 2007 Aug. 19 and Oct. 16, and were reduced using standard techniques (e.g., Foley et al. 2003).
3. Results and Discussion
3.1. Minimum Luminosity from Photometry
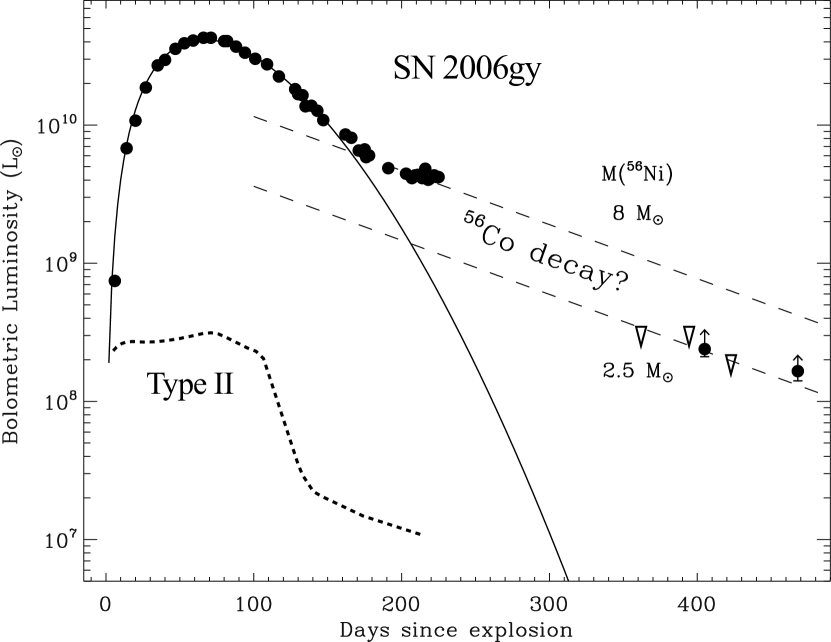
Although we do not have sufficient color information for an accurate assessment of the bolometric luminosity, we can derive a minimum luminosity of SN 2006gy at late times assuming that a blackbody-like energy distribution peaks in the band (no bolometric correction to the absolute magnitude). This is plausible, given its red color compared to the host galaxy (Fig. 1). The bolometric luminosity could be significantly higher than what we quote below, which is why we plot lower limits in Figure 2. For example, if the spectral energy distribution (SED) is not a single-temperature blackbody, then the luminosity will be higher. If it peaks at longer IR wavelengths near 5 , as we may expect (see below), then the bolometric luminosity could be 5–10 times larger. Upper limits corresponding to -band nondetections are also plotted in Figure 2; these do not provide stringent constraints, but they also do not conflict with luminosities derived from the band. They assume that the SED peaks in the band, which is unlikely; thus, the true upper limits are probably substantially higher than shown.
Adopting the same 73.1 Mpc distance and mag ( mag) extinction as in Paper I, we find minimum values for the bolometric luminosity of L⊙ on day 405 and L⊙ on day 468 from the measurements. If the SED does not peak at 2.3 , then the true luminosity is higher.
Figure 2 shows lower limits to the late-time luminosity, plotted along with the light curve and photon-diffusion model from Paper I and Smith & McCray (2007), respectively. The measured late-time bolometric luminosity is much higher than the predicted decay from photon diffusion in the “shell-shocked” model of Smith & McCray (2007), as well as that of Woosley et al. (2007). The additional luminosity source could be either (1) continued CSM interaction as the shock runs into an extended, dense CSM created by a progenitor with M⊙ yr-1 (see §3.2), (2) radioactive decay from 2.5 M⊙ of 56Ni (§3.4), or (3) an IR echo, as light from the time of peak luminosity is now heating dust in another massive shell at a radius of 1 light year from the SN, ejected by the progenitor star 1500 yr earlier.
3.2. CSM Interaction and the Lack of H Emission
One hypothetical source for a slowly declining luminosity, especially for SNe IIn, is continued CSM interaction as the blast wave encounters additional dense material outside of the LBV-like ejecta shell required in the “shell-shocked” models of Smith & McCray (2007) and Woosley et al. (2007). A convenient expression for the progenitor’s minimum mass-loss rate needed to produce an observed luminosity through CSM interaction, with an optimistic 100% efficiency, is given by
where and are the progenitor’s wind speed and the SN blast-wave speed (respectively) in km s-1. For the main peak of SN 2006gy, the observed luminosity of at 70 d after explosion requires a mass-loss rate for the progenitor of at least 2 M⊙ yr-1 for 5–10 yr before explosion. Similarly, a late-time luminosity of –0.3 at 400 d requires at least M⊙ yr-1 for 30 yr before the SN, if that luminosity arises from CSM interaction.
There are two interesting aspects of this derived mass-loss rate. First, it matches the value we found in Paper I from the luminosity of the narrow H component, tracing the (at that time) pre-shock ionized wind. This would seem suspicious if it were merely a coincidence. Second, it is still extremely high compared to the mass-loss rates measured for steady stellar winds of normal supergiant stars. A mass-loss rate of M⊙ yr-1 — while much lower than the value of 1 M⊙ yr-1 for Carinae during its 1840s eruption (Smith et al. 2003) and for SN 2006gy in the decade preceding the SN (Paper I) — is still about 100 times more than can be produced by a line-driven wind, and is representative of smaller LBV eruptions like that of P Cygni in 1600 A.D. (Smith & Hartigan 2006). Thus, CSM interaction requires two extraordinary phenomena: (1) an extreme giant LBV-like eruption such as Car in the 5–10 yr before explosion, plus (2) a sustained but less extreme eruption for several decades before that.
Some SNe of Types IIn and II-L decline very slowly, having relatively high luminosities even at late times, 1 yr after discovery. Two well-studied examples are SN 1988Z and SN 1979C (see Filippenko 1991, 1997; Turatto et al. 1993; Branch et al. 1981), with CSM interaction proposed as the cause of their long duration. Both were more luminous than a normal SN II, although still over 10 times less luminous than SN 2006gy. SN 1988Z also had strong radio and X-ray emission (Van Dyk et al. 1993; Fabian & Terlevich 1996). In both objects, broad or intermediate-width H emission continued to be very strong and easily detected for many years, as long as the SNe remained luminous. In SN 1988Z, the H luminosity peaked 1 yr after discovery and declined slowly thereafter (Turatto et al. 1993). In fact, bright H dominating the visual spectrum is seen in all other SNe II where CSM interaction powers the late-time luminosity (e.g., SN 1980K, SN 1986J, SN 1987F, SN 1993J; Leibundgut et al. 1991; Chugai 1990; Matheson et al. 2000). Recently, Milisavljevic et al. (2008) show that post-shock H emission from SN 1986J is still detectable. Similarly, the SN IIn 2006tf, which was contemporaneous with SN 2006gy and almost as luminous, also shows easily detected broad H emission in its late-time spectrum obtained 1.5 yr after explosion (Smith et al. 2008b). In general, the presence of strong, relatively broad H emission is a robust prediction for late-time CSM interaction (Chugai 1990, 1991).
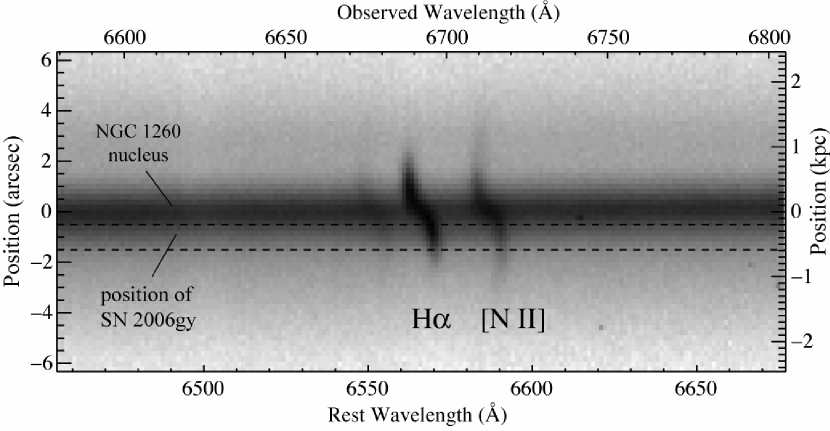
Figure 3 shows the red spectrum at the position of SN 2006gy. We detect continuum emission from the nucleus of NGC 1260, and narrow H and [N ii] from H ii regions. However, there is no hint of broad or intermediate-width H emission at the position of SN 2006gy. The failure to detect the -band continuum luminosity could conceivably be blamed on spatial resolution, but not the lack of relatively broad H emission. In order to go undetected in our LRIS spectrum in Figure 3, the broad/intermediate H flux must be less than the limiting background continuum level, which is roughly 210-17 erg s-1 cm-2 Å-1 at 20 mag. If the H component has a Doppler width of 1000 km s-1, this implies that the upper limit to the late-time H luminosity of SN 2006gy is 1039 erg s-1. To put this in perspective, the integrated H luminosity of SN 2006gy must be about 400 times weaker than those of SNe 2006tf and 1988Z at a similar epoch (Turatto et al. 1993; Smith et al. 2008b), even though the late-time bolometric luminosity of SN 2006gy was comparable to that of SN 2006tf, and about 10 times stronger than that of SN 1988Z.
Moreover, if continued CSM interaction were the power source, SN 2006gy should be extremely luminous in X-ray and (eventually) radio emission, analogous to SN 1988Z. However, X-ray observations of SN 2006gy obtained with Chandra on 2007 Dec. 15 were unable to detect SN 2006gy, with a preliminary analysis yielding an estimated upper limit to the 0.5–2 keV X-ray luminosity of 1.41039 erg s-1 (Pooley et al. 2008, in prep.). This X-ray luminosity is about 100 times less than that of SN 1988Z (Fabian & Terlevich 1996). SN 2006gy has faded compared to our previous X-ray observation (Paper I), and even the mass-loss rate of 10-4 M⊙ yr-1 implied by those earlier observations would have been 100 times too low to account for its late-time bolometric luminosity. Furthermore, no radio detection of SN 2006gy has been reported yet, and available upper limits on days 263, 265, 308, 434, and 538 (Bietenholz & Bartel 2007; Argo et al. 2007; Bietenholz 2008, priv. comm.) make it significantly less radio luminous than a typical SN IIn. Altogether, we find the case for ongoing CSM interaction as the dominant late-time luminosity engine of SN 2006gy to be quite weak.
3.3. Can Extinction from New Dust Resurrect the CSM-Interaction Hypothesis?
The bulk of the bolometric flux of SN 2006gy has shifted into the IR, and we have detected no visual-wavelength emission from the SN. One might ask if dust formation could obscure the optical continuum and H emission. Given the large amount of CSM mass inferred for this object (Paper I; Smith & McCray 2007; Woosley et al. 2007), dust formation might indeed have occurred in the dense post-shock shell, in a manner analogous to that of SN 2006jc (Smith et al. 2008a). The dust mass required to emit the observed -band luminosity (assuming K, so that the energy distribution peaks in the band) is M⊙ (adopting grain opacities in Draine 2003). At AU, this mass of dust could provide at red wavelengths, insufficient to hide an H luminosity equivalent to that of SN 1988Z.
Even so, some fine tuning would be required for newly formed dust to obscure the H emission and to re-emit the CSM-interaction luminosity. This is because the ongoing CSM interaction needed to power the late-time luminosity must occur outside the densest swept-up shell where the dust is most likely to form. The ongoing CSM interaction would occur at large radii as the shock plows into the gas lost before the LBV-like precursor outburst, as discussed above. Thus, there is no natural way for dust formed in the massive shocked shell (now well inside the blast wave) to block our view of that external CSM-interaction, and dust would be very inefficient at absorbing and re-emitting that shock luminosity. Furthermore, dust in any geometry could not explain the lack of radio emission noted earlier.
On the other hand, obscuration from dust that may have formed poses no difficulty for the pair-instability SN hypothesis. If sufficient dust formed in the dense shell or massive stellar envelope, it could conceivably block our view of the dominant internal energy source, which is radioactive decay from the central ejecta in that hypothesis. It would act as a calorimeter of that radioactivity, absorbing the luminosity and re-emitting it at IR wavelengths, as observed. If the radius of the shell is 103 AU ( km s-1 for 1 yr), then for the current luminosity of 2108 L⊙, the equilibrium grain temperature is 1000 K, giving a self-consistent explanation for the 2 flux.
3.4. A Large 56Ni Mass and the Pair-Instability SN Hypothesis
While the ongoing CSM-interaction hypothesis seems to have debilitating obstacles, the late-time luminosity and decline rate with weak H emission seem entirely consistent with a luminosity powered by radioactive decay from a large mass of 56Ni. If dust formed, as the IR data imply regardless of the luminosity source, then the shift to IR wavelengths can also be explained.222Alternatively, the IR shift may have been caused by hyperfine transitions in the cooled ejecta rather than continuum emission, analogous to the “IR catastrophe” predicted for SNe Ia (Axelrod 1980). IR spectra could be used to test this hypothesis.
The minimum luminosity derived from late-time IR magnitudes suggests that SN 2006gy is fading slowly. This decay rate is roughly consistent with that of 56Co (Fig. 2), as long as there is no strong color evolution between our two observations.
According to Figure 2, the minimum necessary 56Ni mass is 2.5 M⊙. This seems insufficient to account for the peak luminosity of SN 2006gy, which requires a higher 56Ni mass of 10–20 M⊙ (Paper I; Nomoto et al. 2007). However, the actual decline rate can be somewhat faster than the intrinsic 56Co decay rate if the ejecta become partly optically thin, underscoring again that 2.5 M⊙ is a lower limit. In fact, in the pair-instability SN model that Nomoto et al. (2007) presented for SN 2006gy, representing the explosion of a star with an initial mass of 166 M⊙, the late-time luminosity decline rate was faster than that of 56Co. With a 56Ni mass of 15 M⊙, the model of Nomoto et al. was able to give a satisfactory fit to the main light-curve peak, and it predicted a late-time luminosity that is within 30% of the observed value we present here. Thus, to the extent that such models are a fair representation of a pair-instability SN in the modern Universe (the model of Nomoto et al. did include significant mass loss from the progenitor, appropriate for the near-solar metallicity of SN 2006gy; Ofek et al. 2007; Paper I), it seems that the pair-instability SN hypothesis for SN 2006gy remains entirely valid, as long as dust can form in order to shift the energy distribution into the IR.
Although the estimate of 2.5 M⊙ is a lower limit, it could also be the case that the main peak of SN 2006gy is powered largely by optically thick CSM interaction (Smith & McCray 2007; see also Ofek et al. 2007; Paper I; Woosley et al. 2007), while the late-time luminosity may be powered by radioactive decay of 56Co. These two possibilities are not mutually exclusive. The 56Ni mass of 2.5 M⊙ is, in some sense, more reasonable than 10–20 M⊙ of 56Ni, because of the relaxed constraints on the initial stellar mass (Heger & Woosley 2002). This is roughly 4 times more than can be produced in energetic core-collapse SNe, for which Woosley & Weaver (1995) find maximum 56Ni yields of 0.7 M⊙.
3.5. An IR Echo From Another Massive LBV Shell
Some SNe IIn show strong near-IR emission 1 yr after explosion (e.g., Gerardy et al. 2002), usually interpreted in the framework of an IR echo, where UV and visual radiation from the SN at peak light has reached a dust shell at large radii. Thus, the dust is heated and reradiates the absorbed energy in the IR (Dwek 1983). A similar model could potentially explain the late-time IR luminosity of SN 2006gy, since its substantial reddening (Ofek et al. 2007; Paper I) implies a significant amount of CS dust along our line of sight.
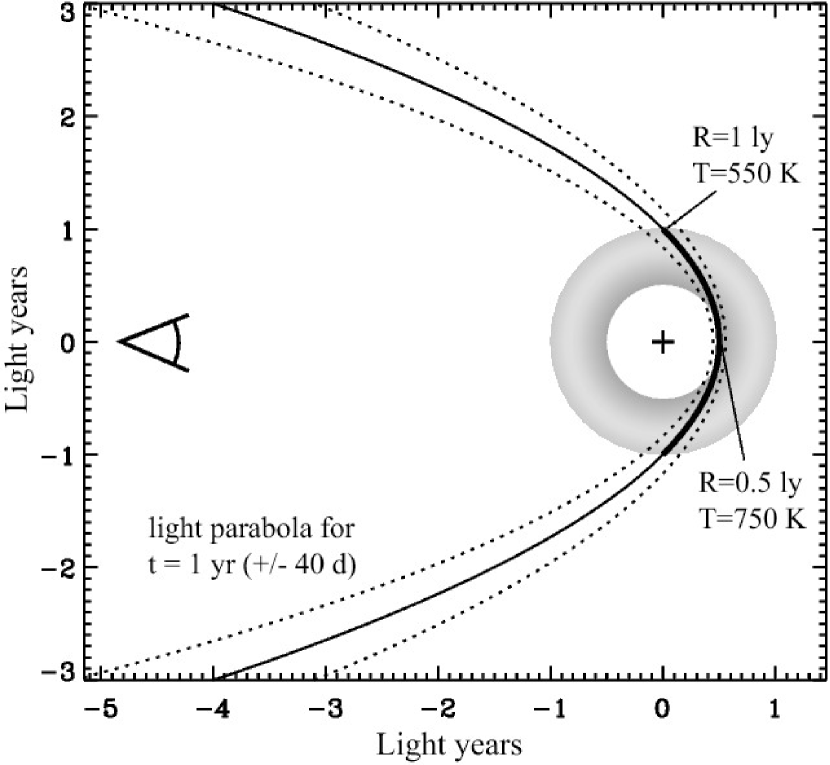
At about 1 yr after peak luminosity, we may see IR reradiation from heated dust located at the intersection where a light parabola corresponding to yr after the SN flash passes through a massive dusty shell at radii of 0.5–1 ly from the SN (Fig. 4). For a peak luminosity of 51010 L⊙ (Fig. 2), the equilibrium grain temperatures at those radii should be roughly 550–750 K. There may be additional dust at even larger radii along the light cone, but it will be even cooler and will not contribute substantially to the -band flux (Fig. 4). Thus, if this interpretation is correct, the SED should peak at wavelengths of 4–5 or longer.
The IR echo model has two important consequences: (1) the and mid-IR photometry should show an SED rising toward longer wavelengths plus a temperature that drops with time, and (2) the true dust luminosity is probably 5–10 times higher than our estimate in Figure 2, or at least 109 L⊙, because the band is on the Wien tail of a blackbody that peaks at 5 . With standard assumptions about dust grains at those radii and temperatures, the dust mass needed to account for that IR luminosity is at least 0.05–0.1 M⊙. The true dust mass in the shell must be vastly more, because this estimate only corresponds to the heated dust near the light cone (Fig. 4), which represents a small fraction of the total dust-filled volume. With a normal gas-to-dust ratio, this requires the existence of a pre-existing shell of more than 5–10 M⊙. At a radius of 1 ly, with a likely expansion speed of 200 km s-1 (Paper I), this shell would have been ejected by the progenitor star 1,500 yr ago.333The volume interior to this dust shell, but exterior to the current forward shock radius, is presumably filled with a steady low-density wind blown between the two massive shell ejections. We have no reliable constraints on this material, however, because it would have been illuminated when SN 2006gy was unobservable.
If this alternative IR echo hypothesis is correct, it greatly strengthens the comparison that we drew in Paper I between the progenitor of SN 2006gy and the massive star Carinae. Specifically, in Paper I we proposed this similarity based mainly on the requirement from the observed light-curve peak that it ejected 10–20 M⊙ of H-rich gas in the decade immediately before the SN. Now, with an IR echo, we find that the progenitor of SN 2006gy may have suffered violent pre-SN mass-loss episodes at least twice, with a previous LBV-like eruption occurring about 1500 yr ago. We did not predict this behavior for SN 2006gy, but it is something that is already well-established for Car: in addition to its 10–20 M⊙ nebula (Smith et al. 2003) that was ejected in the 19th-century eruption, Car has multiple shells at larger radii of the same size inferred here, indicating previous massive-shell ejections roughly 1000–2000 yr ago (Walborn 1976; Walborn et al. 1978; Smith & Morse 2004; Smith et al. 2005).
If this massive, older LBV-like shell exists around SN 2006gy, the observed bolometric light curve would not necessarily disagree with the original opaque shell-shocked model of Smith & McCray (2007), because now there is a different explanation for the late-time luminosity. This may pose some difficulty for the pulsational pair instability model of Woosley et al. (2007) as the explanation for the pre-SN mass ejection, however, which predicts a giant mass ejection in the decades before core collapse, as in SN 2006gy, but not 1000 yr before that. With two successive ejected shells of 10–20 M⊙ each, alternative pre-SN outburst mechanisms that have been proposed involving Ne flashes from degenerate cores of 11 M⊙ stars (Chugai & Danziger 2003; Weaver & Woosley 1979) are obviously ruled out in this particular case. (It should be noted that such flashes may have been a numerical artifact anyway, since they do not occur in more recent models; Woosley et al. 2002.)
Instead, the IR echo hypothesis for the late-time luminosity of SN 2006gy would imply that the precursor ejections of SN 2006gy were more akin to sporadic, giant LBV eruptions (Smith & Owocki 2006), one of which happened to occur (or was induced to occur) just before the explosion. If that link is valid, the implications for Car are provocative, and renewed efforts to diagnose the causes of such eruptions should be made a high priority for stellar evolution theory. Finally, if the IR echo model can fully account for the late-time IR luminosity, and if better limits can be placed on the optical luminosity, then this weakens the motivation for a large mass of 56Ni and the pair-instability hypothesis.
4. Summary
Interpretation of the late-time properties of SN 2006gy is admittedly complicated, adding to an already complex story from its early-time behavior. This is not so unusual in astronomy, when new observations of extreme objects push the limits of known physical parameters.
None of the three late-time luminosity sources that we have discussed match predictions of models for the early-time luminosity, and each has the unappealing property that it requires us to introduce some new aspect to the problem. The late-time CSM-interaction hypothesis requires us to invoke additional mass loss and asks us to ignore the extremely weak H, X-ray, and radio emission that are expected from the observed luminosity; the radioactive decay hypothesis requires new dust formation to shift the SED into the IR; and the IR-echo hypothesis requires that the progenitor star had ejected another shell of 10 M⊙ about 1500 yr before the SN, in addition to the one required 5–10 yr before for the main light curve peak. In light of these complications, it is useful to highlight some reasonably definite results from our analysis of the late-time properties of SN 2006gy.
First, we can rule out a model invoking traditional CSM interaction, where direct radiative cooling from ongoing shock interaction powers either the early-time or the late-time luminosity of SN 2006gy. This is due to the fact that post-shock H emission, X-rays, and radio emission are all orders of magnitude weaker than expected in such a model. In this respect, SN 2006gy is unique compared with other SNe IIn having similar longevity in their luminosity. We would not be surprised if there is some level of ongoing CSM interaction, of course, but our limits show that any continued CSM interaction is too weak to power the observed late-time IR luminosity. Because of the geometry, it is also difficult to explain the shift to IR wavelengths in a standard CSM-interaction scenario.
Second, on a more encouraging note, we can narrow down the possible interpretations of SN 2006gy to two fairly well-defined alternative models:
(1) So far, all observations seem consistent with the hypothesis that SN 2006gy was a genuine pair-instability SN, as long as we permit dust formation that shifts the late-time SED to longer IR wavelengths. For example, the model by Nomoto et al. (2007) for a star of initial mass 166 M⊙ that explodes as a pair-instability SN producing 15 M⊙ of 56Ni can explain both the main peak of the light curve and adequately accounts for the late-time luminosity we present here. The shift to IR wavelengths may be plausible too, since dust formation is predicted in some models for pair-instability SNe (Schneider et al. 2004). The level of CSM interaction indicated by the observed Type IIn spectrum, the H luminosity, and the observed X-ray emission require that the progenitor star had a modest mass-loss rate comparable to those of extremely luminous blue supergiants (Paper I), but this is not necessarily surprising since SN 2006gy occurred in an environment that was not metal poor (Paper I; Ofek et al. 2007). In fact, the model by Nomoto et al. (2007) did invoke significant pre-SN mass loss in order to explain the light-curve shape.
(2) The second plausible scenario is that the progenitor of SN 2006gy ejected a series of extremely massive H-rich shells (at least twice) before the explosion. Both of these shells had likely masses of 10–20 M⊙ or more. One was ejected within a decade before the SN, while the other was ejected 1,500 yr earlier if it had the same expansion speed of roughly 200 km s-1. The 10–20 M⊙ shell ejected in the decade preceding the SN and residing at a radius of 21015 cm is needed to explain the luminosity and light-curve shape at early times via an opaque diffusion model (Smith & McCray 2007; Woosley et al. 2007), whereas we infer that the shell of comparable mass ejected 1,500 yr earlier is needed to account for the late-time IR luminosity in the context of a thermal-IR echo from an extended dust shell at a radius of 0.5–1 ly.
If the first hypothesis is correct and SN 2006gy was indeed a pair-instability SN, then important implications follow. These SNe have thus far been discussed mainly in the context of very massive stars in the early Universe at very low metallicity. However, key assumptions about metallicity-dependent mass loss are not necessarily reliable for very massive stars, as pointed out by Smith & Owocki (2006). SN 2006gy would also imply that the nominal requirements of low metallicity for pair-instability SNe are relaxed, and that such explosions could occur at all epochs given a sufficiently massive star (see Paper I for additional discussion).
On the other hand, it could be argued that of the two hypotheses noted above, both of which seem plausible, the IR echo from a massive extended shell is arguably the more compelling, because its requirements have some precedent in the observed mass-loss history of stars like Carinae (e.g., Smith et al. 2003). We note that Barlow et al. (2005) also invoked a similar distant dust shell of 10 M⊙ in order to account for the IR echo of SN 2002hh. Since the progenitor of SN 2006gy may have suffered two violent mass ejections of 10 M⊙ or more separated by 1,500 yr, it is now unclear whether the episode in the decade immediately preceding SN 2006gy was tied directly to the final burning phases leading up to the SN explosion, or instead, if it may have been a coincidence that they occurred nearly simultaneously. In any case, these multiple violent mass ejections represent a fundamental challenge to our understanding of the late evolution and deaths of massive stars, and deserve a high priority in work on stellar evolution theory.
References
- (1)
- (2) Argo, M. K., Beswick, R. J., Muxlow, T. W. B., & Pedlar, A. 2007, ATel, 1084, 1
- (3)
- (4) Axelrod, T. C. 1980, PhD Thesis, Univ. of California, Santa Cruz
- (5)
- (6) Barkat, Z., Rakavy, G., & Sack, N. 1967, Phys. Rev. Lett., 18, 379
- (7)
- (8) Barlow, M. J., et al. 2005, ApJ, 627, L113
- (9)
- (10) Bietenholz, M., & Bartel, N. 2007, ATel, 1254, 1
- (11)
- (12) Bond, J. R., Arnett, W. D., & Carr, B. J. 1984, ApJ, 280, 825
- (13)
- (14) Branch, D., et al. 1981, ApJ, 244, 780
- (15)
- (16) Chevalier, R. A., & Fransson, C. 1985, in Supernovae as Distance Indicators, ed. N. Bartel (Berlin: Springer), 123
- (17)
- (18) Chevalier, R. A., Fransson, C., & Nymark, T. K. 2006, ApJ, 641, 1029
- (19)
- (20) Chugai, N. N. 1990, Sov. Astron. Let., 16, 457
- (21)
- (22) Chugai, N. N. 1991, MNRAS, 250, 513
- (23)
- (24) Chugai, N. N. 1992, Sov. Astron. Let., 36, 63
- (25)
- (26) Chugai, N. N., & Danziger, I.J. 2003, Astr. Lett., 29, 732
- (27)
- (28) Draine, B. T. 2003, ARA&A, 41, 241
- (29)
- (30) Dwek, E. 1983, ApJ, 274, 175
- (31)
- (32) Fabian, A.C., & Terlevich, R. 1996, MNRAS, 280, L5
- (33)
- (34) Filippenko, A. V. 1991, SN 1987A and Other Supernovae, ed. I. J. Danziger & K. Kjär (ESO: Garching), 343
- (35)
- (36) Filippenko, A. V. 1997, ARAA, 35, 309
- (37)
- (38) Filippenko, A. V., Li, W., Treffers, R. R., & Modjaz, M. 2001, in Small-Telescope Astronomy on Global Scales, ed. W. P. Chen, C. Lemme, & B. Pacyński (San Francisco: ASP, Conf. Ser. Vol. 246), 121
- (39)
- (40) Foley, R. J., et al. 2003, PASP, 115, 1220
- (41)
- (42) Gerardy, C. L., et al. 2002, ApJ, 575, 1007
- (43)
- (44) Heger, A., & Woosley, S. E. 2002, ApJ, 567, 532
- (45)
- (46) Leibundgut, B., et al. 1991, ApJ, 372, 531
- (47)
- (48) Matheson, T., et al. 2000, AJ, 120, 1487
- (49)
- (50) Milisavljevic, D., Fesen, R. A., Leibundgut, B., & Kirshner, R. P. 2008, preprint (arXiv:0804.1545)
- (51)
- (52) Nomoto, K., et al. 2007, in SN 1987A: 20 Years After, ed. S. Immler, K. Weiler, & R. McCray (Melville: AIP), 412
- (53)
- (54) Oke, J. B., et al. 1995, PASP, 107, 375
- (55)
- (56) Ofek, E. O., et al. 2007, ApJ, 659, L13
- (57)
- (58) Rakavy, G., & Shaviv, G. 1967, ApJ, 148, 803
- (59)
- (60) Schlegel, E. M. 1990, MNRAS, 244, 269
- (61)
- (62) Schneider, R., Ferrara, A., & Salvaterra, R. 2004, MNRAS, 351, 1379
- (63)
- (64) Smith, N., Foley, R. J., & Filippenko, A. V. 2008a, ApJ, 680, 568
- (65)
- (66) Smith, N., & Hartigan, P. 2006, ApJ, 638, 1045
- (67)
- (68) Smith, N., & McCray, R. 2007, ApJ, 671, L17
- (69)
- (70) Smith, N., & Morse, J. A. 2004, ApJ, 605, 854
- (71)
- (72) Smith, N., Morse, J. A., & Bally, J. 2005, AJ, 130, 1778
- (73)
- (74) Smith, N., & Owocki, S. P. 2006, ApJ, 645, L45
- (75)
- (76) Smith, N., et al. 2003, AJ, 125, 1458
- (77)
- (78) Smith, N., et al. 2007, 666, 1116 (Paper I)
- (79)
- (80) Smith, N., et al. 2008b, ApJ, submitted (arXiv:0804.0042)
- (81)
- (82) Turatto, M., et al. 1993, MNRAS, 262, 128
- (83)
- (84) Van Dyk, S. D., et al. 1993, ApJ, 419, L69
- (85)
- (86) Walborn, N. R. 1976, ApJ, 204, L17
- (87)
- (88) Walborn, N. R., Blanco, B. M., & Thackeray, A. D. 1978, ApJ, 219, 498
- (89)
- (90) Wizinowich, P., et al. 2006, PASP, 118, 297
- (91)
- (92) Woosley, S. E., & Weaver, T.A. 1995, ApJS, 101, 181
- (93)
- (94) Woosley, S. E., Heger, A., & Weaver, T. A. 2002, RvMP, 74, 1015
- (95)
- (96) Woosley, S. E., Blinnikov, S., & Heger, A. 2007, Nature, 450, 390
- (97)