Observations of GRB 060526 Optical Afterglow with Russian-Turkish 1.5-m Telescope
Abstract
We present the results of the photometric multicolor observations of GRB 060526 optical afterglow obtained with Russian-Turkish 1.5-m Telescope (RTT150, Mt. Bakirlitepe, Turkey). The detailed measurements of afterglow light curve, starting from about 5 hours after the GRB and during 5 consecutive nights were done. In addition, upper limits on the fast variability of the afterglow during the first night of observations were obtained and the history of afterglow color variations was measured in detail. In the time interval from 6 to 16 hours after the burst, there is a gradual flux decay, which can be described approximately as a power law with an index of . After that the variability on the time scale is observed and the afterglow started to decay faster. The color of the afterglow, , is approximately the same during all our observations. The variability is detected on time scales up to at , which violates some constraints on the variability of the observed emission from ultrarelativistic jet obtained by Ioka et al. (2005). We suggest to explain this variability by the fact that the motion of the emitting shell is no longer ultrarelativistic at this time.
keywords:
gamma-ray bursts — afterglow — optical observations20073312797[803]
June 22, 2007
INTRODUCTION
More than a hundred gamma-ray bursts (GRBs) optical afterglows have been detected to date, mostly after observations of GRBs by HETE-II (Lamb et al., 2004) and SWIFT (Gehrels et al., 2004) satellites. The photometric observations of GRB optical afterglows are largely consist of only a few measurements on time scales from several hours to days. The number of afterglows with the light curves measured in more detail is not large and each of them is of considerable interest.
In this paper we present our multicolor photometry of the optical afterglow from GRB 060526, carried out with Russian-Turkish 1.5-m Telescope (RTT150) at the TÜBİTAK National Observatory (Mount Bakirlitepe, Turkey). With RTT150 telescope it was possible to obtain the detailed measurements of afterglow light curve, starting from about 5 hours after the GRB and during 5 consecutive nights. We obtained more than 200 afterglow brightness measurements in the first night and more than 20 sensitive measurements in the subsequent nights.
Gamma-ray burst 060526
GRB 060526 was detected by SWIFT instruments on May 26, 2006, at 16:28:30 UT. The gamma-ray burst demonstrated a multipeak light curve with a duration of about 20 s, then a well separated second period of activity starting after about 200 s was observed. According to its characteristics in gamma-rays (Markwardt et al., 2006), it was a typical “long” burst. The X-ray and optical telescopes of SWIFT satellite were pointed to the burst about 70 sec after the trigger and found previously unknown X-ray and optical source (Campana et al., 2006).
The ground-based observations of the optical transient were started as early as 36 sec after the beginning of gamma-ray burst using an automatic 40-cm telescope (French and Jelinek, 2006) and were continued using larger telescopes (Khamitov et al., 2006; Dai et al., 2007; Covino et al., 2006; Lin et al., 2006; Greco et al., 2006; Thoene et al., 2006; Cobb, 2006; Rumyantsev and Pozanenko, 2006; Kann & Hoegner, 2006; Baliyan et al., 2006; Terra et al., 2006; Kann & Laux, 2006; Sharapov et al., 2006; Rumyantsev et al., 2006). The redshift of the GRB source, , was measured later using 6.5-m Magellan telescope (Berger and Gladders, 2006).
Considerable part of all photometric measurements of the light curve was obtained with the Russian-Turkish 1.5-m Telescope. The results of these observations are presented in this paper.
OBSERVATIONS
The observational time on the telescope RTT150 was scheduled in frames target of opportunity observations (TOO) program, according to the agreement between all participants of the project. Observations of the afterglow field were performed using CCD-photometer, based on thermoelectrically cooled Andor CCD. The observations were made with binning, which gives 0.48\arcsec per bin angular scale.
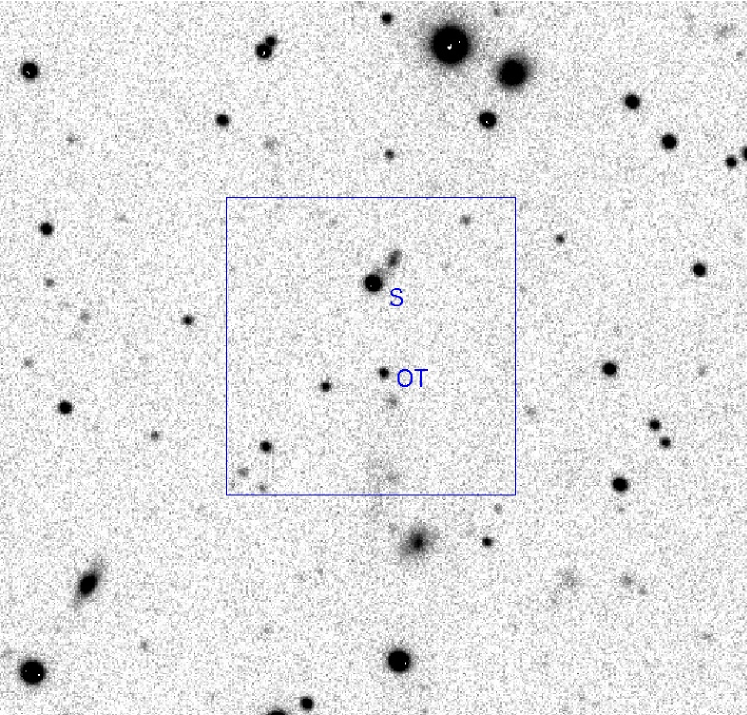
Because of insufficiently good weather conditions on the night of May 26, the telescope could not be pointed at the afterglow immediately after the Bacodine alert was received. The telescope was pointed at the GRB field only 5.44 h later. The entire field was immediately imaged in the bands. The image obtained at this time is shown in Fig. 1. This figure also shows the star used in the observations as a reference and the optical transient as it was during the first hours after the GRB.
Once the optical transient was detected in all images, a smaller field around it with size pixels (, Fig. 1) was chosen and a few sets of the 30 short 30 s exposures were made. In this mode CCD readout time was 10 s. In order to measure the colors of the afterglow, several 300 s exposures in B and V bands were made between the sets.
Time, days
Magnitude,
During the next night the field was imaged in bands. In subsequent nights from 28 to 31 May, the field was observed in bands. Observations were made only in band in the nights of and June. Observations were continued until the afterglow faded below the detection limit of telescope in a few hours of the exposure. In order to obtain photometrical calibrations, the observations of Landolt (1992) photometric standards were carried out every night. The data were processed using standard IRAF software111http://iraf.noao.edu.
For our photometric measurements the sizes of the apertures were selected to achieve best signal-to-noise ratio. The magnitudes were obtained based on the photometric solutions for Landolt (1992) standard stars. For the reference star, shown in Fig. 1, the following magnitudes were obtained: B=17.67, V=16.90, Rc=16.48.
RESULTS
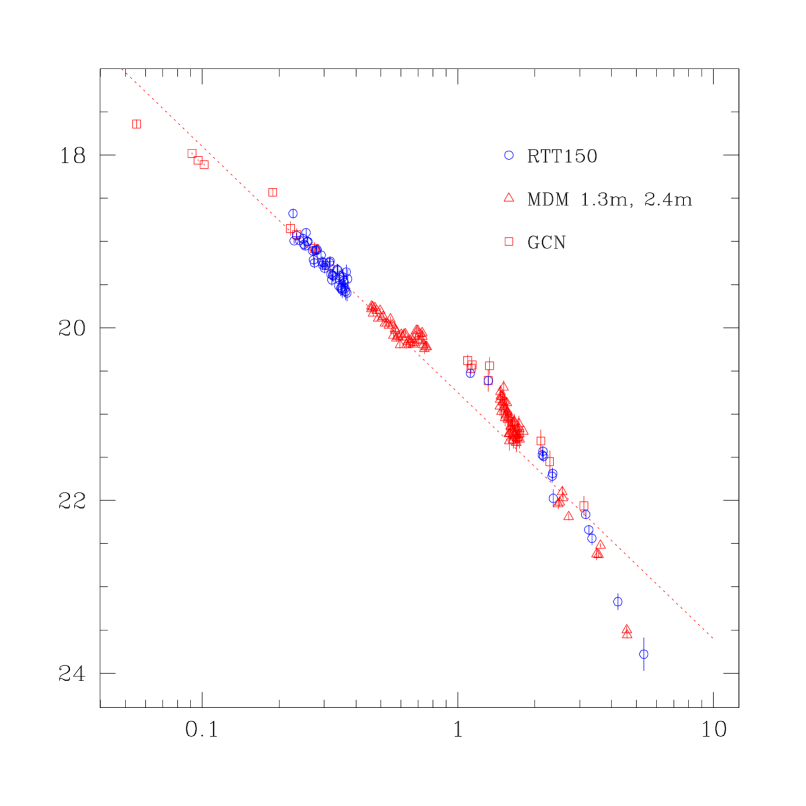
In Fig. 2 the light curve of the afterglow for the entire period of observation is shown. The data in time interval from 5 to 14 hours after the burst are well fitted by a power law with the index , in agreement with the results of Dai et al. (2007). This dependence is shown in Fig. 2 by dotted line. At h, the decline of the light curve is flatter; at h, a re-brightening, some variability, and then faster decay of the optical afterglow flux are observed. Closer to the end of our observations, the afterglow decays rapidly. For days, the fading corresponds to the power law with index , also in agreement with Dai et al. (2007). We note that the RTT150 observations comprise about a half of the useful measurements of the afterglow magnitude for this burst.
Time, hours
Magnitude,
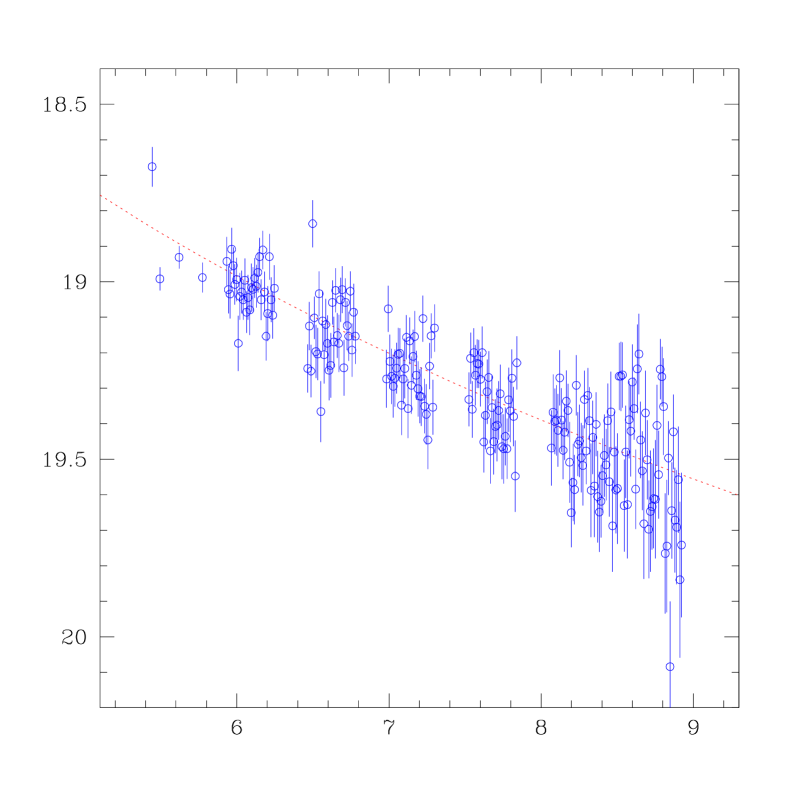
During the first night of our observations, more than 200 flux measurements were made in bands. The results of the light curve measurements for the first night in band are presented in Table 1 and the corresponding light curve is shown in Fig. 3. Taking into account the smooth flux decay, the statistical dispersion of measurement is , which increases a little during the last hour of observations due to the increasing sky background at dawn. Two points close to 5.4 h and 6.4 h, respectively, deviate from the general series as if the afterglow brightness increased at this moment by 20–30%. It is possible that this is due to some systematic errors. However, we could not determine their origin.
| Time, h | error | |
|---|---|---|
| 5.4430 | 18.676 | 0.056 |
| 5.4941 | 18.992 | 0.033 |
| 5.6201 | 18.931 | 0.032 |
| 5.7739 | 18.988 | 0.042 |
| 5.9378 | 18.943 | 0.068 |
| 5.9485 | 19.023 | 0.066 |
| 5.9594 | 19.035 | 0.068 |
| 5.9702 | 18.909 | 0.059 |
| 5.9809 | 18.955 | 0.050 |
| 5.9917 | 19.008 | 0.056 |
| … | … | … |
Note: — The complete version of this table is available in electronic version of the journal, and also at: http://hea.iki.rssi.ru/grb/060526/indexeng.html
The agreement between the dispersion of magnitudes measurements shown in Fig. 3 and the statistical errors, calculated from the data, is sufficiently good. That means that there are essentially no unaccounted systematic errors in our measurements. In addition, it suggests that the afterglow flux is not variable on time scale s. The value of the scatter gives a conservative upper limit on the fast variability of the afterglow on that time scale, . This agrees well with the observations GRB 030329 afterglow, when even more stringent constraints were obtained for the fast variability at the early afterglow phase (Burenin et al., 2003).
Time, hours
Magnitude
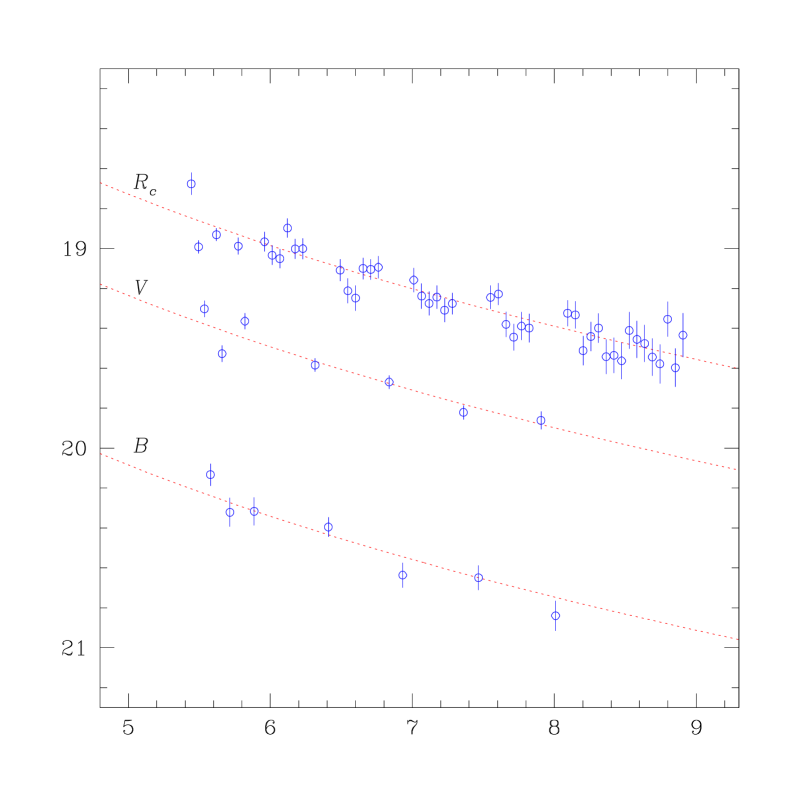
The light curves of the afterglow in bands are shown in Fig. 4. For the band, the values at each point were calculated using five combined images to decrease possible systematic errors. The fitting of these light curves with power laws gives the indices , , and in , , and bands, respectively. These values are in agreement with each other within the errors of measurements. However, they are slightly different from the index given above based on the data of RTT150 and 1.3-m MDM telescopes during the time interval from 5 to 14 hours after the burst. Therefore, the power law probably does not provide a good fit to the data even in this short time interval. Alternatively, the small difference in the absolute afterglow flux calibration between the telescopes may also have an effect here. The mean color indices in the first night of observations, not corrected for the interstellar absorption, are , .
Frequency, Hz
, mJy
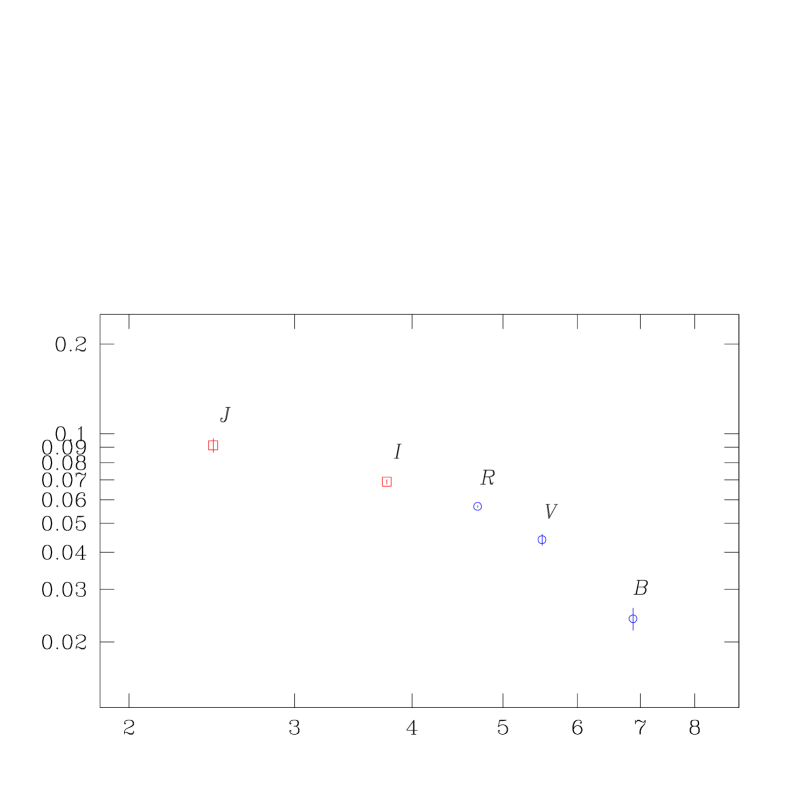
The spectral energy distribution of the afterglow over the 8.7 hours after the gamma-ray burst, corrected for the Galactic extinction, (Schlegel et al., 1998), is shown in Fig. 5. The points, corresponding to and bands, are calculated by extrapolating the power low obtained in the time interval from 5 to 8 hours, assuming the constant colors of the afterglow at that time. The data in , bands were taken from the results of the observations made by 1.3-m CTIO telescope (Cobb, 2006).
Time, days
Color index
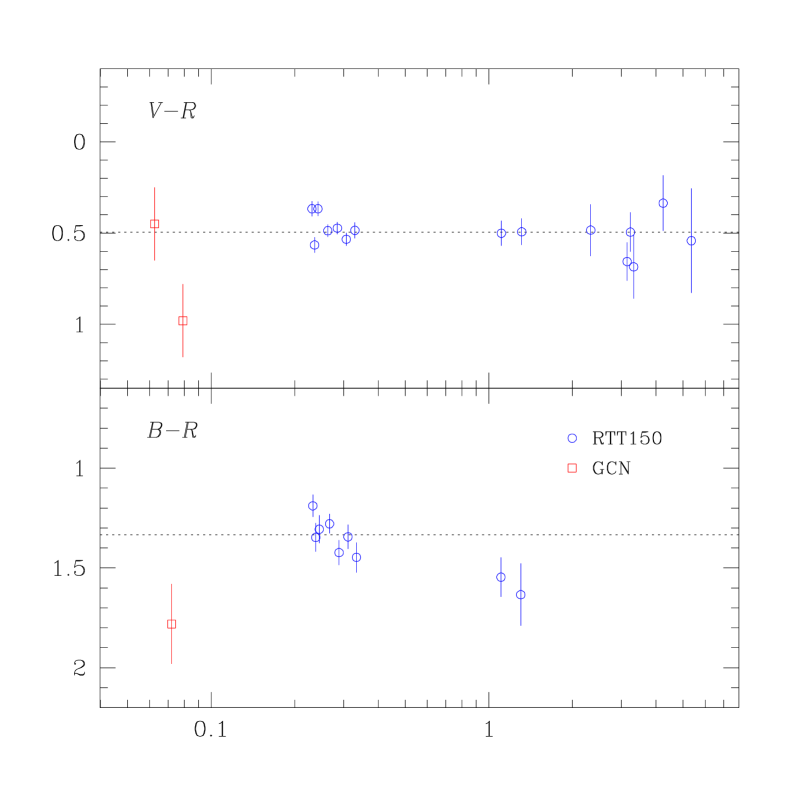
The history of afterglow color changes during the all our observations is shown in Fig. 6. The color index proves to be exactly constant over all our observations. The color index changes so that the afterglow gets somewhat more red in the second night of our observations with the color . Before the time, when our telescope was pointed to the afterglow, its color can be estimated using the data in band from ground based telescopes: 1-m of Lyulin observatory (Lin et al., 2006) and 1.5-m telescope of Maidanak high-altitude observatory (Rumyantsev et al., 2006) and the data in bands from UVOT telescope onboard of SWIFT (Brown et al., 2006). Corresponding points are shown in the Fig. 6 as squares. Probably, at h, the afterglow was also redder than during our observations from 5.4 to 9 h after the burst.
The results of measurements of the afterglow light curve in bands are given in Table 2, which contain the values plotted in Fig. 2 and used for color calculation in Fig. 6. In comparison to the results published in GCN circulars (Khamitov et al., 2006), the data were reprocessed carefully and the measurements here are more reliable.
| Time, days | Filter | magnitude | error |
|---|---|---|---|
| 0.22679 | 18.676 | 0.056 | |
| 0.22892 | 18.992 | 0.033 | |
| 0.23067 | 19.302 | 0.041 | |
| 0.23242 | 20.133 | 0.056 | |
| 0.23417 | 18.931 | 0.032 | |
| 0.23583 | 19.527 | 0.042 | |
| 0.23813 | 20.321 | 0.072 | |
| 0.24058 | 18.988 | 0.042 | |
| 0.24254 | 19.364 | 0.040 | |
| 0.24525 | 20.316 | 0.070 | |
| … | … | … | … |
Note: — The complete version of this table is available in electronic version of the journal, and also at: http://hea.iki.rssi.ru/grb/060526/indexeng.html
DISCUSSION
In this paper we present the results of detailed observations of the light curve of GRB 060526 optical afterglow carried out with Russian-Turkish 1.5-m Telescope (RTT150). Our observations provide about a half of all photometric measurements obtained for this afterglow. The upper limits to afterglow variability during the first night of our observations were obtained, and the history of afterglow color changes is measured in detail.
The afterglow observations of GRB 060526 were also discussed in detail in the paper by Dai et al. (2007), who also used our data taken from GCN Circulars (Khamitov et al., 2006), where it was pointed out that the changes of the power law index occurred approximately simultaneously in optical and X-ray bands. This should be expected in the case if this break occur in result of change of the geometry of the motion of the ejecta. For example, this may occur when the gamma factor of the jet becomes smaller than the reciprocal of its opening angle and a sideways expansion of the jet begins.
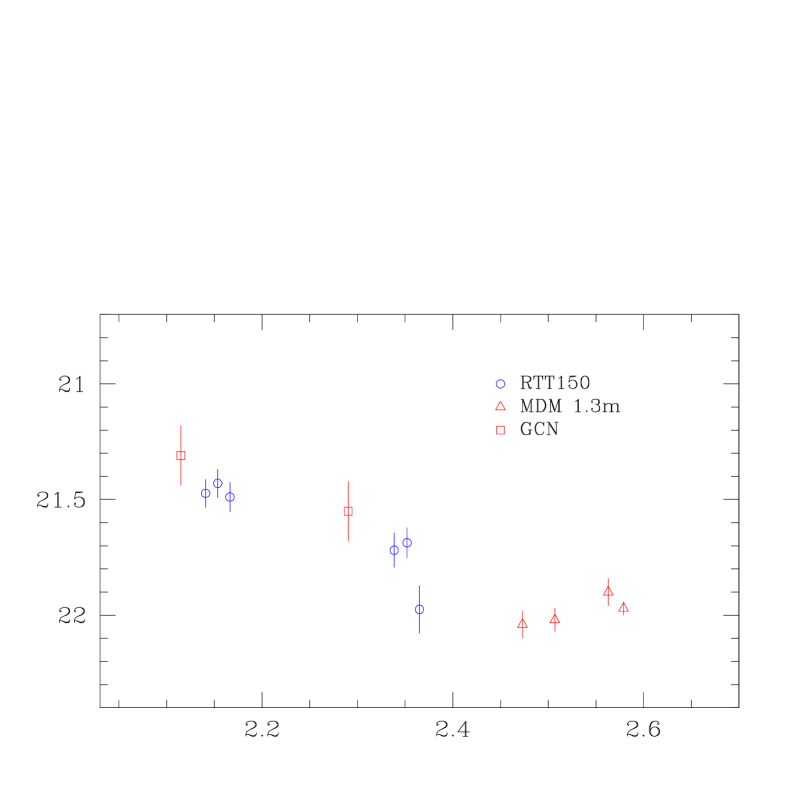
Dai et al. (2007) also discussed the presence of optical variability in the afterglow (Fig. 2). They noted the presence of flare activity starting from h and found that the relation for these flares poorly satisfies the constraints for various variability models of ultrarelativistic jet (Ioka et al., 2005). Our data allow to make even stronger conclusions. Fig. 7 shows a segment of the afterglow light curve about two days after the GRB. We see that, according to our measurements, a sharp change occurs in the light curve at days — the brightness declines by in approximately 20 min. This change corresponds to and the constraints on the variability of the observed emission from an ultrarelativistic jet obtained by Ioka et al. (2005) are violated with a large margin.
Time, days
Magnitude,
The main condition from which the constraints on the variability were obtained by Ioka et al. (2005) is an ultra-relativistic motion of the jet towards the observer. Actually, however, the jet motion may well become moderately relativistic even on day time scale at higher densities of the ambient interstellar medium or in the presence of dense stellar wind (Burenin, 2007).
If the motion is no longer ultrarelativistic, then fast variability similar to that discussed above (Fig. 7) can be explained much more easily, for example, by the presence of density inhomogeneities in the stellar wind around the GRB source. This may be expected, since the stellar winds around Wolf-Rayet stars are highly inhomogeneous and have a clumpy structure (e.g., Crowther, 2007). In this case, the sizes of the density inhomogeneities are cm (Figs. 2 and 7). Such inhomogeneities are possible in the winds from Wolf-Rayet stars at large distances from the star (Lepine et al., 2000).
The power law index of the lightcurve at the end of our observations at days, (Fig. 2) seems to be too steep for the non-relativistic stage of shell expansion phase, when the shell expands according to the Sedov solution for a strong explosion and the emission is generated by electrons accelerated at the shock front (Huang and Cheng, 2003). However, this slope is also too steep for the emission of an ultra-relativistic jet after the beginning of its sideways expansion (Dai et al., 2007). Note, that this slope was measured on a very short time scale and may not reflect the rate of afterglow decline on a longer time scales. The sharp decrease in radiation flux after the individual flares can be determined, for example, by the shapes of individual density inhomogeneities or even by the cooling time of optically emitting electrons.
We also note, that the spectral energy distribution in optical and infrared bands is not a power law, already at 9 hours after the burst and during at least a day of observations (Fig. 5, 6). This may suggest that there is a thermal radiation component in the spectrum that can originate only in a nonrelativistic shock, where the particles at the front are not accelerated to ultrarelativistic energies. On the other hand, this may suggest the presence of absorption in a dense medium around the source.
The observed variability can probably be also explained with the assumption of the ultrarelativistic motion of the jet, for example, assuming the presence of late inner engine activity (Ioka et al., 2005). Regarding the afterglow from GRB 060526, this question was discussed in detail by Dai et al. (2007). The explanation related to the transition to subrelativistic motion is offered here only as a possibility. This would require a higher density of the ambient interstellar meduim or a dense stellar wind around the source, which are, actually, expected in star-forming regions and around massive Wolf-Rayet stars (see also Burenin, 2007).
Acknowledgements.
We are grateful to anonymous referee for useful comments. This work is supported by the Russian Fund for Basic Researches (grants 05-02-16540, 07-02-01004), by Russian Government Program of Leading Science Schools Support (grants 784.2006.2, 1100.2006.2), and by the programs of Russian Academy of Sciences (P-04, OFN-17). The work of one of the coauthors (RB) was also supported by grant of President of Russian Federation MK-4064.2005.2.References
- Baliyan et al. (2006)
- [2] \gcnc51852006
- Berger and Gladders (2006)
- [4] \gcnc51702006
- Brown et al. (2006)
- [6] \gcnc51722006
- Burenin et al. (2003)
- [8] 295732003 [\pazh, 29, 649; astro-ph/0306137]
- Burenin (2007)
- [10] 338042007 [\pazh, 33, 899]
- Campana et al. (2006)
- [12] \gcnc5162,51632006
- Cobb (2006)
- [14] \gcnc51802006
- Covino et al. (2006)
- [16] \gcnc51672006
- Crowther (2007)
- [18] ARA&A, in press (2007); astro-ph/0610356
- Dai et al. (2007)
- [20] 6585092007
- French and Jelinek (2006)
- [22] \gcnc51652006
- Gehrels et al. (2004)
- [24] 61110052004
- Greco et al. (2006)
- [26] \gcnc51712006
- Huang and Cheng (2003)
- [28] 3412632003
- Ioka et al. (2005)
- [30] 6314292005
- Kann & Laux (2006)
- [32] \gcnc52022006
- Kann & Hoegner (2006)
- [34] \gcnc51822006
- Khamitov et al. (2006)
- [36] \gcnc5173,5177,5183,5186,5189,51932006
- Landolt (1992)
- [38] 1043401992
- Lamb et al. (2004)
- [40] 484232004
- Lepine et al. (2000)
- [42] 12032012000
- Lin et al. (2006)
- [44] \gcnc51692006
- Markwardt et al. (2006)
- [46] \gcnc51742006
- Rumyantsev and Pozanenko (2006)
- [48] \gcnc51812006
- Rumyantsev et al. (2006)
- [50] \gcnc53062006
- Terra et al. (2006)
- [52] \gcnc51922006
- Thoene et al. (2006)
- [54] \gcnc51792006
- Sharapov et al. (2006)
- [56] \gcnc52662006
- Schlegel et al. (1998)
- [58] 5005251998