NLTE determination of the aluminium abundance in a homogeneous sample of extremely metal-poor stars ††thanks: Based on observations obtained with the ESO Very Large Telescope at Paranal Observatory, Chile (Large Programme “First Stars”, ID 165.N-0276(A); P.I.: R. Cayrel).
Abstract
Aims. Aluminium is a key element to constrain the models of the chemical enrichment and the yields of the first supernovae. But obtaining precise Al abundances in extremely metal-poor (EMP) stars requires that the non-LTE effects be carefully taken into account.
Methods. The NLTE profiles of the blue resonance aluminium lines have been computed in a sample of 53 extremely metal-poor stars with a modified version of the program MULTI applied to an atomic model of the Al atom with 78 levels of Al I and 13 levels of Al II, and compared to the observations.
Results. With these new determinations, all the stars of the sample show a ratio Al/Fe close to the solar value: with a very small scatter. These results are compared to the models of the chemical evolution of the halo using different models of SN II and are compatible with recent computations. The sodium-rich giants are not found to be also aluminium-rich and thus, as expected, the convection in these giants only brings to the surface the products of the Ne-Na cycle.
Key Words.:
Line : Formation – Line : Profiles – Stars: Abundances – Stars: Mixing – Stars: Supernovae – Galaxy evolutione-mail: Monique.Spite@obspm.fr
1 Introduction
In the early stages of Galactic evolution, aluminium nuclei are built by massive SN II. Aluminium is produced by hydrostatic carbon and neon burning and is later expelled in the interstellar medium during the explosion. The explosion does not affect the yields significantly. At low metallicity the aluminium production is mainly based on produced by He burning: it can be considered as a primary production (independent of the metallicity of the supernova). However it has been shown that the aluminium yields depend on the available neutron excess and thus on the metallicity of the progenitor. Aluminium can then behave as a secondary element (see Arnett, 1971, 1996, and also Gehren et al., GSZ06 (2006)). At low metallicity it is expected that the primary production dominates and, as a consequence, the ratio [Al/Fe] should be almost constant.
Available data on LTE aluminium abundances in stars of different metallicities (see e.g. Figure 10 of Samland 1998, Baumüller & Gehren 1997 and references therein, Norris et al. 2001, Tsujimoto et al. 2002, Zhang & Zhao, 2006) show that the behaviour of the ratio [Al/Fe] is quite complex and the scatter at low metallicity is so large that it is difficult to determine a trend. Standard models of chemical evolution are not able to predict the scatter of abundance ratios. One mechanism for introducing the required inhomogeneity is e.g. the model proposed by Tsujimoto et al. (1999) in which each newly formed star inherits the elemental abundance pattern of an individual SNe (for an inhomogeneous model, see also Argast et al. 2000). With this hypothesis Tsujimoto et al. (2002) could deduce from the large scatter of the aluminium abundance at low metallicity, the yields of aluminium in massive supernovae as a function of their metallicity ( for ).
This is possible only if we can assume that the aluminium abundance measured in the atmosphere of the old stars reflects the abundance in the interstellar medium at the time of the star formation. For example a mixing between the surface and the deep layers of the stars where aluminium is formed (AGB stars), could artificially increase the original abundance of aluminium in the atmosphere of the stars (Herwig 2005, Spite et al. 2006).
Furthermore, NLTE effects, generally neglected, can affect the abundance computations as a function of the temperature, the gravity and the metallicity of the star. At low metallicity the NLTE corrections become rather large, in particular because at the aluminium abundance can be deduced only from the resonance lines at 3944 and 3962 Å which are known to be strongly affected by NLTE effects.
In this paper we present a homogeneous NLTE determination of the aluminium abundance in a sample of 51 normal (not carbon-rich) Extremely Metal Poor (EMP) stars; 18 are turnoff stars, 33 giants and among them 29 have . These stars have been analysed (LTE analysis) by Cayrel et al. (CDS04 (2004)) and Bonifacio et al. (BMS07 (2007)). In a previous paper (Andrievsky et al. 2007) we have determined the sodium abundance in this sample of stars taking into account NLTE effects.
Several papers have taken into account NLTE line formation in the determination of the aluminium abundance in metal-poor stars (mainly Gehren et al. 2004, 2006) and the scatter of the ratios [Al/Mg] or [Al/Fe], in the considered metallicity range, has been strongly reduced. The sample of Gehren et al., does not reach a [Fe/H] value lower than about –2.5; our sample extends this work down to [Fe/H]= –4.
2 The star sample
The observed spectra of the stars investigated here have been presented in detail in Cayrel et al. (2004) and Bonifacio et al. (BMS07 (2007)). However, in the present paper the carbon-rich stars of their sample, 2 giants and 1 turnoff star, that need specific models, have not been taken into account and will be studied later.
The observations were performed with the high resolution spectrograph UVES at ESO-VLT. The resolving power of the spectrograph in the region of the blue aluminium lines is , the S/N per pixel in this region of the spectra is close to 120 and there are about 5 pixels per resolution element.
The fundamental parameters of the models (Teff, log g, metallicity) have been derived by Cayrel et al. (CDS04 (2004)) for the giants and Bonifacio et al. (BMS07 (2007)) for the turnoff stars. Briefly, temperatures of the giants are deduced from the colours with the calibration of Alonso et al. (AAM99 (1999), AAM01 (2001)), and temperatures of the turnoff stars from the wings of the line.
For the turnoff stars, the temperatures deduced from the colours with the calibration of Alonso et al. (AAM96 (1996)) are in good agreement with the temperatures (standard deviation 100 K). On the contrary, the temperatures derived from the Ramírez & Meléndez (RM05 (2005)) calibration are considerably higher and incompatible with the temperatures. Moreover, with the calibration of Alonso et al. (AAM96 (1996)) the abundance trend of the Fe I lines with excitation potential is less than 0.06dex/eV. On the contrary with the high derived from the Ramírez and Meléndez calibration, no iron-excitation equilibrium is achieved (see Bonifacio et al. (BMS07 (2007)) for more details).
These discrepancies suggest that a systematic error in the adopted temperatures of the order of 200 K is possible (Bonifacio et al., BMS07 (2007)) although unlikely.
The gravities are from the ionisation equilibrium of iron (in the LTE approximation) and we note that they could be affected by non-LTE effects.
The parameters of the models are repeated in Table 1 for the reader’s convenience.
| star | vt, km s-1 | [Fe/H] | log (Al) | [Al/H] | [Al/Fe] | Rem | ||
| turnoff stars | ||||||||
| BS 16023–046 | 6360 | 4.5 | 1.4 | –2.97 | 3.20 | –3.27 | –0.30 | |
| BS 16968–061 | 6040 | 3.8 | 1.5 | –3.05 | 3.30 | –3.17 | –0.12 | |
| BS 17570–063 | 6240 | 4.8 | 0.5 | –2.92 | 3.25 | –3.22 | –0.30 | |
| CS 22177–009 | 6260 | 4.5 | 1.2 | –3.10 | 3.28 | –3.19 | –0.09 | |
| CS 22888–031 | 6150 | 5.0 | 0.5 | –3.28 | 3.10 | –3.37 | –0.09 | |
| CS 22948–093 | 6360 | 4.3 | 1.2 | –3.43 | 3.00 | –3.47 | –0.04 | |
| CS 22953–037 | 6360 | 4.3 | 1.4 | –2.89 | 3.50 | –2.97 | –0.08 | |
| CS 22965–054 | 6090 | 3.8 | 1.4 | –3.04 | 3.40 | –3.07 | –0.03 | |
| CS 22966–011 | 6200 | 4.8 | 1.1 | –3.07 | 3.25 | –3.22 | –0.15 | |
| CS 29499–060 | 6320 | 4.0 | 1.5 | –2.70 | 3.50 | –2.97 | –0.27 | |
| CS 29506–007 | 6270 | 4.0 | 1.7 | –2.91 | 3.48 | –2.99 | –0.08 | |
| CS 29506–090 | 6300 | 4.3 | 1.4 | –2.83 | 3.55 | –2.92 | –0.09 | |
| CS 29518–020 | 6240 | 4.5 | 1.7 | –2.77 | – | – | – | |
| CS 29518–043 | 6430 | 4.3 | 1.3 | –3.24 | 3.05 | –3.42 | –0.18 | |
| CS 29527–015 | 6240 | 4.0 | 1.6 | –3.55 | 2.97 | –3.50 | 0.05 | |
| CS 30301–024 | 6330 | 4.0 | 1.6 | –2.75 | 3.60 | –2.87 | –0.12 | |
| CS 30339–069 | 6240 | 4.0 | 1.3 | –3.08 | 3.17 | –3.30 | –0.22 | |
| CS 31061–032 | 6410 | 4.3 | 1.4 | –2.58 | 3.70 | –2.77 | –0.19 | |
| giants | ||||||||
| HD 2796 | 4950 | 1.5 | 2.1 | –2.47 | 4.08 | –2.39 | 0.08 | m |
| HD 122563 | 4600 | 1.1 | 2.0 | –2.82 | 3.55 | –2.92 | –0.10 | m |
| HD 186478 | 4700 | 1.3 | 2.0 | –2.59 | 3.95 | –2.52 | 0.07 | m |
| BD +17:3248 | 5250 | 1.4 | 1.5 | –2.07 | 4.50 | –1.97 | 0.10 | m |
| BD –18:5550 | 4750 | 1.4 | 1.8 | –3.06 | 3.35 | –3.12 | –0.06 | |
| CD –38:245 | 4800 | 1.5 | 2.2 | –4.19 | 2.35 | –4.12 | 0.07 | m |
| BS 16467–062 | 5200 | 2.5 | 1.6 | –3.77 | 2.60 | –3.87 | –0.10 | |
| BS 16477–003 | 4900 | 1.7 | 1.8 | –3.36 | 3.00 | –3.47 | –0.11 | |
| BS 17569–049 | 4700 | 1.2 | 1.9 | –2.88 | 3.50 | –2.97 | –0.09 | m |
| CS 22169–035 | 4700 | 1.2 | 2.2 | –3.04 | 3.10 | –3.37 | –0.33 | m |
| CS 22172–002 | 4800 | 1.3 | 2.2 | –3.86 | 2.65 | –3.82 | 0.04 | |
| CS 22186–025 | 4900 | 1.5 | 2.0 | –3.00 | 3.30 | –3.17 | –0.17 | m |
| CS 22189–009 | 4900 | 1.7 | 1.9 | –3.49 | 2.74 | –3.73 | –0.24 | |
| CS 22873–055 | 4550 | 0.7 | 2.2 | –2.99 | 3.45 | –3.02 | –0.03 | m |
| CS 22873–166 | 4550 | 0.9 | 2.1 | –2.97 | 3.45 | –3.02 | –0.05 | m |
| CS 22878–101 | 4800 | 1.3 | 2.0 | –3.25 | 3.10 | –3.37 | –0.12 | m |
| CS 22885–096 | 5050 | 2.6 | 1.8 | –3.78 | 2.80 | –3.67 | 0.11 | |
| CS 22891–209 | 4700 | 1.0 | 2.1 | –3.29 | 3.15 | –3.32 | –0.03 | m |
| CS 22896–154 | 5250 | 2.7 | 1.2 | –2.69 | 3.84 | –2.63 | 0.06 | |
| CS 22897–008 | 4900 | 1.7 | 2.0 | –3.41 | 2.95 | –3.52 | –0.11 | |
| CS 22948–066 | 5100 | 1.8 | 2.0 | –3.14 | 3.20 | –3.27 | –0.13 | m |
| CS 22952–015 | 4800 | 1.3 | 2.1 | –3.43 | 3.05 | –3.42 | 0.01 | m |
| CS 22953–003 | 5100 | 2.3 | 1.7 | –2.84 | 3.45 | –3.02 | –0.18 | |
| CS 22956–050 | 4900 | 1.7 | 1.8 | –3.33 | 3.15 | –3.32 | 0.01 | |
| CS 22966–057 | 5300 | 2.2 | 1.4 | –2.62 | 4.00 | –2.47 | 0.15 | |
| CS 22968–014 | 4850 | 1.7 | 1.9 | –3.56 | 2.75 | –3.72 | –0.16 | |
| CS 29491–053 | 4700 | 1.3 | 2.0 | –3.04 | 3.36 | –3.11 | –0.07 | m |
| CS 29495–041 | 4800 | 1.5 | 1.8 | –2.82 | 3.60 | –2.87 | –0.05 | |
| CS 29502–042 | 5100 | 2.5 | 1.5 | –3.19 | 3.25 | –3.22 | –0.03 | |
| CS 29516–024 | 4650 | 1.2 | 1.7 | –3.06 | 3.15 | –3.32 | –0.26 | |
| CS 29518–051 | 5200 | 2.6 | 1.4 | –2.69 | 3.85 | –2.62 | 0.07 | m |
| CS 30325–094 | 4950 | 2.0 | 1.5 | –3.30 | 3.25 | –3.22 | 0.08 | |
| CS 31082–001 | 4825 | 1.5 | 1.8 | –2.91 | 3.55 | –2.92 | –0.01 |
-A ”m” in the last column means that the star is ”mixed” (see Spite
et al., SCH06 (2006))
3 Determination of the aluminium abundance
3.1 Atomic model and NLTE calculations
As discussed by Gehren et al. (2004, and references therein), the lines of aluminium are subject to a strong NLTE effect in metal-poor stars because of the reduced role of the collisions, which are responsible for thermalisation, in their atmospheres (lower electron concentration) thus the populations of the aluminium atomic levels are mainly controlled by radiative processes.
For our NLTE calculations we adopted an aluminium atomic model that consists of 78 levels of Al I and 13 levels of Al II. The energy levels are from Kaufman & Martin (1991). For all the terms the fine structure was ignored, and they were treated as single levels in the calculations. However the ground level was treated as two sublevels.
Radiative and collisional transitions were considered between the first 45 Al I levels (n 12, l = 5) and the ground level of Al II. Transitions between the remaining levels were ignored, and those levels were used in the calculations only to meet the condition of the particle number conservation. Oscillator strengths and photoionisation cross-sections were taken from the TOPbase (see: http://vizier.u-strasbg.fr/topbase/topbase.html). Only for the levels with was the photoionisation treated in the hydrogen-like approximation. Altogether, 288 bound-bound transitions were considered in detail.
Electron impact ionisation was described by Seaton’s (1962) formula, while the electron impact excitation for the allowed bound-bound transitions was estimated with van Regemorter’s (1962) formula. Collisional rates for the forbidden transitions were calculated with a semi-empirical formula provided by Allen (1973), with a collisional force equal to 1. Inelastic collisions of aluminium atoms with hydrogen atoms may play a significant role in the atmospheres of cool stars. We have taken into account this effect by using Drawin’s formula with a correction factor of 0.1 (see Steenbock & Holweger 1992).
The NLTE aluminium abundance was determined with a modified version of the MULTI code (Carlsson 1986). All modifications are described in Korotin et al. (1999). This modified version includes opacity sources from ATLAS9 (Kurucz 1992); this enables one to perform an accurate determination of the continuum opacity and intensity distribution in the UV region, which is extremely important for the correct determination of the radiative rates of the bound-bound transitions in the aluminium atom. Models of stellar atmospheres were interpolated in Kurucz’s grid with .
After solving the coupled radiative transfer and statistical equilibrium equations, the averaged levels were split with respect to their multiplet structure. Then the level populations were redistributed proportionally to the statistical weights of the corresponding sublevels, and, finally, the lines of interest were studied.


In very metal-poor stars, only the UV resonance doublet of aluminium is measurable. For these lines the broadening parameters were taken from the VALD data-base (http://ams.astro.univie.ac.at/vald/). Van der Waals parameter was taken from Gehren et al. (2004). Oscillator strengths of the studied lines are from Wiese & Martin (1980).
To verify the completeness of our adopted aluminium atomic model, we have carried out the test calculations of the Al line profiles in the solar spectrum. The Solar Flux Atlas of Kurucz et al. (1984) and Kurucz’s model of the solar atmosphere (1996) were used for this purpose. To take into account the chromospheric growth of the temperature, this model was combined with a model of the solar chromosphere from Maltby et al.(1986). Not only were the profiles of the resonance aluminium doublet calculated, but we have also analysed the 6696-98 Å, 7835-36 Å, 8772-73 Ålines. The very good agreement between our calculated profiles and the observed ones, for these aluminium lines gives an independent confirmation that our adopted aluminium atomic model is correct. The solar aluminium abundance derived from these computations was for
Since the resonance lines of aluminium are situated in the vicinity of the and Ca II lines and the H5 line, the wings of these lines have to be properly computed. Therefore, using the MULTI code we first calculated the departure coefficients for each atmosphere model, and then these coefficients were used in synthetic spectrum calculations that cover the whole region occupied by Ca II and H5 lines (an updated version of the PC compatible synthetic spectrum code of Tsymbal 1996, was used).
Two examples of the line profile fitting for the turn-off and giant stars are shown in Fig. 1. This work is mainly based on the line at 3961 Å; the line at 3944 Å is often severely blended by CH lines.
The aluminium abundances , [Al/H] and [Al/Fe] are given in Table 1. For CS 29518–043 we had no blue spectra and thus the aluminium abundance could not be computed. For homogeneity, in Table 1 the solar abundance of aluminium has been taken from Grevesse and Sauval (GS00 (2000)) as in Cayrel et al. (CDS04 (2004)): . Note that this value is very close to the value we obtained for the Sun, in the same conditions as in the stars : ().
3.2 Abundance uncertainty
The typical uncertainty in the fit corresponds to 0.05 dex in abundance. But the uncertainty due to random errors on the determination of the stellar parameters must be added to this observational error. The random error in is close to 100K, the error in dex and the error in . In Table 2 is given for a typical model of a giant and a turnoff star and for K, and . If we suppose that the errors are independent and we add them quadratically, we find that the errors on [Al/Fe] due to the uncertainties of the stellar parameters are close to 0.11 for the giants and 0.07 for the dwarfs. Taking into account the observational error we find that the expected scatter is 0.12 for the giants and 0.08 for the turnoff stars.
| GIANT STAR | |||
|---|---|---|---|
| CS 22948–066 | |||
| A: =5100K, log =1.8 dex, vt=2.0 km s-1 | |||
| B: =5100K, log =1.6 dex, vt=2.0 km s-1 | |||
| C: =5100K, log =1.8 dex, vt=1.8 km s-1 | |||
| D: =5000K, log =1.8 dex, vt=2.0 km s-1 | |||
| Abundance ratio | |||
| [Fe/H] | -0.04 | 0.02 | -0.05 |
| Al I/Fe] | 0.06 | 0.05 | -0.04 |
| TURNOFF STAR | |||
| CS 22177-09 | |||
| A: =6260K, log =4.5 dex, vt=1.3 km s-1 | |||
| B: =6260K, log =4.3 dex, vt=1.3 km s-1 | |||
| C: =6260K, log =4.5 dex, vt=1.1 km s-1 | |||
| D: =6160K, log =4.5 dex, vt=1.3 km s-1 | |||
| Abundance ratio | |||
| [Fe/H] | -0.02 | 0.03 | -0.05 |
| Al I/Fe] | 0.02 | -0.03 | -0.03 |

4 Results and discussion
4.1 [Al/Fe] in the early Galaxy
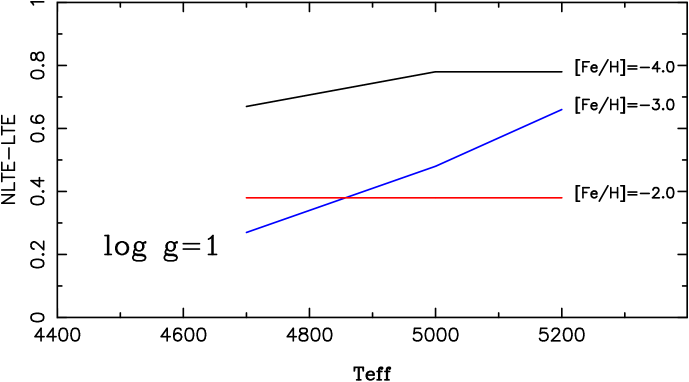
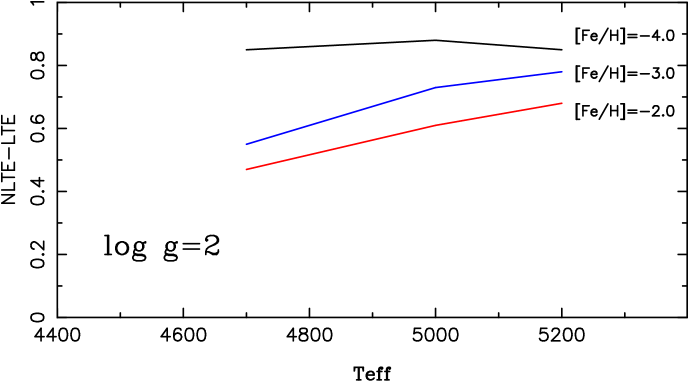
Figure 2 shows how the NLTE correction behaves with effective temperature, surface gravity and metallicity of the model. The correction depends on a balance between overionisation which depopulates the lower levels (the photoionisation cross-section of the ground state is exceptionally large) and a cascade of electrons downward (phenomenon of ”photon suction”). For aluminium, photoionisation strongly dominates and the effect increases toward higher and lower . Furthermore at low metallicity the UV radiation field is stronger and hence the effect also increases with decreasing [Fe/H] as can be seen for the giants ( and 2) in Fig. 2. For turnoff stars, according to Asplund (Asp05 (2005)), the correction reaches a maximum for mildly metal-poor stars when the line is saturated. This is also what we observe in Fig. 2 (lower panel). Note that for turnoff stars at the correction NLTE – LTE is close to 0.6 dex, in good agreement with the computations of Baumüller & Gehren (BG97 (1997)).
These corrections should not be used to determine a precise value of the NLTE abundance of aluminium in metal-poor stars. The shapes of NLTE and LTE profiles are different (in particular when the resonance lines of aluminium are strong) and a complete NLTE computation of the profiles is necessary, as was done for the values given in Table 1.
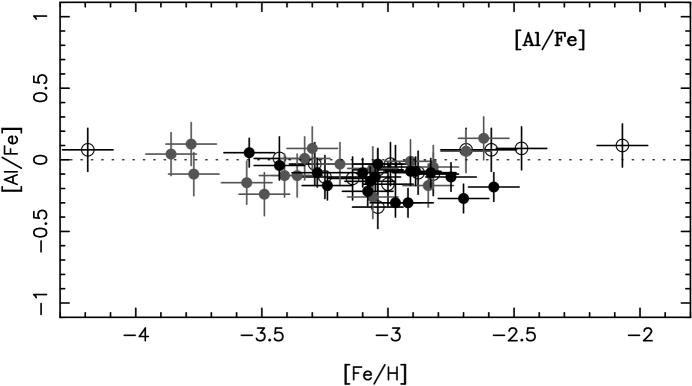
In Fig. 3 we have plotted [Al/Fe] vs. [Fe/H] for our samples of extremely metal-poor turnoff and giant stars. There is a good agreement between the abundances of aluminium in these two different classes of stars. Moreover the significant difference between mixed and unmixed giants (see Fig. 8 in Spite et al., SCH06 (2006)) suggested by LTE determinations, is no longer observed.
In Andrievsky et al. (ASK07 (2007)) it has been found that several mixed giants of our sample were sodium-rich, suggesting that in these stars, mixing is deep enough to bring to the surface the products of the Ne-Na cycle. Moreover it had been found (from LTE computations) that all these Na-rich stars (but ) seemed to be also Al-rich. This peculiarity disappears with an NLTE analysis of the aluminium lines. In the Na-rich mixed giants, mixing brings to the surface the products of the Ne-Na cycle but, as expected, not the products of the Mg-Al cycle formed at higher temperature.
At very low metallicity () in Fig. 3, the relation [Al/Fe] versus [Fe/H] is rather flat, the global mean is (random error). The scatter is very close to the expected scatter when observational errors and uncertainties on stellar parameters are taken into account (see paragraph 3.2).
Iron is generally used as a reference element in high resolution spectral analysis because it has the largest number of usable lines and thus the highest internal precision. However the abundance ratio [Al/Fe] in the ejecta of type II supernovae is very sensitive to the mass cut. Oxygen would be a better choice than iron, but in giants the uncertainties on its abundance are large, and the oxygen abundance could not be measured in the sample of dwarfs. Magnesium may be a good alternative (see Cayrel et al., CDS04 (2004), Gehren et al., GLS04 (2004), GSZ06 (2006)) since Mg and Al are both synthesised during the advanced stages of the evolution of massive stars and since the ratio [Al/Mg] is practically independent of the mass-cut. Surprisingly, when we plot [Al/Mg] as a function of [Fe/H] (or [Mg/H]) the scatter at low metallicity is larger than the scatter of [Al/Fe]: for (random error).
Generally speaking for these EMP stars the scatter of [X/Mg] is, for all the elements, larger than the scatter of [X/Fe] (Cayrel et al., CDS04 (2004)). This increase of the scatter cannot be explained by measurement errors on the magnesium abundance alone. Following Gehren et al. (GSZ06 (2006)), NLTE significantly affects the determination of the magnesium abundance, the maximum of the correction is about 0.15dex but it could be larger in giants. This will be investigated in a subsequent paper.
4.2 [Al/Fe] and the models of the chemical evolution of the Galaxy
The scatter (0.12 dex around the mean value) of the NLTE values of [Al/Fe] is smaller than the scatter of the LTE determinations and can be explained by measurement errors only. As a consequence, the value of the yields of aluminium in massive supernovae, deduced by Tsujimoto et al. (TSY99 (1999)) from the ”large scatter” of [Al/Fe] at low metallicity, can be questioned.
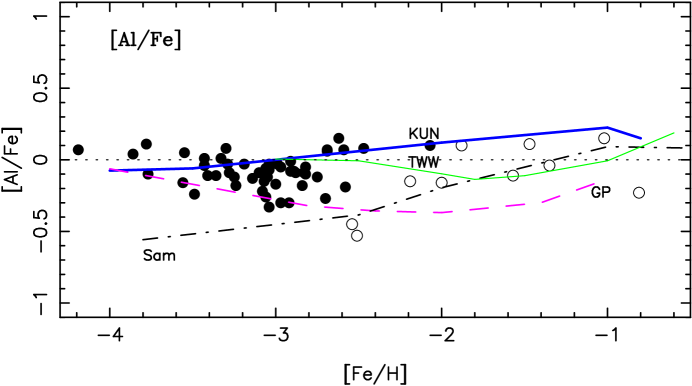
In Fig. 4 we compare our measurements of [Al/Fe] in EMP stars to the measurements of Gehren et al. (GSZ06 (2006)) in a sample of nearby halo dwarfs. These measurements extend our sample to higher metallicities. There is a rather good agreement between the two sets of measurements: the mean [Al/Fe] value deduced from the halo stars of the sample of Gehren et al. is (vs. [Al/Fe] = –0.08, section 4.1).
However the two most metal-poor stars of the sample of Gehren et al. (GSZ06 (2006)) seem to be aluminium-poor relative to our sample. These two stars are among the faintest objects observed by Gehren et al. and thus (see their section 2) the S/N of the spectra is probably as low as 100 near and even lower in the region of the aluminium lines. As a consequence for these stars the abundance error should be higher than the average abundance error quoted by Gehren et al.: 0.10 dex. One of these stars (G 48-29 = HE 0938-0114) has been also observed by Barklem et al. (BCB05 (2005)) with UVES at the VLT. The S/N of their spectrum is higher than 300 and they found an LTE ratio of [Al/Fe] = –0.78. If we apply to this value a NLTE-LTE correction deduced from the computations of Gehren et al. (2006, their Table 2), we find [Al/Fe] = –0.17, in good agreement with our measurements at this metallicity.
It is interesting to compare the evolution of [Al/Fe] in the Galactic halo with the predictions of the different models of the Galactic evolution based on the element yields of massive stars (Fig. 4). In the region the predictions of Samland (1998) and of Goswami & Prantzos (2000) for the ratio [Al/Fe] are too low compared to the observations. A better agreement is obtained when the measurements are compared to the predictions of Timmes et al. (1995) or Kobayashi et al. (2006). Timmes et al. (1995) calculated the evolution of the aluminium-to-iron ratio down to [Fe/H]=–3 based on the SNe II metallicity-dependent yields of Woosley & Weaver (1995). The best agreement is found by assuming that the iron production by SNe II should be decreased by a factor of 2 or slightly less (see Fig. 19 in Timmes et al.) as is generally found (see also Andrievsky et al., 2007). Our data are in fair agreement with the [Al/Fe] ratios predicted by the Galactic chemical evolution model of Kobayashi et al. (2006). The yields used by these authors are calculated for very low metallicity and the explosion energies of the supernovae/hypernovae are based on the fitting of the light curve and the spectra of individual supernovae/hypernovae.
Recently Tominaga et al. (TUN07 (2007)) have computed the predictions of inhomogeneous models of the Galactic enrichment. In these models the observed trends of [X/Fe] vs. [Fe/H] are not due to metallicity effects but to the combination of the progenitor (hypernovae, supernovae) masses and explosion energies. For most of the elements the predicted slope is weak and compatible with the observations but a strong slope of the ratios [Na/Fe] and [Al/Fe] vs. [Fe/H] is expected since the hypernovae with high explosion energies, that are supposed to explode at the very beginning of the Galaxy, eject much less sodium and aluminium than the regular supernovae that explode a little later. Our observations show no significant slope of [Na/Fe] (Andrievsky et al. ASK07 (2007)) nor of [Al/Fe]. However these observations can be reconciled with the computations of Tominaga et al. if we suppose that in the interval the galactic gas was efficiently mixed. They predict that in the ejecta of their ”mean” supernova/hypernova (integrated over the IMF) [Na/Fe] [Al/Fe] –0.3. These values correspond rather well to the observed values: (Andrievsky et al., ASK07 (2007)) and .
5 Conclusion
The NLTE abundances of Al computed in this work for very metal-poor stars provide more reliable values of the ratio Al/Fe and a more reliable trend of this ratio versus metallicity. The scatter is significantly reduced compared to what it was for the LTE determinations (see Fig. 8 of Cayrel et al. 2004 for the giants); the mean value of the Al/Fe ratio at the lowest metallicity is solar: , the error quoted here is the value of the scatter around the mean regression line. This small scatter can be explained entirely by the measurement error and the random error on the stellar parameters.
The Al abundance is the same in extremely metal poor TO stars, ”mixed” and ”unmixed” giants. Moreover, some ”mixed” giants that were found to be Na-rich in Andrievsky et al. (2007) were then suspected to be also Al-rich. In fact this apparent enrichment of aluminium in these Na-rich giants is entirely explained by NLTE effects. After a correct treatment of the aluminium lines, the Na-rich giants have a normal [Al/Fe] ratio.
The trend, now clearly defined, has a very small slope: owing to
possible systematic errors, it could well be zero. In the region the behaviour of [Al/Fe] may thus be easily compared
with the predictions of the models of chemical evolution, favouring:
–the predictions of Timmes et al. (TWW95 (1995)), (but their
predictions end at ), or
–the predictions of Kobayashi et al. (KUN06 (2006)).
Our observations can be reconciled with the predictions of Tominaga et al. (TUN07 (2007)) if we assume an efficient mixing of the ejecta of the hypernovae - supernovae in the early Galaxy for metallicities above .
The NLTE Na computations in extremely metal-poor stars provide, for the unmixed and not Na-enriched stars, a well defined mean value of (Andrievsky et al., 2007). Now the NLTE Al abundances provide reliable Al/Na ratios: [Al/Na] = 0.15 dex. This value is slightly higher than solar, but owing to the error bars, it could be solar.
Spite et al. (SCP05 (2005)), commenting on the wide scatter in nitrogen abundances found among EMP stars, noted that rotating massive stars could possibly influence the abundances of the first stars. These rotating stars (Meynet et al. 2005, 2006) produce powerful winds that may be slightly rich in Na and Al. The ratio of the mass fractions of Al and Na in such winds, computed by Decressin et al. (DMC07 (2007)), appears to be quite different for different models and phases. Thus the observed value of the Al/Na ratio, although compatible with the production of such winds, does not imply that this production amounts to a significant contribution to the abundances of EMP stars. On the other hand, the Al/Na ratio is incompatible with the predictions of Meynet et al. (2005, 2006) for the yields of rotating E-AGB stars that can explain the abundances in the carbon-rich extremely metal-poor stars, leaving a question mark about the associated primary production of nitrogen.
In spite of significant progress, this work suggests that the quest for even more reliable constraints on the yields of the first supernovae would require the interpretation of the measurements by sophisticated models including not only the NLTE corrections, but also computation of the diffusion of metals inside the atmosphere, use of (time consuming) 3D models, as well as better physical constants (collisions, oscillator strengths, molecular constants…).
Acknowledgements.
This work has been supported by the ”Programme National de Physique Stellaire” (CNRS). S.A. kindly acknowledges the Paris-Meudon Observatory for its financial support during his stay in Meudon and the laboratory GEPI for its hospitality.References
- (1) Allen C.W., 1973, Astrophysical Quantities, Athlone Press, London
- (2) Alonso A., Arribas S., Martínez-Roger C., 1996, A&A 313, 873
- (3) Alonso A., Arribas S., Martínez-Roger C., 1999, A&AS 140, 261
- (4) Alonso A., Arribas S., Martínez-Roger C., 2001, A&AS 376, 1039
- (5) Andrievsky S., Spite M., Korotin S. et al., 2007, A&A 464, 1081
- (6) Argast D., Samland M., Gerhard O.E., Thielemann F.K., 2000, A&A 356, 873
- (7) Arnett W.D., 1971, ApJ 166, 153
- (8) Arnett W.D., 1996, Supernovae and Nucleosynthesis (Princeton, New Jersey: Princeton University Press)
- (9) Asplund M., 2005, Ann. Rev. Astro. Astrophys. 43, 481
- (10) Asplund M., Grevesse N., Sauval J., 2005, in Cosmic Abundances as Records of Stellar Evolution and Nucleosynthesis , eds. T.G. Barnes III, F.N. Bash, ASP Conf. Ser. 336, 25 (ArXiv0410-214)
- (11) Barklem P.S., Christlieb N., Beers T.C. et al., 2005, A&A 439, 129
- (12) Baumüller D., Gehren T., 1997, A&A 325, 1088
- (13) Bonifacio P., Molaro P., Sivarani T. et al., 2007, A&A 462, 851
- (14) Carlsson M., 1986, Uppsala Obs. Rep. 33
- (15) Cayrel R., Depagne E., Spite M. et al., 2004, A&A 416, 1117
- (16) Decressin T., Meynet G., Charbonnel C. et al. 2007, A&A 464, 1029
- (17) Gehren T., Liang Y.C., Shi J.R.et al., 2004, A&A 413, 1045
- (18) Gehren T., Shi J.R., Zhang H.W. et al., 2006, A&A 451, 1065
- (19) Goswami A., Prantzos N., 2000, A&A 359, 191
- (20) Grevesse N., Sauval A.J., 2000, ”Origin of the elements in the solar system. Implications of post-1957 Observations”, ed. O. Manuel, Kluwer Academic/Plenum Publishers, p.261
- (21) Herwig F., 2005, ARAA 43, 435
- (22) Kaufman V., Martin W.C., 1991, J. Phys. Chem. Ref. Data 20, 775
- (23) Kobayashi Ch., Umeda H., Nomoto K. et al., 2006, ApJ 653, 1145
- (24) Korotin S.A., Andrievsky S.M., Luck R.E., 1999, A&A 351, 168
- (25) Kurucz R.L., 1992, The Stellar Populations of Galaxies, IAU Symp. 149, eds. B. Barbuy, A., Renzini, 225
- (26) Kurucz R.L., 1996, Model Atmospheres and Spectrum Synthesis, ASP Conf. Ser. 108, eds. S.J. Adelman, F. Kupka, W.W. Weiss, San Francisco
- (27) Kurucz R.L., Furenlid I., Brault J., Testerman L., 1984, Solar Flux atlas from 296 to 1300 nm
- (28) Maltby P., Avrett E.H., Carlsson M. et al., 1986, ApJ 306, 284
- (29) Meynet G., Ekström S., Maeder A., 2005, IAU Symp 228, eds V. Hill, P. François, F. Primas, Cambridge University Press, p.141
- (30) Meynet G., Ekström S., Maeder A., 2006, A&A, 447, 623
- (31) Norris J.E., Ryan S.G., Beers T.C., 2001, ApJ 561, 1034
- (32) Ramírez I., Meléndez J., 2005, ApJ 626, 465
- (33) Samland M., 1998, ApJ 496, 155
- (34) Seaton M.J., 1962, Proc. Phys. Soc. 79, 1105
- (35) Spite M., Cayrel R., Plez B. et al., 2005, A&A 430, 655
- (36) Spite M., Cayrel R., Hill V. et al., 2006, A&A 455, 291
- (37) Steenbock W., Holweger H., 1992, The Atmospheres of Early-Type Stars, Proc. Workshop, Univ. Kiel 1991. Lecture Notes in Physics 401, eds. U. Heber and C. S. Jeffery, Springer, 57
- (38) Timmes F.X., Woosley S.E., Weaver T.A., 1995, ApJS 98, 617
- (39) Tominaga N., Umeda H., Nomoto K., 2007, ApJ 660, 516
- (40) Tsujimoto T., Shigeyama T., Yoshii Y., 1999, ApJ 519, L64
- (41) Tsujimoto T., Shigeyama T., Yoshii Y., 2002, ApJ 565, 1011
- (42) Tsymbal V.V., 1996, Model Atmospheres and Spectrum Synthesis, ASP Conf. Ser. 108, eds. S.J. Adelman, F. Kupka, W.W. Weiss, San Francisco
- (43) Van Regemorter H., 1962, ApJ 136, 906
- (44) Wiese W.L., Martin G.A., 1980, NSRDS-NBS 68 (Part III)
- (45) Woosley S.E., Weaver T.A., 1995, ApJS 101, 181
- (46) Zhang H.W., Zhao G., 2006, A&A 449, 127