Present address: ]Dipartimento di Fisica “A. Volta,” ed Unità CNISM, Università di Pavia, I-27100, Pavia, Italy
7Li NMR Study of Heavy Fermion LiV2O4 Containing Magnetic Defects
Abstract
We present a systematic study of the variations of the 7Li NMR properties versus magnetic defect concentration within the spinel structure of polycrystalline powder samples (, and 0.83 mol%) and a collection of small single crystals ( mol%) of LiV2O4 in the temperature range from 0.5 to 4.2 K. We also report static magnetization measurements and ac magnetic susceptibility measurements at 14 MHz on the samples at low temperatures. Both the 7Li NMR spectrum and nuclear spin-lattice relaxation rate are inhomogeneous in the presence of the magnetic defects. The 7Li NMR data for the powders are well explained by assuming that (i) there is a random distribution of magnetic point defects, (ii) the same heavy Fermi liquid is present in the samples containing the magnetic defects as in magnetically pure LiV2O4, and (iii) the influences of the magnetic defects and of the Fermi liquid on the magnetization and NMR properties are separable. In the single crystals, somewhat different behaviors are observed, possibly due to a modification of the heavy Fermi liquid, to a lack of separability of the relaxation effects due to the Fermi liquid and the magnetic defects, to non-Fermi liquid behavior of the conduction electrons, and/or to quantum fluctuations of finite-size magnetic defects (magnetic droplets). Remarkably, the magnetic defects in the powder samples show evidence of spin freezing below K, whereas in the single crystals with similar magnetic defect concentration no spin freezing was found down to K. Thus different types of magnetic defects and/or interactions between them appear to arise in the powders versus the crystals, possibly due to the substantially different synthesis conditions of the powders and crystals.
pacs:
76.60.Es, 75.30.Mb, 75.50.Lk, 81.40.RsI Introduction
LiV2O4 is a rare -electron heavy fermion system at low temperatures K.Kondo1997 The low temperature linear electronic specific heat coefficient (0.42 J/mol K2) and Pauli magnetic susceptibility ( cm3/mol) are 180 and 310 times those of a free electron gas, respectively, assuming each vanadium atom contributes 1.5 free electrons. The Wilson ratio , which is the ratio of the enhancement factors of and , is equal to 1.7, typical for a heavy fermion system.Stewart1984 Heavy fermion behavior was further confirmed by electrical resistivity measurements which show a dependence below 2 K with a large coefficient cm/K2.Takagi1999 ; Urano2000 The and values approximately follow the Kadowaki-Woods relation, cm(mol K/J)2, which holds for a variety of heavy fermion systems.Kadowaki1986 Despite continuous theoretical work, a detailed explanation of the heavy fermion behaviors in LiV2O4 remains a challenge.Fulde2004 ; Arita2007 ; Yushankhai2007
7Li nuclear magnetic resonance (NMR) was an important local probe in establishing the low temperature heavy fermion behavior in magnetically pure samples of LiV2O4.Kondo1997 ; Mahajan1998 The low temperature 7Li nuclear spin-lattice relaxation rate follows a Korringa relation , with a coefficient s-1K-1, which is 6000 times larger than in the non-heavy fermion isostructural superconductingJohnston1976 compound LiTi2O4.Dalton1994 The Korringa ratio , where is the Knight shift, and are the gyromagnetic ratios of the 7Li nuclear spin and the conduction electron spin, respectively, is equal to 0.7, which is close to the value of unity expected for a free electron gas.
Recently, we found that the low temperature 7Li NMR properties of polycrystalline LiV2O4 are very sensitive to the presence of a small concentration of magnetic defects ( mol%) within the spinel structure.Johnston2005 ; Kaps2001 In a sample containing a negligible concentration of magnetic defects, the longitudinal component of the global bulk 7Li nuclear magnetization after time delay following a sequence of saturation pulses showed a single exponential recovery , where was proportional to as noted above. However, in the sample with mol%, the showed a stretched exponential recovery , with the characteristic relaxation rate showing a peak at K. Here is the stretching exponent with, in general, . There was also a clear difference in the 7Li NMR spectrum in these two samples. At low temperatures K, the magnetically pure sample had a narrow spectrum with an almost temperature independent width (full width at half maximum peak intensity FWHM kHz). In contrast, a strong temperature dependent inhomogeneous broadening (FWHM kHz at K) was observed in the sample with mol%.
In order to further clarify the nature of the magnetic defects and their effect on the heavy fermion properties of LiV2O4, we report herein 7Li NMR studies on LiV2O4 versus magnetic defect concentration. Three polycrystalline samples and a collection of single crystals are studied. The powder samples are labeled as 6b, 7a, and 6a, with mol%, 0.49 mol%, and 0.83 mol%, respectively. The single crystal sample is labeled as sample 1 with mol%. We determined the magnetic defect concentrations from static magnetization measurements in the temperature range 1.8–5 K and applied magnetic field range 0–5.5 T.Kondo1999 Furthermore, to study the possible spin freezing of the magnetic defects at low temperatures, we measured the ac magnetic susceptibility at 14 MHz from 0.5 to 6 K of the single crystals and of the powder sample 6a with mol% using the tunnel-diode resonator technique.Vannette2007
The temperature dependences of the 7Li nuclear spin-lattice relaxation rates in our polycrystalline samples are similar to that of sample 3-3-a2 ( mol%) that we studied in Ref. Johnston2005, , which showed a peak in at about 1 K. However, we find a qualitative difference in the temperature dependence of in the collection of single crystals, which instead decreases monotonically with decreasing temperature from 4.2 K down to 0.5 K. We include two important aspects into the analysis of the NMR data. First, we consider the effect of a distribution of local fields due to different positions of the 7Li nuclei relative to their nearby magnetic defects. For the polycrystalline samples, this approach is quantitatively consistent with the inhomogeneous broadening of the spectrum and the nonexponential relaxation behavior. In the single crystals, this purely geometric origin for the nuclear relaxation fails to explain the observed behavior at K. We then extend our analysis to take into account a possible size distribution of postulated magnetic defects of finite size (magnetic droplets). We speculate that the differences between the natures and interactions of the magnetic defects/droplets in the powders versus the crystals arise from the very different synthesis conditions and procedures of the powders and crystals.
The paper is organized as follows. Experimental details are given in Sec. II. In Sec. III, we report the experimental results of the magnetization, ac susceptibility, 7Li NMR spectra, and 7Li nuclear spin-lattice relaxation rate measurements. In Sec. IV, we analyze the NMR results. In Sec. V, we summarize the main conclusions of the paper.
II Experimental Details
Polycrystalline LiV2O4 samples were prepared using conventional solid state reaction at temperatures up to 700 ∘C. The starting materials were V2O3 (99.99%, MV Labs), V2O5 (99.99%, MV Labs), and Li2CO3 (99.999%, Alfa Aeser). Details of the sample synthesis procedure can be found in Ref. Kondo1999, . The typical size of the polycrystalline grains is in the range of 1–10 m,Das2006 as determined from scanning electron microscope (SEM) micrographs. Single crystals were grown at 950–1040 ∘C using a self-flux technique.Das2007 The flux consisted of a mixture of Li3VO4 and LiV2O4. The typical size of the crystals used in the present work is 0.2 mm. Static magnetization measurements were performed using a Quantum Design SQUID magnetometer in the temperature range 1.8–350 K and applied magnetic field range 0–5.5 T.
The ac magnetic susceptibility was measured using a highly sensitive self-resonating circuit where losses are compensated by a tunnel diode that has a region of negative differential resistance in its - characteristic. The resonant frequency of an empty coil changes when a sample is placed in the coil. The shift of the resonant frequency, is directly related to the dimensionless volume ac susceptibility of the sample viaVannette2007
| (1) |
where is the sample volume and is the coil volume. The volume magnetization is the magnetic moment per unit volume of the sample, with Gaussian units G cm. The volume susceptibility is the volume magnetization divided by field, which is then dimensionless. The optimized and thermally stabilized circuit resonates at 14 MHz with a stability of over hours.Vannette2007 The resonator was mounted in a 3He cryostat with a temperature range 0.5–150 K. A static external field up to 90 kOe can be applied to study field-dependent properties.
7Li NMR measurements were performed utilizing a phase-coherent pulse spectrometer at applied magnetic fields , 1.68 and 3.0 T and in the temperature range 0.5–4.2 K. Measurements above 1.5 K were performed with a 4He bath cryostat and measurements below 1.5 K with a Janis 3He cryostat. The typical pulse length was . The 7Li NMR spectra for narrow lines (FWHM kHz) were measured by Fourier transform of half the Hahn echo signals, while for wider lines, the spectra were measured by integrating the echo area as a function of the applied magnetic field at a fixed frequency of rf pulses. Nuclear spin-lattice relaxation rates were measured by monitoring the recovery of the spin echo height using the standard saturation-recovery pulse sequence.
III Results
III.1 Magnetic Defect Concentrations

The magnetic defect concentrations of the samples were determined from the low temperature ( K) magnetization versus applied magnetic field isotherms.Kondo1999 Figures 1(a), 1(b), 1(c), and 1(d) show the isotherms at different temperatures for samples 6b, 1, 7a, and 6a, respectively. The magnetic defect concentration and spin value of the magnetic defects in each sample are determined by fitting the equation
| (2) | |||||
to all the isotherm data for each sample at K.Kondo1999 In Eq. (2), is the magnetic defect concentration in dimensionless mole fraction units, is a field- and temperature-independent contribution to the molar susceptibility at low temperatures K, is Avogadro’s number, is the (powder-averaged) spectroscopic splitting factor (-factor) for the defect spins, is the Brillouin function for spin , and where is Boltzmann’s constant. We have replaced in the usual Brillouin function by in order to take into account weak interactions between the magnetic defects. , , , and are free parameters in the fit, whereas the value is fixed to be equal to 2 during the fit.Kondo1999 The best fit parameters are listed in Table 1. Figure 1(e) shows the magnetic defect magnetization contributions versus for the four samples. All the data points in Figs. 1(a), 1(b), 1(c), and 1(d) fall onto a universal curve in Fig. 1(e) for each sample, respectively, as described by the second term in Eq. (2), thus confirming the consistency of the fits. The fitted functions in Eq. (2) for the four samples are plotted versus as the solid curves in Fig. 1(e) and show excellent agreement with the data.
| Sample | (mol%) | (cm3/mol) | (K) | |
|---|---|---|---|---|
| 6b | 0.21(1) | 3.6(2) | 0.0104(1) | (14) |
| 7a | 0.49(1) | 3.5(1) | 0.0108(1) | (6) |
| 6a | 0.83(3) | 3.9(1) | 0.0122(2) | (10) |
| 1 | 0.38(1) | 3.3(1) | 0.01186(4) | (6) |
Several features of the data in Table 1 are important. The low-temperature field-independent (up to 5.5 T) susceptibilities of all four samples are the same to within about 10%, even though the magnetic defect concentrations change by a factor of 4, and are about the same as in magnetically pure LiV2O4.Kondo1997 ; Kondo1999 This agreement suggests that the heavy Fermi liquid in magnetically pure LiV2O4 survives in the presence of the magnetic defects. Second, the spins of the magnetic defects should be considered as average values, and these values are large, ranging from 3.3 to 3.9. That the magnetic defects have large spins is obvious from the data in Fig. 1(e) because the magnetic defect magnetizations are nearly saturated at relatively low fields of only T; spins 1/2 would not saturate even at our maximum field of 5.5 T. It is difficult to understand how such large spin values could arise from point defects in the crystal structure. In that case one might expect the magnetic defect spins to be much smaller and similar to those of V+4 () or V+3 (). The large spins of the magnetic defects thus suggest that these spins may be associated with extended objects that we call “magnetic droplets” in Sec. IV.3 below instead of being associated with point-like local magnetic moments as in the usual picture. Third, the Weiss temperatures for all the samples are rather small, and indicate that the average interaction energy between the magnetic defects is also small and of order 1 K. Finally, from low-temperature magnetization measurements on many polycrystalline and single crystal samples that we have carried out in addition to those described here, the magnetic defect concentrations found do not exceed the largest value listed in Table 1 of 0.83 mol%.
III.2 ac Magnetic Susceptibility at 14 MHz
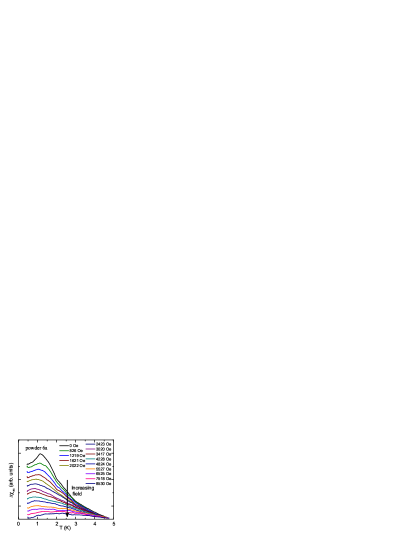
The ac magnetic susceptibility, , is an important parameter directly related to the electronic spin dynamics. It is very sensitive to collective behavior such as spin freezing and a transition to the glassy state. Figure 2 shows versus temperature at various values of the external magnetic field for powder sample 6a with mol%. Each curve corresponds to a magnetic field listed in the legend and the curves from top to bottom correspond to increasing magnetic field. We note that the change of the magnetic moment amplitude of the measured sample on decreasing the temperature from 1.1 K to 0.5 K in zero field corresponds to a change in magnetic moment of only about G cm3, which cannot be resolved by a conventional SQUID magnetometer for the same size ( mm3) sample.
At zero static applied field, there is an obvious peak in at about K in Fig. 2 that is most likely indicative of a collective freezing of the magnetic moments. The field dependence of the magnetic susceptibility is characteristic of a spin glass system where spin randomness is suppressed by the uniaxial field and the peak in associated with spin freezing is suppressed because the magnetic moments are closer to saturation. This result suggests collective freezing behavior of the magnetic defects in the LiV2O4 powder sample in zero field.
For our sample 1 consisting of a collection of single crystals with overall mol%, the situation is quite different. We cannot measure the spin susceptibility because the diamagnetic orbital susceptibility arising from skin depth effects dominates it. The skin depth can be calculated from Corson
| (3) |
where is relative permeability, is the conductivity in m-1, and is the applied frequency in Hz. Setting , m-1( value at 1.8 K in Ref. Das2007, ), and MHz, we obtain mm, significantly smaller than the size of a crystal in sample 1. Thus we expect that the contribution to is significant and its effect increases with decreasing temperature as the resistivity decreases monotonically with decreasing temperature.Takagi1999 ; Urano2000 Figure 3 shows the versus temperature from 0.5 to 6 K. Since the static susceptibility of various samples is nearly -independent or increases with decreasing over this range, the decrease in with decreasing in Fig. 3 indicates that dominates the response there. Furthermore, we see no evidence for a collective spin freezing for this sample, and we did not find any field dependence up to an applied field of 10 kOe (not shown). Thus, the measurement of the ac susceptibility at 14 MHz for our single crystals does not yield useful information for understanding the magnetic response of the magnetic defects in these crystals. measurements at much lower frequencies are called for.

III.3 7Li NMR Line Width

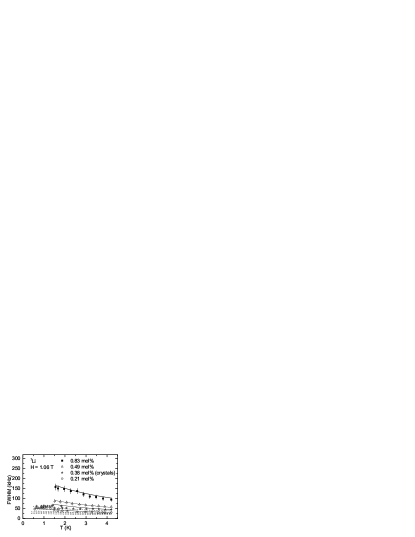
The 7Li NMR absorption line width is related to the local static magnetic field distribution. It becomes broader with increasing concentrations of magnetic defects. Figure 4 shows the absorption lines of the four samples at temperature K and T. Although the 7Li nuclei have spin , both first and second order nuclear quadrupole broadening due to a structural distortion can be ruled out since we observe no satellite peaks or shortening of pulse length as compared to the magnetically pure LiV2O4 sample.Fukushima ; Abragam The line width is significantly larger than the intrinsic width for an individual 7Li nuclear spin, indicating an inhomogeneous magnetic broadening of the line. The intrinsic line width is of the order of kHz, where is the nuclear spin-spin relaxation time and is almost independent of the defect concentration and temperature below 4.2 K. Figure 5 displays the temperature dependences of the full width at half maximum peak intensity (FWHM) of the spectra for the four samples.
The broadening of the 7Li NMR line has three contributions. The first contribution comes from the nuclear 7Li-51V and 7Li-7Li dipolar interactions. This contribution can be estimated using the Van Vleck second moment .Vleck1948 A second broadening comes from the macroscopic field inhomogeneity due to a distribution of the demagnetization factors and a distribution of magnetic fields due to neighboring powder grains. This contribution is proportional to the magnetization of the sample and the resulting root mean square deviation of 7Li NMR resonance frequencies can be written as , where is the molar susceptibility, is the density of LiV2O4 formula units in the sample, the gyromagnetic ratio of 7Li nuclei, and a dimensionless factor. is estimated to be 1.43 for a close packed powder sample with ellipsoidal shapes.Drain1962 A third broadening contribution comes from inhomogeneity due to the presence of magnetic defects within the sample. An estimate for this contribution is not possible without a model of the nature of the defects and the types of interactions between the defects and nearby 7Li nuclear spins. However, the presence of this contribution can be inferred by comparing the experimental FWHM values and the values expected when including only the first two contributions, as follows.
The FWHM resulting from the first two contributions can be calculated within a Gaussian approximation by
| (4) |
with , and kHz.Onoda1997 is calculated from Eq. (2) using the parameter values listed in Table 1. The FWHMa calculated from Eq. (4) is plotted as the dashed lines in Fig. 5. It is clear that Eq. (4) cannot account for the observed broadening of the lines, so a local magnetic field inhomogeneity due to the presence of the magnetic defects must be present in the samples. We will return to this issue in Sec. IV.2.1.
III.4 Nuclear Spin-Lattice Relaxation Rates
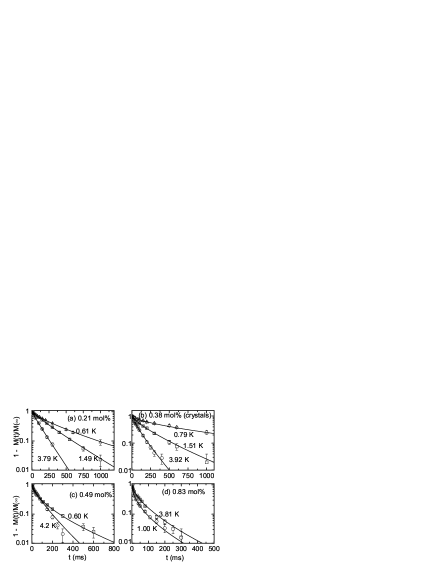
The longitudinal 7Li nuclear spin relaxation versus time exhibits an increasingly nonexponential behavior with increasing concentration of magnetic defects or decreasing temperature. Figure 6 shows the recoveries of following a saturation sequence for the four samples at different temperatures. The recovery data can be described by a stretched exponential function
| (5) |
The solid curves in Fig. 6 are best fits to the data by Eq. (5). The best fit values of and are shown in Figs. 7 and 8 for powder and single crystal samples, respectively.
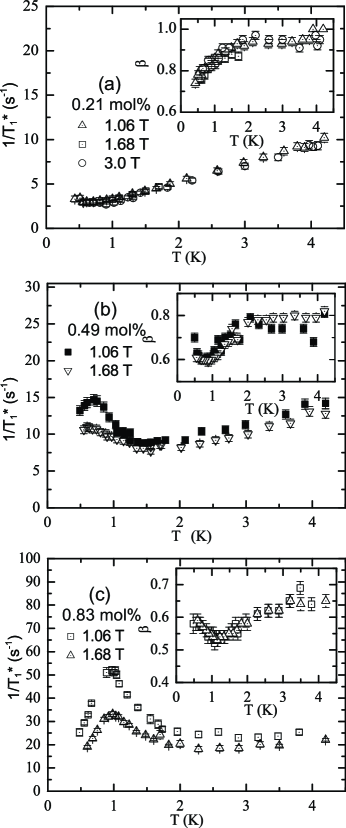

The temperature dependence of is quite different in the powder and single crystal samples. A peak is observed in for the powder samples 6a ( mol%, K) and 7a ( mol%, –0.7 K). In the powder sample 6b with the smallest magnetic defect concentration ( mol%), starts to increase at the lowest experimental temperatures and might exhibit a peak with further decreasing temperature. The peak positions in sample 6a for and 1.68 T are almost the same as the peak position in for this sample at in Fig. 2. We conclude that the peaks in originate from the spin freezing of the magnetic defects. In the crystal sample, in Fig. 8 decreases monotonically with decreasing temperature with a value at 0.5 K much smaller than in the powder samples, and there is no sign of spin freezing.
Before ending this subsection, we comment about the effect of inhomogeneous broadening on the relaxation measurements. Because of the increasing inhomogeneous broadening with decreasing temperature, some of the 7Li nuclei may be shifted out of the NMR spectrometer response window ( kHz) and excluded from the relaxation measurements. The number of observed 7Li nuclei can be estimated from the product of fully recovered echo height and the temperature, which is proportional to the nuclear Curie constant in the Curie law for . These data are shown for T versus temperature in Fig. 9. For powder samples 6b ( mol%) and 7a ( mol%), the decrease of is less than 10% when the temperature decreases from 4.2 K to the lowest temperature ( K). In contrast, for sample 6a ( mol%), starts to decrease below K and at the lowest temperature ( K), is about 50% of that at 4.2 K. As we will show below, the nuclei at the wings of the spectrum have an average relaxation rate larger than those at the center of the spectrum. Exclusion of those nuclei in sample 6a can thus result in a smaller measured relaxation rate in that sample.
In the single crystals, the normalized signal intensity also decreases with decreasing temperature. Since the line width in the crystals is less than in powder sample 7a (see Fig. 5), where no significant signal loss is observed, we attribute the signal loss to the effect of rf field skin depth. Here, only the 7Li nuclear spins within the skin depth contribute to the NMR signal. Setting , m-1 (the value of at 1.8 K in Ref. Das2007, ), and MHz, Eq. (3) gives mm, which is less than the typical size (0.2 mm) of the crystals. However, there is an unexplained kink in the data for the crystals at K in both Figs. 8 and 9.

III.5 Relaxation at Different Positions in the Spectra
The observation of a stretched exponential relaxation behavior indicates the presence of a distribution of nuclear spin-lattice relaxation rates . In order to study the origin of the distribution, we performed the following “hole burning” experiment. This experiment extends our previous hole burning experiment briefly described in Ref. Johnston2005, . We also studied the relaxation behavior at different positions of the NMR absorption line.
Figures 10(a) and (b) display the recovery of a “hole” in the echo spectrum in applied magnetic field T, obtained from Fourier transform of half the Hahn echo signal generated by two strong rf pulses following a weak pulse in samples 6a ( mol%) and 6b ( mol%), respectively. The weak pulse has a width of 56 and most of its power is distributed within a narrow frequency window of width kHz. Such a weak pulse only saturates the central part of the spectrum. It is clear that the hole recovery process does not affect the rest of the line and thus spectral diffusion does not occur in our time scale. That is, nuclei with different Larmor frequencies are not coupled to each other over the NMR relaxation time scale of ms.

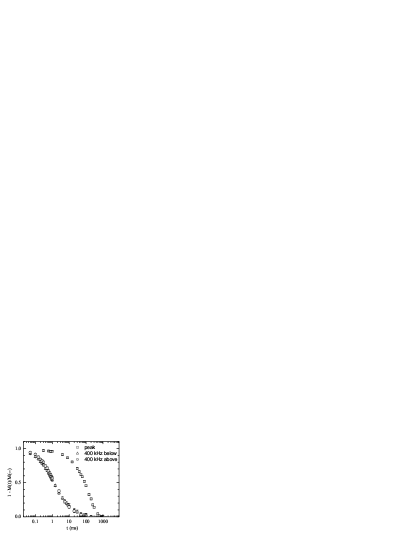
Lack of spectral diffusion as observed above allows us to investigate the nuclear spin-lattice relaxation at different positions of the spectrum. Due to the strong 7Li NMR signal at low temperatures, we were able to study the relaxation of 7Li far out on the wings of the spectrum although the signal intensity is much weaker than at the peak. Figure 11 displays the nuclear spin-lattice relaxation curves of powder sample 7a ( mol%) in T with the rf pulse frequency equal to, 400 kHz higher than, or 400 kHz lower than, the peak frequency of the line. All three recovery curves are nonexponential. It is clear from Fig. 11 that the nuclei close to the peak of the line have an average relaxation rate lower than those away from the peak. As will be discussed below, the behavior in Fig. 11 is consistent with an inhomogeneous local magnetic field induced by the magnetic defects. It is noted that the temperatures at which the three relaxation curves were taken are slightly different. However, such small temperature differences should be negligible compared to the large difference of relaxation rates between these three curves.
IV Analysis
IV.1 Introduction
A model for the microscopic nature of the magnetic defects has to be assumed in order to analyze the NMR results. We will examine two related possibilities. First, in Sec. IV.2 we treat the magnetic defects as traditional identical localized magnetic moments. The distribution of 7Li nuclear spin-lattice relaxation rates and the inhomogeneous broadening of the 7Li absorption spectrum are then entirely caused by the local field inhomogeneity, which arises from a distribution of positions of the 7Li nuclei relative to the magnetic defects. In a refined version of this model in Sec. IV.3, the magnetic defects are assumed to actually be “magnetic droplets” that have a distribution of sizes. In this refined approach, the distribution of the dynamic properties of the droplets also needs to be considered.
We will assume at the outset that the heavy Fermi liquid present in magnetically pure LiV2O4 is not affected by the presence of the magnetic defects. The measured 7Li relaxation versus time following saturation then arises from two mechanisms. The first is a single-exponential relaxation that is the same as in magnetically pure LiV2O4 and that comes from the contact interaction of 7Li nuclear spins with the conduction electron spins in the heavy Fermi liquid. The second mechanism is the hyperfine interaction of the nuclei with the magnetic defects. The first (homogeneous) mechanism gives a relaxation rate described by the Korringa law with .Slichter The main goal of the present modeling is to then determine the (second) contribution of the magnetic defects to the time-dependent nuclear relaxation and to subsequently interpret what that contribution means. The separation of these two contributions to the magnetic properties, at least above 1.8 K, is supported by previous magnetization measurementsKondo1997 ; Kondo1999 as well as by those in Sec. III.1 above. The magnetization as expressed in Eq. (2) contains a contribution almost independent of the magnetic defect concentration (see Table 1). This contribution is most likely due to the same heavy Fermi liquid that is present in magnetically pure LiV2O4 at low temperatures.
We will see that this separation of the magnetic properties into a heavy Fermi liquid part and a magnetic defect part can consistently explain our 7Li NMR measurements on our powder samples of LiV2O4. However, as we will show in Fig. 13(a) below, our NMR longitudinal magnetization recovery data below K for our sample of single crystals indicate that the Fermi liquid is modified by the presence of magnetic defects and/or that our model for the magnetic defects is no longer accurate below that temperature in our single crystals. This differentiation between the bulk crystal and powder properties indicates that there are differences between the natures of the magnetic defects and/or their interactions in single crystals as compared to powders, which in turn are likely associated in some way with the quite different preparation conditions of the two types of samples.
IV.2 Geometric Inhomogeneity
IV.2.1 7Li NMR Line Width
First we will analyze the 7Li NMR line width by considering the distribution of distances between nuclear spins and point-like magnetic defects within the spinel structure. Dilute paramagnetic centers give rise to a broadening of the NMR spectrum through inhomogeneous dipolar and RKKY interactions and in the limit of great dilution the line shape approaches a Lorentzian with full width at half maximum intensity (FWHMb) given by Walstedt1974
| (6) | |||||
where cm-3 is the number density of LiV2O4 formula units, for purely dipolar interactions and if the RKKY interaction is also important, is the thermal average value of magnetic defect spin polarization along the direction of the applied magnetic field and is equal to with [see Eq. (2)]. The line shape due to the dilute magnetic defects is LorentzianWalstedt1974 while the line shape due to the two contributions in Eq. (4) is Gaussian.Vleck1948 ; Drain1962 In order to obtain the final FWHM value, we convolute a Gaussian distribution with FWHM = 1 with a Lorentzian distribution that has FWMH = and the same mean value as the Gaussian distribution. We find that the FWHM of the convoluted distribution can be approximated by to within 10% for all values of . We estimate the total FWHM by combining Eqs. (4) and (6) according to
Using the values of , and in Table 1 and the results for FWHMa in Fig. 5, the FWHM data in Fig. 5 for all four samples were simultaneously fitted by Eq. (IV.2.1), except for the single crystal data below 1.3 K, where the nuclear spin-lattice relaxation rates in Fig. 8 indicate a possible screening of the magnetic defects. The only fitting parameter was , and the best fit value was . The best fit to the data is displayed as the set of solid curves in Fig. 5. The high quality of the fit shows that the local field inhomogeneity at the 7Li nuclear sites arising from the distribution of distances between the 7Li nuclei and the magnetic defects is an essential contributor to the 7Li NMR line width.
IV.2.2 7Li Nuclear Spin-Lattice Relaxation
In the present approach we treat the magnetic defects as identical localized magnetic moments. The distribution of 7Li nuclear spin-lattice relaxation rates then arises from a distribution of fluctuating local magnetic fields at the nuclear sites due to a distribution in the positions of the nuclei relative to the magnetic defects. Since the relative positions of the 7Li nuclei with respect to the magnetic defects are fixed, the shape of the 7Li probability distribution due to the defects should be temperature independent. This would give rise to a temperature independent valueJohnston2005 ; Johnston2006 in the stretched exponential function in Eq. (5) if there were no additional contributions to the 7Li nuclear spin-lattice relaxation.
The observed temperature dependences of the stretching exponent in the insets of Figs. 7 and 8 are explained in this model by the additional Korringa contribution to that is proportional to the temperature. Since the nuclear spin-lattice relaxation rate due to itinerant conduction electrons is assumed to be homogeneous across the sample since it results from the contact interaction between the nuclear and conduction electron spins, the nuclear spin recovery due to the conduction electrons alone should be a single exponential. As just discussed, the recovery due to the magnetic defects alone should be a stretched exponential function with a temperature-independent . The observed temperature dependent arises in our model from different temperature dependences of the Korringa and magnetic defect contributions to the nuclear spin-lattice relaxation. Different temperature dependences result in different weights of these two contributions at different temperatures and accordingly different values are seen at different temperatures when the total recovery is fitted by a stretched exponential function Eq. (5). Similarly, it is not appropriate to analyze the data in Figs. 7 and 8 in terms of a sum of contributions from the heavy Fermi liquid and from the local magnetic defects, because their respective contributions to cannot be deconvoluted.
To determine the magnetic defect contribution to the 7Li nuclear spin dynamics, we first extract from the observed 7Li nuclear spin-lattice relaxation versus time data what the contribution of the magnetic defects is, and then derive parameters describing the relaxation by the magnetic defects. To accomplish the former goal, we write , where is the contribution to the 7Li nuclear spin relaxation from the magnetic defects and is the Korringa contribution from the heavy Fermi liquid, where we assume a concentration independent Korringa relaxation rate and the coefficient of is taken to be the value in a magnetically pure sample.Johnston2005 Then one obtains
| (8) |
Thus is determined by multiplying the experimentally observed by .
We find that the magnetic defect contribution to the 7Li nuclear spin-lattice relaxation usually follows a stretched exponential time dependence in our temperature range K with a temperature- and magnetic defect concentration-independent stretching exponent , as anticipated above, where we find that has the specific value . Thus we obtain
| (9) |
where the new parameter takes the place of in Eq. (5). Figures 12 and 13(a) show plots of the logarithm of versus in external magnetic field T and at different temperatures for powder and single crystal samples, respectively. In powder samples 7a ( mol%) and 6a ( mol%), can be fitted very well by Eq. (9) at all temperatures, as shown by the linear fits in Figs. 12(b) and (c), respectively. In powder sample 6b with a smaller mol% in Fig. 12(a), follows root exponential behavior for all times at the higher temperatures but only at short times at the low temperature of 0.61 K. We infer in Sec. IV.2.4 below that the deviation at longer times is due to the effect of spin diffusion. In the crystals, in Fig. 13(a) follows root exponential decay above 1.3 K but at lower temperature instead shows an unphysical increase at later times. This unphysical behavior suggests that Eq. (8) overestimates the conduction electron contribution to the nuclear spin-lattice relaxation at temperatures below 1.3 K, the separability of the relaxation due to the magnetic defects from that due to the conduction electrons is no longer appropriate in that temperature regime, or the conduction electrons no longer form a Fermi liquid. An additional possible reason for the unphysical behavior is given in Sec. IV.3. Resolving this issue is an important topic for future research.
We extract versus temperature from the slopes of the fitted lines of versus in Figs. 12 and 13(a) according to Eq. (9). The results are displayed in Figs. 13(b) and 14 for the single crystal and powder samples, respectively. The versus in powder samples 7a and 6a in Figs. 14(b) and (c), respectively, show an almost field independent peak, similar to the peaks in versus in Figs. 7(b) and (c). As discussed above, the peaks are attributed to spin freezing of the magnetic defects. For the single crystals, we only extract values above 1.3 K for reasons discussed above. Here is nearly constant from 4.2 K down to about 2 K, but then shows a decrease upon further decrease in . This behavior is very different from that of the powders.


The above root exponential relaxation behavior has been reported previously in systems where the nuclear spin-lattice relaxation rate is proportional to , where is the distance between a nucleus and a nearby paramagnetic center, and no nuclear spin diffusion takes place.McHenry1972 ; Tse1968 Nuclear spin-lattice relaxation due to fluctuations of both dipolar and RKKY interactions have such dependences. In general, one can write the nuclear spin-lattice relaxation rate at the nuclear site due to a nearby paramagnetic center at location as
| (10) |
where is the vector connecting the paramagnetic center and nuclear spin, is the angle between and the external magnetic field, is the angular dependence of , is the average of over all directions, and
| (11) |
is a parameter proportional to the spectral density of spin fluctuations (with correlation time ) at the nuclear Larmor frequency .McHenry1972 The defect contribution of the recovery of the nuclear magnetization towards equilibrium is then given as
| (12) |
where the sum is over all defect sites. We first ignore the spatial variation of the microscopic relaxation rate, i.e. we assume that is the same for all defects, and concentrate on the geometric inhomogeneity as caused by a varying distance between nuclear spins and defects. In order to evaluate the average over defect positions we write where is an arbitrary function of position , is a vanadium site position, we assume the magnetic defects are at vanadium lattice sites, and the sum over now runs over all vanadium sites, not only magnetic defect sites. The random variable is with probability and with probability and assumed uncorrelated for different sites, i.e. defect positions are uncorrelated. Following Refs. McHenry1972, and Tse1968, we obtain in the limit of low defect concentration () that
| (13) |
The sum over the lattice is evaluated as an integral. In the long time limit we obtain the result as given in Eq. (9) where is then given byTse1968 ; McHenry1972
| (14) |
where is the number density of LiV2O4 formula units.
In the Appendix, we show that instead of solving for the relaxation curve, we can understand the occurrence of a root exponential relaxation as arising from our calculated probability distribution of nuclear values. We will discuss the temperature and field dependences of when we study the dynamics of the magnetic defects in Sec. IV.2.5.
IV.2.3 Hole Burning Experiment and the Dependence of Relaxation on the Position in the Spectrum
Bloembergen and coworkersBloembergen1959 have considered the problem of spin diffusion in the frequency domain (spectral diffusion) in a spectrum with the same kind of inhomogeneous broadening as discussed for the longitudinal spin relaxation. The time for a hole to diffuse through the whole spectrum by two-spin mutual spin flip is estimated to be , where is the intrinsic nuclear spin-spin relaxation time and is the half width at half maximum of the transient echo signal. In the powder sample 6a ( mol%), and , so s. In the powder sample 6b ( mol%), and which give ms. Both diffusion times are much longer than the values of at 4.2 K in each sample in Figs. 7 and 8, and are thus consistent with the lack of spectral diffusion in Fig. 10.
The higher relaxation rates at the wings of the spectrum compared to that at the peak of the spectrum as shown in Fig. 11 can also be qualitatively explained within the approach where we only include the geometric distribution of the nuclear spin to defect separations. For concreteness of discussion, we assume that the local field is purely dipolar. Denote the angle between the applied magnetic field and the direction from a magnetic defect to a nuclear spin by and the distance between the defect and the nuclear spin by . The NMR frequency shift depends on and through , while the nuclear spin-lattice relaxation rate depends on and through .Abragam The higher relaxation rates observed at the wings compared to that at the peak of the spectrum is due to the monotonic decrease of both the frequency shift and the nuclear spin-lattice relaxation rates with increasing distance . The nuclear spins with larger frequency shift will also have a higher probability of having larger values.
IV.2.4 7Li Nuclear Spin Diffusion
The of powder sample 6b ( mol%) in Fig. 12(a) deviates from a root exponential decay at ms at K. This can be attributed to the effect of spin diffusion.Blumberg1960 Spin diffusion tries to establish a common spin temperature (i.e., the same longitudinal magnetization) among nuclear spins at different distances from the defects and results in a single exponential relaxation at long . Figure 15 displays versus of the same data as in Fig. 12(a) at K, but on a semilog scale, which suggests a single exponential decay at ms. A fit by to the data at ms gives s-1 and . The best fit is shown as the straight line in Fig. 15.
A crossover from a root exponential to a single exponential decay occurs in the case of diffusion limited relaxation as discussed first by Blumberg in Ref. Blumberg1960, . The time , at which the crossover from a root exponential to a single exponential decay takes place, is related to the spin diffusion constant throughBlumberg1960
| (15) |
where we dropped the subscript of in Eq. (11) since we assume the same spin dynamics for all the magnetic defects. The diffusion constant is related to the rate of mutual flips of nearest neighbor nuclear spins throughAbragam
| (16) |
where is the distance between the two spins. The rate of the single exponential decay at long times in Fig. 15 is given byBlumberg1960
| (17) |
where is the number density of LiV2O4 formula units.

In order to confirm the spin diffusion interpretation, below we will show that the estimated crossover time and are of the same order of magnitude as the observed ms and s-1, respectively. The mutual spin-flip is due to nuclear dipolar interactions and the value of can be estimated using Fermi’s golden rule. For nuclear spins having , after averaging over the angular dependence, one obtainsAbragam
| (18) |
where is the spectral density of the two spin system at zero Zeeman energy and is the gyromagnetic ratio of the nuclear spins. The 7Li nuclei have spin , but an expression for when is not available, and the above equation for should provide at least a rough estimate of . Approximating by ,Abragam where kHz2 is the Van Vleck second moment of the 7Li nuclei,Onoda1997 and taking Å, which is the nearest-neighbor 7Li-7Li distance in LiV2O4, we find from Eq. (18) and from Eq. (16).
The value of in Eq. (15) can be obtained from Eq. (14) where is measured using Eq. (9) from the initial root exponential part of in Fig. 12(a) for powder sample 6b. At K and T, one obtains s-1, so one has cm6 s-1. Using the above and mol%, Eq. (15) yields the crossover time ms and Eq. (17) yields the long time decay rate s-1. Due to the uncertainty in our estimate of the parameter and the approximate nature of Eq. (15), the estimated and values should be considered to be consistent with the observed ms and s-1, respectively.
The absence of a deviation from root exponential behavior in samples 7a ( mol%) and 6a ( mol%) as shown in Figs. 12(b) and (c) may be due to the effect of inhomogeneous broadening, which decreases the probability of overlap of Zeeman level splittings of neighboring 7Li nuclei and results in a decrease in the spin diffusion constant . Furthermore, due to the higher concentrations of the defects, values of at ms in these two samples are much smaller than in the 0.21 mol% sample, making such a deviation more difficult to observe.
IV.2.5 Magnetic Defect Spin Dynamics in the Powder Samples
In this section, we discuss the relation of the nuclear spin-lattice relaxation rate to the dynamics of the magnetic defects in the powder samples. We consider the weak collision limit , where is the magnitude of the local fluctuating field at the nuclear site and is the magnitude of the static applied field. The nuclear spin-lattice relaxation rate due to an electronic magnetic defect spin at the origin is then given byAbragam
| (19) |
where is the position of the nuclear spin with respect to the magnetic defect, is the hyperfine coupling constant between the nuclear spin and the magnetic defect, is the nuclear Larmor angular frequency, and () are the magnetic defect spin autocorrelation functions.
As indicated in the ac susceptibility measurements, the peaks in versus in Fig. 14 are related to spin freezing of the magnetic defects. As a first attempt, we assume a single exponential decay for the magnetic defect spin autocorrelation functions and assume that the freezing process is due to an energy barrier so that the correlation time follows
| (20) |
where is the fluctuation rate of the paramagnetic defects at high temperature and is the energy barrier in temperature units. For simplicity, we will assume that all the magnetic defect spins in a sample have the same correlation time . For dipolar or RKKY interactions, the nuclear spin-lattice relaxation rate of a 7Li nucleus due to a nearby defect at distance isAbragam
| (21) |
where the angular dependence is ignored and the prefactor is written in such a way that would correspond to relaxation due solely to the fluctuating dipolar field of the longitudinal component of the magnetic defect spin. The presence of additional relaxation channels would increase the value of . By comparing Eqs. (10), (11), and (21), one has
Inserting this expression for into Eq. (14), the measured characteristic relaxation rate can be written as
| (22) |
At high temperatures, is generally much shorter than the inverse of the nuclear Larmor frequency . As increases with decreasing temperature , a peak appears in versus at the temperature where .
| Sample | (mol%) | (K) | |
|---|---|---|---|
| 6b | 0.85 | 0.04(4) | 1.1(1) |
| 7a | 1.9 | 0.17(6) | 1.8(2) |
| 6a | 3.6 | 0.24(4) | 2.5(2) |
We fit the data in Fig. 14 on all three powder samples simultaneously by the combination of Eqs. (20) and (22). Possible field and temperature dependences of the parameter are ignored in the fit. There are seven free parameters in the fit, and for each sample and which is assumed to be sample independent. The fitting results are displayed in Fig. 14 by the solid curves. The best fit value of is s and the best fit values of and for each sample are listed in Table 2. The energy barrier increases with increasing concentration of magnetic defects, which indicates that the dynamic slowing down with decreasing temperature originates from the interaction between the magnetic defects. Interaction between magnetic defects should increase with increasing concentration of the magnetic defects since the average nearest-neighbor distance decreases.
The values of in all three samples are much less than unity, a fact which cannot be explained by the presence of other nuclear spin-lattice relaxation mechanisms since additional relaxation mechanisms would increase . Such small values of might be related to the spin-glass like freezing as observed in the ac magnetic susceptibility measurements. In spin glass systems, the spin autocorrelation functions are highly nonexponential,Ogielski1985 ; Murani1981 which reduces the spectral density of the magnetic defect spin fluctuations at as compared to the Lorentzian in Eq. (22). The reduction in spectral density thus results in a reduction in the fitted value of in Eq. (22).
IV.3 Effects of a Size Distribution of Magnetic Droplets
Our previous discussion demonstrated that the non-exponential time dependence of the 7Li nuclear spin-lattice relaxation in the sample of single crystals below 1.3 K cannot be understood in terms of the interaction of the nuclear spins with separable contributions from a heavy Fermi liquid and a random distribution of point-like magnetic defects. This problem is exemplified by the unphysical data at long times in Fig. 13(a) where the data move away from equilibrium rather than towards equilibrium with increasing time . An appealing approach that refines our previous analysis is based on the hypothesis that the magnetic defects are not point-like, but are rather magnetic droplets with an average size significantly larger than an atomic size. This hypothesis is supported by the large average spins of the magnetic defects inferred above in Sec. III.1 and previouslyKondo1999 ; Das2006 to be –4. We envision that the magnetic droplets have a variable size and spin and that the corresponding microscopic internal relaxation time varies with droplet size. Our arguments parallel those for the unusual spin dynamics due to statistically rare fluctuations that becomes crucial in the context of Griffiths singularities close to phase transitions.Griffiths ; Bray87
In most three-dimensional systems a high temperature Curie-Weiss behavior of the susceptibility with Weiss temperature is indicative for magnetic ordering at a lower temperature . However, the geometric frustration for antiferromagnetic ordering within the vanadium sublattice of the spinel structure is likely the reason why long-range antiferromagnetic order is suppressed in pure LiV2O4 and a heavy electron state emerges instead. Defects in the crystal structure can locally lift the frustration and easily cause magnetic order in a finite region of volume around the crystal defect where the linear size is, due to the proximity to an ordered state, expected to be larger than the interatomic spacing. Here is the dimensionality of the system. These finite regions of magnetic order are what we are calling magnetic droplets.
Fluctuations in the local tendency towards order usually lead to a probability density for the linear droplet size that decreases exponentially with the volume of the droplet. In three dimensions one obtainsThill1995
| (23) |
where is the mean droplet size. It is then natural to assume that the typical internal excitation energy of a droplet decreases with increasing droplet size. These excitations can change the magnitude and/or direction of the magnetic moment of the droplet. Often the excitation energy varies with according to a power law
| (24) |
where we have set and is the relaxation time of the excitation. The arguments of Ref. Bray87, yield a result for classical Heisenberg spins, where for the present problem. Quantum effects can then yield deviations from this behavior and typically yield exponents that are larger than the above classical result.Vojta05 In some cases, such as Ising spins in a magnetic field or Heisenberg spins in a metallic host,Vojta05 the quantum dynamics can lead to a droplet dynamics in three dimensions where
| (25) |
Finally, in case of magnetic defects with Ising anisotropy inside a metallic host, the quantum dynamics of the defect leads to a freezing of all droplets beyond a certain size, typically of order (see Refs. Millis01, and Millis05, ).
To illustrate the effects of such droplet dynamics we concentrate first on the case Eq. (24). In the absence of a microscopic model of the droplet spin dynamics we leave an open parameter of the model. We start from Eqs. (9) and (14) and write
| (26) |
where is given in Eq. (22) with replaced by . In the evaluation of this average we have two very distinct limits. If the long time behavior of the system is dominated by small clusters since and slow nuclear relaxation is caused by fast droplet dynamics. In this limit, the average over droplet sizes will not cause any changes in the stretched exponential behavior as compared to our previous, purely geometric, considerations for point-like magnetic defects. The inequality is expected to be valid at higher temperatures, before a freezing or dramatic slowing down of the droplet moments sets in with decreasing temperature. This is fully consistent with our findings that we obtain in this regime. The situation changes dramatically in the limit where , relevant at lower temperature, i.e. most likely for . Now and slow nuclear relaxation is tied to slow droplet relaxation. In this regime we find
| (27) |
In the long time limit, the average over the droplet sizes in Eq. (26) can be performed via saddle point integration and yields
| (28) |
with
| (29) |
i.e., the additional inclusion of droplet size variations yields a stretched exponent . The characteristic relaxation rate of the droplets is
| (30) |
We emphasize that the static size distribution of magnetic droplets only becomes apparent by NMR at low temperatures such that , where is the nuclear Larmor frequency. We also emphasize that the analyses in this section do not include interactions between droplets and a possible resultant spin glass phase. Above size variations of the droplets will not affect the long time nuclear relaxation, even if they are present.
In case of an exponential dependence of the droplet excitation energy, Eq. (25), the long time dynamics of the nuclear spins at low is even more dramatically affected and changes to a power law decay , with nonuniversal exponent . At the same time heat capacity and susceptibility measurements also experience power law behavior.Vojta05 In this regime droplet quantum fluctuations will not only dominate the long time dynamics of the nuclear decay, but also thermodynamics quantities. This might be responsible for the fact that it is not possible any longer to clearly separate the response of the underlying Fermi liquid from that of the droplet at low temperatures in our single crystals, as indicated by Fig. 13(a).
Our data for single crystals do not allow at present to distinguish between the different scenarios outlined in this section. They do however suggest that dynamics of the magnetic droplets plays an important role.
V Summary and Conclusions
The modeling approach in Sec. IV.2 gives a good description of our 7Li NMR results from 0.5 to 4.2 K for our LiV2O4 powder samples containing magnetic defect concentrations up to 0.83 mol%. This approach assumes that (i) there is a random distribution of magnetic point defects, (ii) the heavy Fermi liquid in magnetically pure LiV2O4 survives in samples containing up to mol% magnetic defects, and that (iii) the influences of the magnetic defects and of the Fermi liquid on the magnetization and NMR properties are separable. This description explains very well the defect concentration-independent value from our low-temperature magnetization measurements, the inhomogeneous broadening of the 7Li NMR spectrum, the nonexponential 7Li nuclear spin-lattice relaxation versus time behavior, and the lack of spectral diffusion in the 7Li NMR hole burning experiments. It also explains the smaller 7Li nuclear spin-lattice relaxation rate at the peak of the spectrum as compared to that at the wings. However, it is hard to reconcile the picture of magnetic point defects with the high magnetic moments for the defects (spins of 2–4) deduced here (see Table 1) and in Refs. Kondo1999, and Das2007, from magnetization measurements. These large defect spin values suggest that the magnetic defects may not behave like point-like magnetic moments under all circumstances. In Sec. IV.3 we discussed magnetic defects that are more extended entities that we have called magnetic droplets with a distribution of sizes, and likely a distribution of spin values. We showed that such a size distribution can affect the NMR magnetization recovery at long times at low temperatures in the regime where interactions between the magnetic droplets can be neglected.
Our study shows that there can be different kinds of magnetic defects in the LiV2O4 system. As revealed by the nuclear spin lattice relaxation rate data and ac magnetic susceptibility measurements at 14 MHz, it is amazing that the magnetic defects in the powder samples undergo a spin glass-like freezing below 1 K, while the magnetic defects in the single crystals with a similar magnetic defect concentration exhibit a very different behavior at such low temperatures, with no evidence for spin freezing. The different kinds of magnetic defects and/or interactions in the crystals and powders must be associated with different types of structural defects in the system, which might be expected because the crystals are grown at about 1000 ∘C whereas the powders are synthesized at 700∘C. Different types of magnetic defects were even found in an annealing study of different single crystals,Das2007 where heat treatment at 700 ∘C was found to remove the magnetic defects in one but not in other single crystals.
Further experiments on the single crystals are urgently needed at K and below. These experiments should test whether the Fermi liquid is modified by quantum fluctuations of large magnetic droplets in the single crystals at K, whether the magnetic properties of the crystals contain separable contributions from the Fermi liquid and the magnetic defects, and whether the conduction electrons in the crystals even form a Fermi liquid. In addition, the origin of the distinct kinks at about 1.4 K in the temperature dependences of and in Fig. 7 and of in Fig. 8 for the single crystals remains to be explained.
Acknowledgements.
We are grateful to B. J. Suh for many beneficial suggestions. Work at the Ames Laboratory was supported by the Department of Energy-Basic Energy Sciences under Contract No. DE-AC02-07CH11358.*
Appendix A Probability Distribution Underlying Stretched Exponential Relaxation with
Here we discuss the stretched exponential 7Li nuclear relaxation versus time following saturation that arises from interactions between the 7Li nuclear spins and a low concentration of magnetic defect spins, which is in Eq. (9). We demonstrate that instead of theoretically solving for the relaxation curve and showing that it is a stretched exponential with as in Sec. IV.2.2, we can understand the occurrence of this root exponential relaxation as arising from the probability distribution of nuclear values.
We assume that in Eq. (9) is due to a continuous sum of exponential decays with a distribution of relaxation rates . Then one can write the stretched exponential relaxation function in Eq. (9) as
| (31) |
where equals normalized by , i.e., , and is the probability density for occurrence of for a fixed exponent with . Thus the stretched exponential function is the Laplace transform of . Closed analytic expressions for with rational values of can be obtained from the inverse Laplace transform of the stretched exponential function, and physical interpretations of the parameters and have been determined.Johnston2005 ; Johnston2006 We show below that the probability distribution of due to dipolar interaction of nuclear spins with dilute magnetic defects corresponds very well to the distribution leading to the stretched exponential relaxation in Eqs. (9) and (31) with . This probability density is Johnston2005 ; Johnston2006
| (32) |
A plot of this distribution function is given below as the solid curve in Fig. 16. is proportional to for large [in general at large is proportional to ], and has a low- cutoff since exponentially approaches zero at small values (also true in general for arbitrary ).Johnston2006
A qualitative dependence of the probability distribution arises due to a dependence of as in Eq. (10) as follows. Ignoring the angular dependence in Eq. (10) and assuming the same dynamics for all the magnetic defect spins such that , in the single paramagnetic center limit the distribution of arising from a continuum distribution of nuclear spins around a magnetic defect isJohnston2005
| (33) |
This dependence is the same as the large- limit of the result in Eq. (32) for stretching exponent noted above. The distribution (33) diverges as approaches zero. This divergence is caused by the single impurity approximation. Nuclei with approaching zero correspond to those far away from the paramagnetic center. Due to the finite distance between different paramagnetic centers in a system with a finite concentration of them, the actual probability of finding a nuclear spin with should instead vanish, so a low cutoff has to be applied. This results in a distribution function with a shape (see the dashed curve in Fig. 16 below) roughly similar to that in Eq. (32) (the solid curve in Fig. 16 below).

We have carried out a numerical simulation of the probability distribution that turns out to be in very good agreement with the exact result for the probability distribution in Eq. (32) for the stretched exponential function with . In the simulation, we calculated the distribution of 7Li nuclei due to a random distribution of dilute point-like paramagnetic centers (defects) in the LiV2O4 spinel structure. The paramagnetic defects randomly occupy the vanadium sites with a probability of ( mol%) and the configuration of the random defects repeats every 80 unit cells in all three crystallographic axis directions. The of each 7Li nucleus is calculated usingAbragam
| (34) |
where is a constant, is the distance between paramagnetic center and the 7Li nucleus, and is the angle between the applied magnetic field and the vector from paramagnetic center to the 7Li nucleus. The applied magnetic field was arbitrarily chosen to be along the direction. Equation (34) is the nuclear spin-lattice relaxation due to the dipolar magnetic field fluctuations from the longitudinal spin component of the paramagnetic defects.Abragam In the presence of a strong applied magnetic field, the transverse spin fluctuation is often modulated by the Larmor frequency of the electronic spins and thus has negligible contribution to for which magnetic field fluctuations at the nuclear Larmor frequency are most important.Abragam The summation over in Eq. (34) includes all magnetic defects with , where Å is the lattice constant of cubic LiV2O4. We checked that changing the summation range to resulted in a negligible change in the distribution.
The distribution of resulting from the above simulation is displayed as the filled circles in Fig. 16, where the distribution is normalized by . The maximum relaxation rate plotted in Fig. 16 at is not a large relaxation rate cutoff to the probability distribution. Data at larger relaxation rates are not plotted due to insufficient statistics. The simulated distribution in Fig. 16 can be fitted very well by Eq. (32) with , as shown by the solid curve in Fig. 16. calculated from Eq. (14) is equal to , close to the simulated result. The difference may be due to the neglected angular dependence in deriving Eq. (14). For comparison, a simple power law distribution with a small cutoff of is also displayed in Fig. 16. This dependence is the same as in Eq. (33) and is the same as the asymptotic large- dependence of Eq. (32). The prefactor 0.08 is chosen to make the distribution overlap with the simulated result at large , and the low- cutoff is determined from the normalization condition .
References
- (1) S. Kondo, D. C. Johnston, C. A. Swenson, F. Borsa, A. V. Mahajan, L. L. Miller, T. Gu, A. I. Goldman, M. B. Maple, D. A. Gajewski, E. J. Freeman, N. R. Dilley, R. P. Dickey, J. Merrin, K. Kojima, G. M. Luke, Y. J. Uemura, O. Chmaissem, and J. D. Jorgensen, Phys. Rev. Lett. 78, 3729 (1997).
- (2) G. R. Stewart, Rev. Mod. Phys. 56, 755 (1984).
- (3) H. Takagi, C. Urano, S. Kondo, M. Nohara, Y. Ueda, T. Shiraki, and T. Okubo, Mater. Sci. Eng. B 63, 147 (1999).
- (4) C. Urano, M. Nohara, S. Kondo, F. Sakai, H. Takagi, T. Shiraki, and T. Okubo, Phys. Rev. Lett. 85, 1052 (2000).
- (5) K. Kadowaki and W. B. Woods, Solid State Commun. 58, 507 (1986).
- (6) P. Fulde, J. Phys.: Condens. Matter 16, S591 (2004).
- (7) R. Arita, K. Held, A. V. Lukoyanov, and V. I. Anisimov, Phys. Rev. Lett. 98, 166402 (2007).
- (8) V. Yushankhai, A. Yaresko, P. Fulde, and P. Thalmeier, Phys. Rev. B 76, 085111 (2007).
- (9) A. V. Mahajan, R. Sala, E. Lee, F. Borsa, S. Kondo, and D. C. Johnston, Phys. Rev. B 57, 8890 (1998).
- (10) D. C. Johnston, J. Low Temp. Phys. 25, 145 (1976).
- (11) M. Dalton, D. P. Tunstall, J. Todd, S. Arumugam, and P. P. Edwards, J. Phys.: Condens. Matter 6, 8859 (1994).
- (12) D. C. Johnston, S.-H. Baek, X. Zong, F. Borsa, J. Schmalian, and S. Kondo, Phys. Rev. Lett. 95, 176408 (2005).
- (13) H. Kaps, M. Brando, W. Trinkl, N. Büttgen, A. Loidl, E.- W. Scheidt, M. Klemm, and S. Horn, J. Phys.: Condens. Matter 13, 8497 (2001).
- (14) S. Kondo, D. C. Johnston, and L. L. Miller, Phys. Rev. B 59, 2609 (1999).
- (15) M. D. Vannette, A. Safa-Sefat, S. Jia, S. A. Law, G. Lapertot, S. L. Bud’ko, P. C. Canfield, J. Schmalian, and R. Prozorov, J. Mag. Mag. Mater. 320, 354 (2007).
- (16) S. Das, X. Ma, X. Zong, A. Niazi, and D. C. Johnston, Phys. Rev. B 74, 184417 (2006).
- (17) S. Das, X. Zong, A. Niazi, A. Ellern, J. Q. Yan, and D. C. Johnston, Phys. Rev. B 76, 054418 (2007).
- (18) D. Corson and P. Lorrain, Introduction to Electromagnetic Fields and Waves (W. H. Freeman and Company, San Francisco, 1962).
- (19) E. Fukushima and S. B. W. Roeder, Experimental Pulse NMR: A Nuts and Bolts Approach (Perseus Books, Cambridge, 1981).
- (20) A. Abragam, Principles of Nuclear Magnetism (Oxford University Press, Oxford, 1982).
- (21) J. H. Van Vleck, Phys. Rev. 74, 1168 (1948).
- (22) L. E. Drain, Proc. Phys. Soc. London 80, 1380 (1962).
- (23) M. Onoda, H. Imai, Y. Amako, and H. Nagasawa, Phys. Rev. B 56, 3760 (1997).
- (24) C. P. Slichter, Principles of Magnetic Resonance (Springer, Berlin, 1990), 3rd ed.
- (25) R. E. Walstedt and L. R. Walker, Phys. Rev. B 9, 4857 (1974).
- (26) D. C. Johnston, Phys. Rev. B 74, 184430 (2006).
- (27) M. R. McHenry, B. G. Silbernagel, and J. H. Wernick, Phys. Rev. B 5, 2958 (1972).
- (28) D. Tse and S. R. Hartmann, Phys. Rev. Lett. 21, 511 (1968).
- (29) N. Bloembergen, S. Shapiro, P. S. Pershan, and J. O. Artman, Phys. Rev. 114, 445 (1959).
- (30) W. E. Blumberg, Phys. Rev. 119, 79 (1960).
- (31) A. T. Ogielski, Phys. Rev. B 32, 7384 (1985).
- (32) A. P. Murani, J. Magn. Magn. Mater. 22, 271 (1981).
- (33) R. B. Griffiths, Phys. Rev. Lett. 23, 17 (1969).
- (34) A. J. Bray, Phys. Rev. Lett. 59, 586 (1987).
- (35) M. J. Thill and D. A. Huse, Physica A 214, 321 (1995).
- (36) T. Vojta and J. Schmalian, Phys. Rev. B 72, 045438 (2005).
- (37) A. J. Millis, D. K. Morr, and J. Schmalian, Phys. Rev. Lett. 87, 167202 (2001).
- (38) A. J. Millis, D. K. Morr, and J. Schmalian, Europhys. Lett. 72, 1052 (2005).