Quantized current blockade and hydrodynamic correlations in biopolymer translocation through nanopores: evidence from multiscale simulations
Abstract
We present a detailed description of biopolymer translocation through a nanopore in the presence of a solvent, using an innovative multi-scale methodology which treats the biopolymer at the microscopic scale as combined with a self-consistent mesoscopic description for the solvent fluid dynamics. We report evidence for quantized current blockade depending on the folding configuration and offer detailed information on the role of hydrodynamic correlations in speeding-up the translocation process.
Biopolymer translocation through nanoscale pores holds the promise of efficient and improved sensing for many applications in biotechnology, and possibly ultrafast DNA sequencing Kasianowicz_PNAS1996 ; Meller_PNAS2000 ; ultraseq . Recent advances in fabrication of solid-state nanopores Li_Nature2001 ; Storm_NatMat2003 have spurred detailed experimental studies of the translocation process, with DNA as the prototypical biopolymer of interest Dekker_Nat2007 . Computer simulations that can account for the complexity of the biomolecule motion as it undergoes translocation, as well as its interaction with the environment (the nanopore and the solvent), are crucial in elucidating current experiments Li_NatMat2003 ; Storm_NanoLett2005 and possibly inspiring new ones. Here, we study the dynamical, statistical and synergistic features of the translocation process of a biopolymer through a nanopore by a multiscale method based on molecular dynamics for the biopolymer motion and mesoscopic lattice Boltzmann dynamics for the solvent. We report evidence for quantized current blockade depending on the folding configuration (single- or multi-file translocation) in good agreement with recent experimental observations Li_NatMat2003 . Our simulations show the significance of hydrodynamic correlations in speeding-up the translocation process.
Nanopores are an essential element of cells and membranes, controlling the passage of molecules and regulating many biological processes such as viral infection by phages and inter-bacterial DNA transduction TRANSL . The last two decades have witnessed the emergence of artificial solid-state nanopores as potential devices for sensing biomolecules through novel means Dekker_Nat2007 . One of the most intriguing possibilities is ultra-fast sequencing of DNA by measuring the electronic signal as the biomolecule translocates through a nanopore decorated with electrodes ultraseq . While this goal still remains elusive, a number of detailed studies on DNA translocation through nanopores have been reported recently Li_NatMat2003 ; Storm_NanoLett2005 . These experiments typically measure the blockade of the ion current through the nanopore during the time it takes the molecule to translocate, which provides statistical information about the biomolecule motion during the process.
Numerical simulation of the translocation process provides a wealth of information complementary to experiments, but is hindered by the very large number of particles involved in the full process: these include all the atoms that constitute the biomolecule, the molecules and ions that constitute the solvent, and the atoms that are part of the solid membrane in the nanopore region. The spatial and temporal extent of the full system on atomic scales is far beyond what can be handled by direct computational methods without introducing major approximations. Some universal features of translocation have been analyzed by means of suitably simplified statistical schemes statisTrans , and non-hydrodynamic coarse-grained or microscopic models forrey07 ; DynamPRL ; Nelson or other mesoscopic approaches mesoscSims . Many atomic degrees of freedom, and especially those of the solvent and the membrane wall, are uninteresting from the biological point of view. The problem naturally calls for a multi-scale computational approach that can elucidate the interesting experimental measurements while coarse-graining the less important degrees of freedom.
We have developed a multiscale method for treating the dynamics of biopolymer translocation ourLBM and performed an extensive set of numerical simulations, combining constrained molecular dynamics (MD) for the polymer motion with a Lattice-Boltzmann (LB) treatment of the solvent hydrodynamics LBE . The biopolymer transits through a nanopore under the effect of a localized electric field applied across the pore, mimicking the experimental setup Storm_NanoLett2005 . The simulations provide direct computational evidence of quantized current blockade and confirm the experimentally surmised multiple-file translocation: the molecule passes through the pore in a multi-stranded fold configuration when the pore is sufficiently wide. The simulations offer detailed information about several experimentally difficult issues, in particular the role of hydrodynamic correlations in speeding-up the translocation process.
A three-dimensional box of size lattice units, with the spacing between lattice points, contains the solvent and the polymer. We take , ; a separating wall is located in the mid-section of the direction, . We use and , where is the total number of beads in the polymer. At the center of the separating wall, a cylindrical hole of length and diameter is opened. Three different pore sizes () have been used in the current simulations. Translocation is induced by a constant electric field acting along the direction and confined to a cylindrical channel of the same size as the hole, and length along the streamwise () direction. All parameters are measured in units of the lattice Boltzmann time step and spacing, and , respectively, which are both set equal to . The MD time step is five times smaller than . The pulling force associated with the electric field in the experiments is and the temperature is . The monomers interact through a Lennard-Jones 6-12 potential with parameters , and and the bond length among the beads is set at . The solvent is set at a density , with a kinematic viscosity and a drag coefficient .
We chose the separation between the beads to be equal to the persistence length of double-stranded DNA, that is 50 nm, and define the lattice spacing to be nm. The hole diameters is 3 . The repulsive interaction between the beads and the wall (with parameter WCA ) leaves an effective hole of size equal to nm. Having set the value of , we choose the time step so that the kinematic viscosity is expressed as: , with the viscosity of water () and the numerical value of the viscosity in LB units; this procedure gives , with . In order to ensure numerical stability, the relation must be satisfied. Having established the value of , we need to adjust the value of the drag coefficient accordingly, . This is significantly smaller than an estimate of the friction based on Stoke’s law for DNA LU , which is equivalent to an underdamped system, or an artificially inflated bead mass. This approach is consistent with the coarse graining of the time evolution in the coupled LB-MD scheme.
We focus on the fast translocation regime, in which the translocation time, , is much smaller than the Zimm time, which is the typical relaxation time of the polymer towards its native (minimum energy, maximum entropy) configuration. This corresponds to the strong-field condition . In this regime, simple one-dimensional Brownian models KARDAR , or Fokker-Planck representations, cannot apply because the various monomer units do not have time to de-correlate before completing translocation. The ensemble of simulations is generated by different realizations of the initial polymer configuration, to account for the statistical nature of the process. Initially, the polymer is generated by a three-dimensional random walk algorithm with different random numbers for each polymer configuration and one bead chosen randomly constrained at the pore entrance. Then, the polymer is allowed to relax for molecular dynamics steps without including the fluid solvent in the relaxation, while keeping the bead at the pore entrance fixed. We define as time zero (), the time after the relaxation, when the fluid motion is also added, the pulling force begins to act and the translocation process is initiated; at this moment the bead at the pore entrance is also allowed to move. At this stage we do not include any electrostatic interactions within our model for reasons of computational simplicity. As far as the biopolymer motion in the bulk of the solvent is concerned, this may actually be a good approximation of experimental conditions with high salt concentration, which leads to strong screening of electrostatic interactions. The situation at the pore region may require more refined treatment, beyond the scope of the present work.
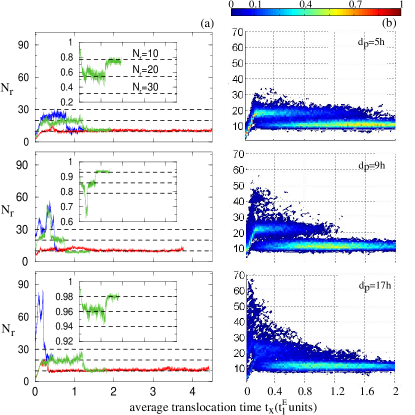
In Fig. 1(a) we present the number of pore-resident beads as a function of time, for a narrow (), mid-sized () and large () pore, with the mesh spacing of the lattice Boltzmann simulation, for representative (fastest, slowest and average speed) trajectories. Simulations are repeated over an ensemble of realizations of different initial conditions and for total polymer lengths up to . Time is measured in units of , the time it would take for the polymer to translocate if the monomers were to proceed in single-file configuration at the drift speed; this speed is given by , with and the charge and mass of the monomer, the external electric field and the hydrodynamic drag. This gives and the number of monomers in the pore for single file translocation is for the parameters used here.
Fig. 1(a) clearly shows the highly non-linear dynamics of the translocation process: In the initial stage of the translocation, the nanopore gets populated, with the number of resident monomers significantly overshooting the single-file value , the horizontal dashed lines at heights indicating -file () translocation. The range of explored by the translocation trajectories grows approximately with the cross-section of the pore, going from for the smallest pore up to for the largest one . Note that these values correspond to about half the maximum allowed q-number, . The fastest events correspond to the largest value observed, while the slowest events correspond to essentially throughout the translocation. It is also noteworthy that the translocation time typically exceeds the single-file value, , except for the fastest events; for the most probable events for all pore sizes indicating that conservative monomer-monomer interactions produce an effective slow down compared to a single Langevin particle subject to a constant electric drive and frictional drag .
Fig. 1(a) also presents the current blockade in all three pores for the most probable event in each case, which is the event with a translocation time close to the peak of the distribution over all translocation times. The current blockade is proportional to the number of monomers in the pore per unit area and appears to occur in well defined steps (quantized). Specifically, these blockades are calculated from the difference between the area of the resident beads, , and the total area of the pore, . In order to investigate the quantization of the current blockade we monitored the distribution of at various time frame intervals of 100 steps. The resident monomers block the current across the channel, so that conveys a direct measure of the current drop associated with the biopolymer passage through the nanopore. The corresponding histograms for three pore sizes are shown in Fig. 1(b). At early times, these histograms exhibit a multi-peaked structure, which is a clear signature of multi-file translocation. As time passes, the multiple peaks recede in favor of a single-peak distribution, close to the single-file value . This was found to be a stable-attractor for every simulated trajectory, indicating that the tail of the polymer always translocates as a single-file.
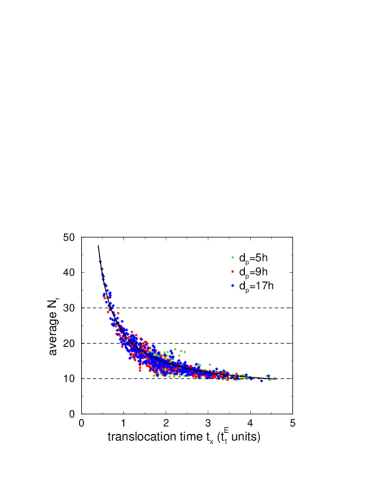
Collecting all results for the average number of resident monomers as a function of the translocation time , for the three pore sizes studied, we find a simple relationship, shown in Fig. 2. Experiments Li_NatMat2003 have reported that the average number of resident atoms in each translocation event varies approximately inversely with the duration of translocation :
| (1) |
The single-file asymptote () at long-times, , is evident. The short-time asymptote, reaching up to , corresponds to ultrafast translocations () occurring in the case of the large-diameter pore, . These results are intuitively reasonable, since large resident numbers imply that more monomers cross the pore per unit time, hence the translocation becomes faster. The results also support the notion of as a measure of the time-rate of the translocation, , from which the inverse-proportionality between and is a direct consequence of In this expression, is the number of translocated monomers at time .
The simulations reveal that solvent correlated motion makes a substantial contribution to the translocation energetics. The role of hydrodynamic correlations is best highlighted by computing the work done by the moving fluid on the polymer (we call this the synergy, ) over the entire translocation process as compared to the case of a passive fluid at rest:
| (2) |
where is the velocity of monomer and is the fluid velocity at the position of monomer . For the sake of comparison, it is also instructive to contrast with the corresponding work done by the electric field
| (3) |
where the sum extends over the resident monomers only, since the electric field is applied at the pore region only. These statistically averaged values of and reveal a number of interesting features (see Fig. 3).
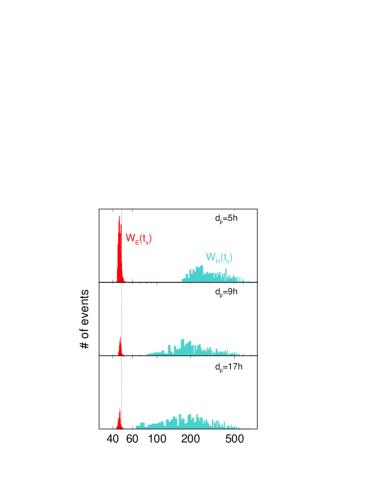
First, is always positive, clearly showing that hydrodynamic correlations provide a cooperative background, as compared to the case of a passive “ether” medium (). Second, we observe that the has a much narrower distribution of values than , reflecting the ordered structure of the biopolymer as it passes through the nanopore, as compared to its off-pore morphology. It is useful to introduce the work done by the electric field on molecules which translocate single-file and proceed through the pore at speed , . In the absence of any other interaction, a -file translocation at speed would complete in a time under an electric work . In the present simulations, , thereby for . Interestingly, the distribution of values is highly peaked at a value very close to . The observation that implies that and since the simulations show that , the conclusion is that , indicating that collective motion of the monomers slows down the process.
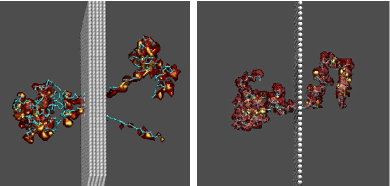
A major asset of numerical simulations for the study of translocation processes is the direct access to visualization of the morphology of the translocating chain. As an example, we show in Fig. 4 a typical “snapshot” at a time when about of the monomers have already passed through the pore of a translocating 2-folded chain of beads. In the same figure we show for comparison an event for the same length, but for single-file translocation (unfolded chain) through a very narrow () and shallow () pore. In addition to the polymer conformation, we show isocontours of the magnitude of the hydrodynamic synergy density
| (4) |
which is a local (in both space and time) version of the total synergy defined in Eq.(2), with a grid cell centered around location . The contours of illustrate the cooperative nature of the hydrodynamic field, with regions of high co-moving flow surrounding the translocating polymer and assisting its motion. This is suggestive of the notion of an “effective” polymer, dressed with the hydrodynamic synergy field, which acts as a self-consistent lubricant, helping the polymer to negotiate a faster passage through the nanopore.
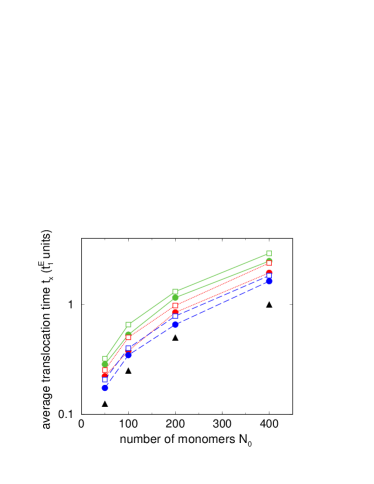
We further investigate this issue by inspecting the average (over an ensemble of realizations) translocation time, , as a function of the polymer length, with and without hydrodynamics. The results are shown in Fig. 5: hydrodynamics consistently accelerates the translocation by roughly percent. More intuitively, hydrodynamics literally re-normalizes the diameter of the pore: as is clearly visible in Fig. 5, a pore of diameter for a bare polymer (without the hydrodynamic field) is essentially equivalent to a pore of almost double diameter for the hydrodynamically-dressed polymer. In order to assess the degree of correlation between the translocation dynamics of the “dressed” polymer versus the actual one, we have measured the translocated specific synergy (synergy per monomer), defined as
| (5) |
with the number of translocated monomers at time . Clearly, any implicit time-dependent functional dependence of the form would indicate that mass and synergy translocate in a synchronized manner. We find that the ratio , reflecting the fact that the solvent locally “follows” the monomer and providing a measure of the relative importance of synergistic versus thermal forces. Our results show that is essentially constant throughout the translocation process. This implies a direct proportionality between the translocated synergy and the number of translocated beads and supports the notion that the “dressed” and the actual polymer proceed in full synchronization across the nanopore.
In conclusion, by using a new multiscale methodology based on the direct coupling of constrained molecular dynamics for the solute biopolymers with a lattice Boltzmann treatment of solvent dynamics, we have been able to confirm a number of experimental observations, such as a direct relation between quantized current blockades and multi-folded polymer conformations during the translocation process. In particular, the simulations reveal an intimate connection between polymer and hydrodynamic motion which promotes a cooperative background for the translocating molecule, thus resulting in a significant acceleration of the translocation process. Such an acceleration can also be interpreted as the outcome of a renormalization of the actual polymer geometry into an effective one, more conducive to translocation. This opens up exciting prospects for the development of optimized nano-hydrodynamic devices based on the fine-tuning of hydrodynamic correlations. As an example, one may envisage multi-translocation chips, whereby multiple molecules would translocate in parallel across membranes with an array of pores. The optimization of such devices will require control of solvent-mediated molecule-molecule interactions to minimize destructive interference between translocation events.
Acknowledgements
MB, SM and SS acknowledge support from the Initiative for Innovative Computing and thank the Physics Department of Harvard University for its hospitality. MF acknowledges support by the Nanoscale Science and Engineering Center of the National Science Foundation under NSF Award Number PHY-0117795.
References
- (1) Kasianowicz, J.J. Brandin, E. Branton, D. & Deamer, D.W. Proc. Natl. Acad. Sci. USA (1996), 93, 13770.
- (2) Meller, A. Nivon, L. Brandin, E. Golovchenko, J. & Branton, D. Proc. Natl. Acad. Sci. USA 2000, 97, 1079.
- (3) Deamer, D. W. & Akeson, M. Trends Biotechnol. 2000, 18, 180.
- (4) Li, J. et al. Nature 2001, 412, 166.
- (5) Storm, A.J. et al. Nature Mater. 2003, 2, 537.
- (6) For a recent review see Dekker, C Nature Nanotechnology 2007, 2, 209.
- (7) Li J. et al. Nature Mater. 2003, 2, 611).
- (8) Storm, A.J. et al. Nano Lett. 2005, 5, 1734.
- (9) Lodish, H. Baltimore, D. Berk, A. Zipursky, S. Matsudaira, P. & Darnell, J. Molecular Cell Biology, (W.H. Freeman and Company, New York, 1996).
- (10) Sung, W. & Park, P. J. Phys. Rev. Lett. 1996, 77, 783.
- (11) Forrey, C. & Muthukumar, M. J. Chem. Phys. 2007, 127, 015102.
- (12) Matysiak, S. Montesi, A. Pasquali, M. Kolomeisky, A. B. & Clementi, C. Phys. Rev. Lett. 2006, 96, 118103.
- (13) Lubensky, D. K. & Nelson, D. R. Biophys. J. 1999, 77, 1824.
- (14) Reboux, S. Capuani, F. Gonzalez-Segredo, N. Frenkel, D. J. Chem. Theory Comput. 2006, 2, 495.
- (15) Fyta, M.G. Melchionna, S. Kaxiras, E. & Succi, S. Multiscale Model. and Simul. 2006, 5, 1156.
- (16) Benzi, R. Succi, S. & Vergassola, M. Phys. Rep. 1992, 222, 145.
- (17) Weeks J. D., Chandler, D. and Andersen, H. C. J. Appl. Phys., 54, 5237 (1971).
- (18) Y. Lu, B. Weers, and N.C. Stellwagen, Biopolymers., 61, 261 (2002).
- (19) Kantor, Y. & Kardar, M. Phys. Rev. E 2004, 69, 021806.