HST NICMOS Imaging of z2, 24 -selected Ultraluminous Infrared Galaxies
Abstract
We present Hubble Space Telescope NICMOS -band imaging of 33 ultraluminous infrared galaxies (ULIRGs) at 2 that were selected from the 24 µm catalog of the Spitzer Extragalactic First Look Survey. The images reveal that at least 17 of the 33 objects are associated with interactions. Up to one-fifth of the sources in our sample could be minor mergers, whereas only two systems are merging binaries with luminosity ratio 3:1, which is characteristic of local ULIRGs. The rest-frame optical luminosities of the sources are of the order - and their effective radii range from 1.4 to 4.9 kpc. The most compact sources are either those with a strong active nucleus continuum or those with a heavy obscuration in the mid-infrared regime, as determined from Spitzer Infrared Spectrograph data. The luminosity of the 7.7µm feature produced by polycyclic aromatic hydrocarbon molecules varies significantly among compact systems, whereas it is typically large for extended systems. A bulge-to-disk decomposition performed for the six brightest (20) sources in our sample indicates that they are best fit by disk-like profiles with small or negligible bulges, unlike the bulge-dominated remnants of local ULIRGs. Our results provide evidence that the interactions associated with ultraluminous infrared activity at 2 can differ from those at 0.
1 Introduction
The excess of infrared (IR) emission in extragalactic sources is widely believed to be triggered most efficiently by gas-rich galactic mergers or interactions (e.g, Larson & Tinsley 1978; Sanders et al. 1988a). Dynamical instabilities are required to drive large concentrations of gas at small radii and to lead to a high rate of star-formation and an excess of IR emission ( ). The number density of both IR-bright sources and interactions evolves strongly with redshift , increasing to a redshift of at least 1 (Elbaz et al. 2002; Le Floc’h et al. 2005; Pérez-González et al. 2005; Conselice 2006; Kartaltepe et al. 2007). However, it is still unclear whether the interaction mechanisms that lead to high IR outputs are the same in the local Universe and at high redshifts.
Observations of ultraluminous IR galaxies (ULIRGs; ) in the local Universe indicate that ULIRGs represent a well-defined merger category. They are triggered by the merger of two gas-rich galaxies whose typical gas fractions are 10% of their dynamical masses (Downes & Solomon 1998). The merging components have comparable masses (Dasyra et al. 2006a) or luminosities (Kim et al. 2002; Murphy et al. 1996). The fairly specific origin of ULIRGs is thought to be related to their high phase-space gas densities, which are achieved through major mergers (e.g., Barnes 1992). The merger typically leads to the formation of elliptical galaxies (Joseph & Wright 1985). The remnants often have light profiles that follow an r1/4 distribution (Kormendy & Sanders 1992; Veilleux et al. 2002), fall on the velocity dispersion effective radius projection (Genzel et al. 2001; Tacconi et al. 2002; Dasyra et al. 2006b) of the fundamental plane of early-type galaxies (Dressler et al. 1987; Djorgovski & Davis 1987), and have a bulge-to-disk ratio of 1.5 (Veilleux et al. 2006).
The trigger mechanisms and end products of lower luminosity systems, such as the local luminous IR galaxies (LIRGs; ), are not constrained as well as those of local ULIRGs. The imaging analysis of Alonso-Herrero et al. (2006) indicates that most local LIRGs have prominent spiral patterns, and of those, a nonnegligible number are weakly interacting or even isolated systems. Ishida (2004) found that several minor mergers or fly-by interactions exist at the low-luminosity end of local LIRGs. However, as the luminosity increases so does the fraction of major mergers. Some LIRGs need to have the same origin as ULIRGs since every ULIRG has to pass through a LIRG phase before and after its main starburst episode (Murphy et al. 2001).
At high redshifts the situation is not as well defined, mostly because the merging galaxies are on average more gas rich than those in the local Universe. The amount of gas in, e.g., submillimeter galaxies is 40% of their total mass (Tacconi et al. 2006). It has been suggested that a variety of galaxy types can be produced by mergers of high gas fractions. The simulations of Springel et al. (2005) and Springel & Hernquist (2005) indicate that the merger outcome can vary between a red and dead elliptical or a spiral galaxy, depending on how much gas is converted into stars or expelled from the galaxy. Hammer et al. (2005) suggest that most local spiral galaxies may have undergone mergers within the last 8 Gyr by invoking star-formation duration and mass assembly arguments.
The goal of this paper is to investigate what processes lead to an ultraluminous IR activity at redshifts 1.52.5. Could high- ULIRGs be triggered in an analogous manner to local ULIRGs or to local LIRGs? If triggered by interactions, what are their progenitors and their end products? To address these questions, we requested observations of a sample of 35 ULIRGs at 2 using the Near Infrared Camera and Multi-Object Spectrometer (NICMOS) instrument on board the Hubble Space Telescope (HST) .
The rest of this paper is organized as follows. In § 2 and § 3 we present the sample and the data reduction used for the analysis in § 4. The presentation of the results in § 5 is followed by a comparison between z2 and local ULIRGs in § 6 and the conclusions in § 7. Throughout this paper we use a CDM cosmology with =70 km s-1 Mpc-1, =0.3, and =0.7.
2 The Sample
Our sources are drawn from a sample of IR-bright galaxies detected in the 24 µm mosaic of the 3.7 deg2 Spitzer Extragalactic First Look Survey (XFLS; Fadda et al. 2006). The selected sources have 24 µm fluxes greater than 0.9 mJy (Yan et al. 2005). Two extra criteria were imposed to ensure that the sample includes high- starburst galaxies: the flux ratios log([24 µm]/ [8 µm]) and log([24 µm]/ [6440 Å]) were required to be greater than or equal to 0.5 and 1, respectively. The use of these threshold values is based on template spectral energy distributions (SEDs) of local starbursts (Yan et al. 2004). The high IR-to-optical flux ratio preferentially selects starbursts at , since the observed -band magnitudes sample the SEDs shortward of the 4000 Å break. The high 24/8 µm flux ratio can either pick strong starbursts at whose 6.2, 7.7, and 8.6 µm polycyclic aromatic hydrocarbon (PAH) features are shifted in the 24 µm beam or obscured, reddened active galactic nucleus (AGN) continua (Yan et al. 2004, 2007; Brandl et al. 2006). In total, 52 XFLS sources that satisfy these criteria were observed with the Infrared Spectrograph (IRS; Houck et al. 2004) on board Spitzer. The mid-infrared (MIR) spectra yielded redshifts for 47 sources in the range [0.61,3.2] (Yan et al. 2007). For the NICMOS observations, we chose to observe only the sources at so that we can perform an imaging analysis at comparable rest-frame wavelengths for all sources. Of the 35 sources at , 33 were successfully observed. These 33 sources are presented in Table 1 and their redshift distribution is presented in Figure 1.
From the IR point of view, most of the sources in this sample are ULIRGs. The rest-frame 14 µm luminosity, L14, which is based on spectral fitting of IRS data by Sajina et al. (2007), is greater than 1012 for 27 sources, indicating that their bolometric IR luminosities, , are in the range of ULIRGs or higher. The bolometric IR luminosities are computed, when possible, by fitting the far-infrared (FIR) SEDs of the sources using Spitzer MIPS 70 and 160 µm fluxes, and Max-Planck Millimeter Bolometer 1.2 mm fluxes (Sajina et al. 2008; see Table 1). The SED fitting indicates that three more sources have values that exceed the ULIRG threshold. On average, the IR luminosity of these sources is substantially greater than that of local ULIRGs (e.g., Kim et al. 2002) and is close to the 1013 limit, which defines the hyperluminous IR galaxies. The remaining three sources, namely MIPS 8493, MIPS 16133, and MIPS 22661 are also likely to be ULIRGs given their high values and upper limits (Sajina et al. 2008).
The 7-38 µm IRS spectra revealed that the IR emission arises to comparable levels from intense star formation, AGN activity, or a combination of the two (Yan et al. 2007). About one-third of the sample has a strong silicate absorption feature at 9.7 µm, which implies that the main emission mechanism is compact and heavily obscured; it can either be a nuclear starburst and/or an AGN (Spoon et al. 2007). Therefore, the IR emission of high- ULIRGs has a multiple origin, similar to that of local ULIRGs as revealed by Infrared Space Observatory (ISO; Genzel et al. 1998; Rigopoulou et al. 1999) and Spitzer spectroscopic data (Armus et al. 2007).
3 Observations and data reduction
The observations of this program (ID 10858) were carried out using the NIC2 camera of the NICMOS instrument. The pixel scale of NIC2 corresponds to 0076 and 0075 along the x and y axis respectively. The resolution of the images is high, 0158, as measured from the full width half maximum (FWHM) of stellar light profiles. The images were taken in the -band using the F160W filter, which is centered at a wavelength of 1.6 µm. The wavelength that corresponds to the center of the filter at the rest frame of each source is in the range [4310, 6150] Å. The width of the F160W filter at the rest frame of each source is presented in Table 1. The detector read-out mode was set to “multiaccum” with 23 or 24 consecutive, non-destructive reads leading to an individual exposure. The observations were performed using a spiral four-point dither pattern per orbit to optimize the removal of bad pixels. The total on-source integration time for the four dither positions was either 2688 or 2560 s. The number of orbits per source was determined by the source’s Spitzer Infrared Array Camera (IRAC; Fazio et al. 2004) 3.6 µm flux. The sources with flux density greater than the detection limit of the XFLS catalog (20 Jy; Lacy et al. 2005) were typically observed for a single orbit. The sources that are fainter than this threshold were observed for two orbits. The total on-source integration times are presented in Table 1.
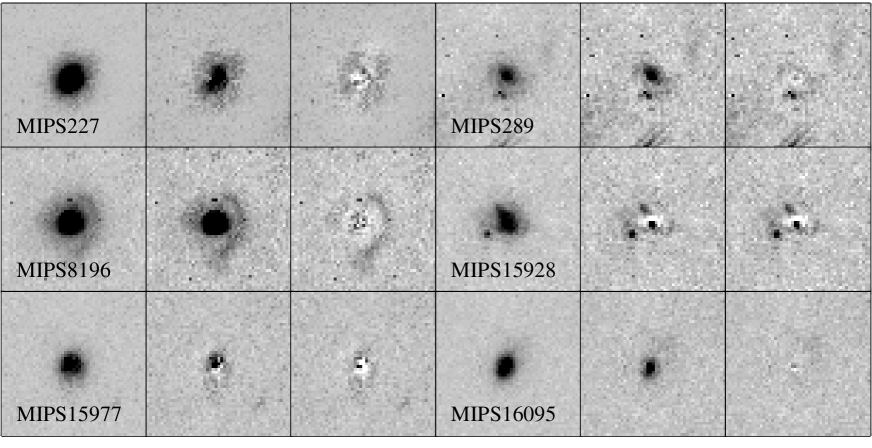
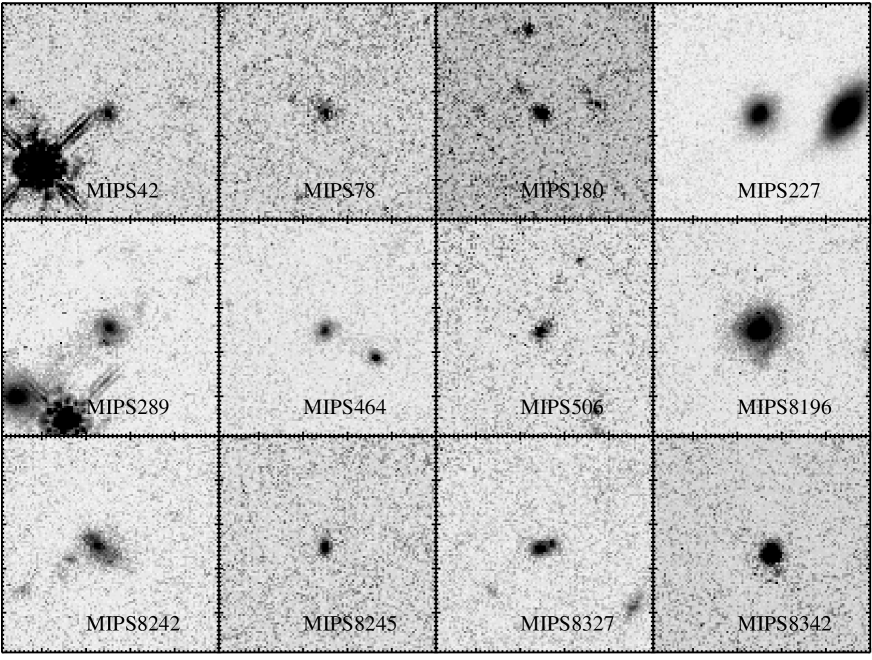
The reduction and calibration of the NICMOS images were performed using standard HST IRAF and IDL routines and following the prescriptions of the NICMOS manual (Barker et al. 2006). The pipeline calnica function was used to remove the zeroth detector read-out image from the non-destructive consecutive read-out images, and to correct for detector nonlinearities, dark currents, and bar effects. The same task was also used to flat field and combine the consecutive read-out images into a single image, computing its statistical error. We then used the IRAF task pedsky to bring the quadrants of the detector to similar bias levels and to apply a zeroth order removal of the sky background. Following pedsky, we corrected for South Atlantic anomaly effects using the IDL procedure saa clean. To correct for systematic sky residuals and enhance the signal-to-noise ratio of our background-limited observations, we constructed a residual sky image by median combining the images at the different dither positions. We then removed the sky residuals from each of these images, shifted them into their common reference position, and removed cosmic rays and bad pixels. The fluxes of the bad pixels were replaced with their average value in all other useful dither positions. To enhance the resolution of our images, we resampled the pixels to half their original size using the IRAF routine drizzle. This routine simultaneously corrects for detector geometric distortions. The resulting images were weight-averaged using their uncertainty images, which were also corrected for shifting and drizzling transformations. The weight-averaged image and its final uncertainty image were drizzled back to their initial pixel scale. The final images are presented in Figure 2.
4 Data analysis
Our images show that a significant fraction of sources have irregular patterns indicative of interactions. For the proper photometric calibration of such sources, we need to ensure that all of their light will be accounted for, even if it is distributed in asymmetric structures (e.g., tidal tails). For this reason, we performed a basic photometric analysis by fitting a series of isophotal ellipses to each galaxy with the sextractor software (Bertin & Arnouts 1996). Using sextractor, we first ensured the detection of each source at a 3 level and then integrated its flux down to 1 level. Sextractor measured the flux, the effective (half-light) radius, the ellipticity, and the position angle of each galaxy within that detection limit. We converted the integrated galaxy counts per second to an apparent Vega magnitude using the NICMOS data calibration prescription (Dickinson et al. 2002)
| (1) |
where fCPS is the source flux in counts per second, PHOTFNU is the conversion factor from counts per second to janskys, and (Vega) is the Vega flux in janskys for the given NICMOS camera and filter passband. PHOTFNU is computed by calnica and equals 1.49585 Jy s count-1. For NIC2 at F160W, (Vega) is 1043.6 Jy.
Following the global photometric characterization of all the sources in our sample, we decomposed the brightest systems into a bulge and a disk component using galfit111Galfit is thought of as the optimal code for the extraction of morphological parameters of unrelaxed galaxies at high redshifts (Häussler et al. 2007). (Peng et al. 2002). Galfit implements a minimization to decompose the light profile of a source into a (set of) predefined function(s). We selected the Sérsic profile, whose intensity scales with radius as exp. We used two Sérsic components, one with =4 and another with =1, corresponding to a de Vaucouleurs and an exponential disk profile respectively. Galfit convolves both components with the instrumental point-spread function (PSF) before simultaneously fitting them to the observations. We also performed a PSF versus free Sérsic index decomposition as a consistency check. We simulated the required NIC2 PSF with the TinyTim code (Krist & Hook 1997) using a pixel scale identical to that of the observations. To perform the minimization, galfit requires an error image. For this purpose, we provided the final uncertainty image. Galfit also requires initial guesses for the parameters under examination; we used the output parameters of sextractor as input values for the magnitude, the half-light radius, the position angle, and the ellipticity of each source. Finally, we masked out all other bright sources within each image so that galfit can properly compute its background level.
5 Results
5.1 Rest-frame Optical Galaxy Morphologies And Luminosities
The mean and median -band (or rest-frame optical) magnitudes of the sources in our sample are =20.89 and =21.07 with a dispersion of 0.98 in Vega magnitudes (Table 2; Fig. 3). For comparison, one of the brightest ULIRGs in the local Universe, Mrk 1014, would have =20.7 at =2 (Kim et al. 2002). The distribution of the half-light radii is also presented in Figure 3. The mean and median values of the distribution equal 2.66 and 2.43 kpc, respectively, with a standard deviation of 0.80 kpc. The and IRAC(3.6 µm) color distributions (Fig. 3) have mean values of 1.86 and 2.20 and median values of 1.64 and 2.38, respectively. Their standard deviations equal 1.06 and 0.74. The surface-brightness distribution has a mean, median, and standard deviation of 20.33, 20.62, and 1.06 mag arcsec-2 (Table 2). We computed the optical luminosity of each source at the rest-frame wavelength that corresponds to the center of the F160W filter (1.6 µm) by multiplying its flux with the frequency at the center of the filter. We find that the rest-frame optical luminosities range between 1.70 and 9.46 (Table 2). The average and median luminosity values are 1.12 and 7.83 with a wide dispersion that is equal to 0.37 dex when measured on a logarithmic scale. The rest-frame ratios are in the range [4,218]. For the six sources with determined IR luminosities, the ratios range between 50 and 281.
The NIC2 images show that 2 of the 33 sources (MIPS 16059 and MIPS 22530) have two merging components of luminosity ratio 3:1. There are three more systems, MIPS 289, MIPS 8327, and MIPS 15928, with a secondary faint component inside the envelope of their primary nucleus. The faint component could either be another nucleus or a star-forming cluster. Other signs of interactions, such as perturbed morphologies, stellar fans (MIPS 22558), and tidal tails, exist in 12 more sources. MIPS 8196 has a bright tail of 19.3 kpc. In total, 52% of the sources in our sample appear to be involved in interactions.
This fraction is likely to be a lower limit, given observational limitations. Wide binaries that lack prominent signs of interaction or close binaries that are unresolved may exist in our sample. In the case of unresolved systems, their maximum projected nuclear separation is determined by the instrumental angular resolution, which equals 2.1 pixels or 1.34 and 1.28 kpc at redshifts of 1.5 and 2.5, respectively. Such a resolution is comparable to that of ground-based observations that were used to study large numbers of ULIRGs in the local Universe (e.g., Kim et al. 2002; Veilleux et al. 2002), which was 1.8 kpc at z=0.1. Higher angular resolution imaging studies have shown that a small number of local ULIRGs are likely to have two nuclei separated by less than 1.5 kpc (Scoville et al. 1998; 2000; Bushouse et al. 2002; Dasyra et al. 2006b). Flux or surface-brightness detection limitations could also contribute to this effect. For a single orbit, the flux 3 detection limit of our images corresponds to =26.07 for a point source and to =24.51 for an extended source with a radius equal to the average radius of the sources in our sample. This value implies that for a primary nucleus of =22.00, the secondary nucleus needs to have a 2.5 in order to be detected. Such a magnitude difference corresponds to a luminosity ratio of 10:1. Therefore, small companions in mergers of high luminosity ratio could be undetected. Moreover, low surface brightness structures that have been diluted into the sky background could exist. The surface brightness 3 detection limit of our observations is 22.59 mag arcsec-2 for a single orbit. Tidal tails in local ULIRGs have -band surface brightness values between 21.5 mag arcsec-2, e.g., in IRAS 22491-1808 and IRAS 14348-1447, and 23.5 mag arcsec-2, e.g., in UGC 5101 (Surace & Sanders 2000; Surace et al. 2000).
To further investigate the effects of surface brightness dimming on our results, we created a model that simulates =2 galaxies from local templates. The chosen templates, the methodology, and a detailed description of the results can be found in the Appendix. We find that the initial light profile is usually maintained for sources with =19. Extended structures are typically diluted into the continuum for sources with 20. It is therefore likely that a nonnegligible fraction of our sources could have diluted low surface brightness features. Up to half of the flux can be diluted into noise for sources with =21, leading to effective radii that can be underestimated by up to a factor of 2. Since the average and median effective radius of the local ULIRGs in the 1 Jy sample are 4.85 and 4.70 kpc, respectively (Veilleux et al. 2002), the intrinsic radial extents of these z2 ULIRGs are likely to be comparable to those of local ULIRGs.
In all computations we have ignored any possible extinction or -corrections in the rest-frame wavelength range [4200,6200] Å. Taylor et al. (2005), who performed imaging of a sample of 142 late-type and irregular or interacting galaxies, found that their average color is 0.5, corresponding to a 37% difference in the flux of the two bands. This difference in flux does not necessarily correspond to a systematic difference in from the to the band. Often, large color gradients between the center and the outer regions of ULIRGs exist (Surace et al. 1998) because the geometry of the obscuring medium is complex or highly nucleated (Soifer et al. 2002) due to dynamical instabilities. Moreover, accounting and correcting for color differences is not straightforward since the correction can significantly deviate from its average value in individual objects. Spectroscopy of local ULIRGs has shown that the continuum slope in the optical wavelengths varies from source to source because of different AGN-emission strength (Armus et al. 1989; Veilleux et al. 1995; 1999). The broad-band colors of nearby filters may also significantly differ due to bright emission lines within the filter bandpasses.
5.2 Bulge-to-Disk Decomposition Of Bright Sources
We used galfit to find the stellar distribution in 2 ULIRGs. We performed this analysis only for the six systems with 20, because the light profiles of sources with 20 can be diluted in the background, leading to unreliable decomposition results. To infer this reliability limit, we ran galfit for two local disk- and bulge- dominated systems and their simulated z=2 images. This analysis is presented in detail in the Appendix.
The bulge-to-disk decomposition results are presented in Figure 4 and in Table 3. The residual flux of the decomposition, which on average corresponds to 4.44% of the initial galaxy flux, is also presented in Table 3. The decomposition reveals that if bulges indeed exist in the sources that we analyzed, they are small. Among the six sources, four have a possibly unresolved bulge. This means either that the bulge is real but its size is smaller than our resolution element or that it does not exist and galfit identifies a compact nuclear starburst or an AGN as a bulge. The mean bulge-to-disk ratio of these sources is 0.62. The median is 0.55, and it is significantly smaller than that of local single-nucleus ULIRGs, which is 1.51 (Veilleux et al. 2006). The measured bulge-to-disk ratios may be upper limits of their intrinsic values, since the surface brightness dimming typically affects more the disk- than the bulge- dominated light profile distributions (see the Appendix). These results imply that most of these systems had not formed big bulges as of 10 Gyr ago. The exception is MIPS 8196, which is the brightest system in our sample with and a bulge-to-disk ratio 1.
Since a small bulge can be degenerate with a PSF (Simmons & Urry 2008) in decomposition algorithms, we also performed a PSF versus free Sérsic index decomposition to check the consistency of our results. We find that the effective radii of the free-index component agree on average to 8.53% with those computed using SExtractor. We also find that the PSF flux is always fainter than the galaxy flux by more than a factor of 3 (or 1.22 mag), and that in five of the six cases the index is close to unity. This result confirms that the systems are disk-dominated222 We note that disk-like systems at 2 should not necessarily be thought of as spiral galaxies. Disks mostly refer to all smooth or somewhat clumpy light distributions that follow an exponential profile. . However, this analysis needs to be performed on large samples to investigate how frequent or efficient the formation of bulges by ULIRGs is at =2.
A similar bulge-to-disk decomposition was performed by Zheng et al. (2004) on lower redshift (1.2) LIRGs and ULIRGs. Their sources were detected at 15 µm using ISO Camera data in the Canada-France Redshift Survey (Flores et al. 1999). Their sources were observed with the HST Wide Field Planetary Camera 2 in the ,, and bands. Zheng et al. (2004) also find that the six single-nucleus ULIRGs in their sample likewise have small or negligible bulges. Melbourne et al. (2005) performed a morphological analysis of IR-bright sources up to =1 in the Great Observatories Origins Deep Survey (GOODS) 24 µm image (R. R. Chary et al. 2008, in preparation) and found that =1 LIRGs are mostly spirals or peculiar. In the combined GOODS and Galaxy Evolution from Morphology and SED (GEMS) fields, Bell et al. (2005) find that approximately 50% of the sources are spiral galaxies at =0.7.
5.3 Rest-frame Optical vs MIR Galaxy Properties
In Figure 5 we examine the dependence of the rest-frame optical morphological parameters of the sources in our sample on their MIR spectral classification. The optical magnitudes and luminosities are plotted as a function of the effective radii for the sources with well-defined MIR spectral types (see Table 1). Both the magnitudes and the luminosities are statistically indistinguishable for all types of sources. However, the various systems segregate along the effective radius axis. AGN-dominated sources are compact systems with of 2 kpc, whereas PAH-dominated, starburst sources are as extended as 5 kpc. The obscured sources have a large range of effective radii, comprising both compact and extended systems.
In Figure 6 we plot the 7.7 µm PAH feature luminosity, , and equivalent width, EW7.7 (Sajina et al. 2007), as a function of the rest-frame optical effective radius. In this plot, we do not distinguish between sources of different MIR spectral types. We find that high PAH luminosities appear in both compact and extended sources but the lowest values of appear in compact systems. The 7.7 µm equivalent width does not correlate with the optical extent of the system, but the sources with the highest EWs are extended. For compact objects, this result probably reflects the dilution of the PAH features by the AGN continuum, since compact sources have on average a stronger AGN component in both IR and optical wavelengths than most extended systems do (Tran et al. 2001; Veilleux et al. 2002). This result could be a confirmation of a scenario in which ULIRGs with warm MIR/FIR SEDs are more AGN-dominated than ULIRGs with cold MIR/FIR SEDs (Sanders et al. 1988b). Still, compact sources with high PAH luminosity exist.
In Figure 7, we plot the MIR optical depth, , as a function of the rest-frame optical effective radius and luminosity of each source. The value of is derived from the SiO absorption feature at 9.7 µm (Sajina et al. 2007). The spatial distribution of the silicates that are responsible for the MIR obscuration is not correlated with the rest-frame optical stellar light profile. The optical depth of the MIR obscuring medium does not correlate with the stellar luminosity either: obscured systems in the MIR can be bright in the optical wavelengths (e.g., MIPS 8196). This result could imply that the MIR obscuring medium is circumnuclear (Spoon et al. 2007; Sajina et al. 2007).
6 Discussion: Trigger mechanisms of z2 vs local ULIRGs
A qualitative morphological classification of the ULIRGs in our sample indicates that there is a significant fraction of sources that appear to be quiescent or compact. The number of sources that have no prominent signs of interaction is 48%. This fraction is high in comparison with the local ULIRG samples, in which only 2% of the sources are not distorted (Kim et al. 2002; Veilleux et al. 2006). The high fraction of quiescent sources could be attributed to flux or surface brightness limitations of our observations (see §5). However, HST NICMOS, Advanced Camera for Surveys (ACS), and Space Telescope Imaging Spectrograph (STIS) observations of 13 submillimeter galaxies (Chapman et al. 2004; Swinbank et al. 2006) indicate that 80% of these sources have signs of interaction. Although color effects may change this fraction, it is possible that the differences could alternatively be specific to the selection criteria of each sample. Since our objects are brighter than 0.9 mJy at 24 µm, they have warmer MIR/FIR SEDs than submillimeter galaxies (Sajina et al. 2008). According to a scenario in which a warm ULIRG phase follows a cold ULIRG phase in the same evolutionary sequence (Sanders et al. 1988b), our sources appear to be less perturbed than submillimeter galaxies because they could be closer to dynamical relaxation. In this picture, the submillimeter galaxies could be the cold, binary mergers and the 24 µm-selected ULIRGs could be their warm, merged counterparts. This possibility is supported by the findings of Bridge et al. (2007), who showed that the likelihood of a merger to be in a close pair is 5 times higher for sources brighter than 0.1 mJy at 24 µm than for sources below this limit.
To investigate for (dis)similarities in the properties of z2 and local ULIRGs, we compared the number of on-going major mergers333 We note that all comparisons between the local and the z2 ULIRGs presented in this Section are based on the rest-frame optical luminosity ratios of the interacting galaxies. Since this ratio could be affected by extinction, it could deviate from its intrinsic value. Local ULIRGs that appear to be minor mergers in optical images but major mergers in near-IR images and vice versa exist (Kim et al. 2002; Surace et al. 2000). The strength of this effect can vary significantly from source to source, depending on the geometric distribution of its obscuring medium. in our sample and in the entire 1 Jy catalog of mainly local ULIRGs (Kim et al. 2002). Of the 118 sources in the 1 Jy catalog, 40 (or 34%) are binaries with an optical ( to band) luminosity ratio 3:1, or 1.2, and 1.530 kpc444 We chose our fiducial nuclear separation threshold to be 30 kpc since there is only one binary system in the 1 Jy sample with that exceeds this value. (Kim et al. 2002; Surace et al. 2000). In the z2 sample, 2 (or 6%) of the 33 systems (MIPS 16059 and MIPS 22530) are currently interacting binaries with 1.2 and 1.530 kpc. We ran a Monte Carlo code to quantify the significance in the difference of these fractions. We created a parent population of 118000 sources, 40000 of which are binaries that follow the and distribution of the 1 Jy sample binaries. We randomly chose 33 sources and computed the probability that a number of the 33 sources meet the criteria 1.530 kpc and 1.2. We iterated the procedure for times and found that is insignificant (0.014%) for 2. Therefore, our sample statistically differs from the entire 1 Jy sample. Four more sources in our sample (MIPS 464, MIPS 15840, MIPS 15880, and MIPS 22651) have neighbours that satisfy our nuclear separation and luminosity ratio criteria. However, they have no signs of interaction with their neighbours. If we assumed all these sources to be interacting, the maximum fraction of major-merger pairs in our sample would increase to 18%. In that case, the probability would be 3.0%, which is significant but still small.
We then examined whether the sources in our sample are the analogs of the warmest local ULIRGs by comparing the number of on-going major mergers in both our sample and in a local luminosity-matched control sample. We selected the control sample as the 1 Jy catalog sources that have (Kim et al. 2002) for the cosmological parameters adopted in this paper. The local control sample has 16 sources that typically have warm MIR SEDs (e.g., Tran et al. 2001; Armus et al. 2007). Two or 13% of these sources are binaries with 1.2 and 1.530 kpc. This fraction of binary systems is statistically indistinguishable from that in our sample (6% 18%). Therefore, the z2 ULIRGs morphologically resemble their warmest local analogs. However, they differ from their local analogs in their MIR spectral properties. IRS spectroscopy indicates that the majority of the most IR luminous local sources have a strong AGN component in the MIR (L. Armus et al. 2008, in preparation), unlike the 2 sample in which systems with strong starburst-related features exist. One such example is MIPS 22530, which has a MIR spectrum with strong PAH emission and = . We conclude that there is no local ULIRG (sub)sample that is likely to comprise sources with simultaneous compact morphologies, high IR luminosities, and strong starburst-related features, which are characteristic of these 2 ULIRGs.
In the local Universe, minor mergers are associated with LIRGs instead of ULIRGs, although few atypical examples of ULIRGs that are triggered by such mergers exist, e.g., IRAS 12127-1412 (Kim et al. 2002). Up to one-fifth of the ULIRGs in our sample could be associated with on-going minor mergers. Six sources (MIPS 78, MIPS 180, MIPS 8242, MIPS 8342, MIPS 8493, and MIPS 16113) have low surface brightness neighbours within a radius of 10 kpc and could be close interacting binaries. We used galaxy number counts per square degree and magnitude to find the probability of randomly having a faint background or foreground source within a projected distance of 10 kpc or 12 at =2. We constructed a Monte Carlo simulation to randomly distribute galaxies over 1 deg2 and to compute the projected separation of each source from its nearest neighbour. For =150000 galaxies in the range =22.5 to 23.5 (Metcalfe et al. 2006), we found that 5 out of every 100 sources have a neighbour within the given separation due to projection effects. We then selected 33 sources from this parent population and computed the probability that at least six galaxies have neighbours due to projection effects. We iterated the procedure for times and found that the probability is 0.52%, which indicates that some of these sources are likely involved in on-going minor mergers.
In §5, we showed that five of the six brightest sources in our sample have a small Sérsic index () and bulge-to-disk ratio (). Such systems can evolve to disk galaxies with small bulges, unlike local ULIRGs. Regardless of how representative this result is for the majority of =2 ULIRGs, it provides further evidence that the dynamical configuration of IR-bright sources can differ at 2 and in the local Universe.
A plausible explanation regarding why some sources differ from their local analogs is that the 2 systems, being irregular and disky, could have high fractions of gas and dust. Simulations have shown that for high gas fractions, the outcome of a merger is sensitive to the treatment of the interstellar medium and could lead to the formation of rotationally supported remnants (e.g., Robertson et al. 2006). Another scenario is that the strong star-formation episodes occur later in the merger timescales of 2 ULIRGs than those of local ULIRGs due to differences in the dynamical configuration of their progenitors.
7 Conclusions
We acquired Hubble Space Telescope NIC2 images of 33 2 ULIRGs to investigate the dynamical triggers of high-, 24 µm-selected populations, revealed by Spitzer. Having a resolution element of 1.3 kpc at =2, our -band images enable us to perform a comprehensive morphological analysis of these sources. Our findings are summarized as follows.
-
1.
The rest-frame optical luminosities of the sources in our sample are of the order and their mean half-light radius equals 2.66 kpc. On average, this observed value is half of that of local ULIRGs, but surface brightness dimming might account for all or part of this difference.
-
2.
Taking into account binary systems, tidal tails and other irregular morphologies, the number of sources apparently involved in interactions is 17 out of 33. This is a lower limit since unresolved binaries, possible faint companions, or diluted low surface-brightness features (of 22 mag arcsec-2) could exist in our sample. We simulated the effects of surface brightness dimming on our photometric analysis and found that extended structures such as tidal tails can typically be seen in systems as faint as =20. The mean apparent magnitude of the sources in our sample equals =20.89.
-
3.
Up to one-fifth of the sources in our sample could be associated with minor mergers. The number of binary systems with components of comparable luminosity and signs of on-going interaction is only 2. This major-merger pair fraction is significantly smaller than that of the local ULIRG population.
-
4.
We performed a bulge-to-disk decomposition for all the sources that are brighter than =20. We found that these sources are disk-like with small or negligible bulges.
-
5.
The AGN-dominated systems have the most compact and the PAH-dominated systems have the most extended morphology in the rest-frame optical images. The luminosity of the 7.7 µm PAH feature is often, but not always, suppressed in the compact systems. Its EW is high only in extended sources. The MIR obscuration correlates neither with the radial extent nor with the rest-frame optical luminosity of the sources.
We conclude that a nonnegligible fraction of the sources in our sample do not resemble local ULIRGs, which are produced by major mergers and form elliptical galaxies. However, it is unclear whether this result is characteristic of most =2 ULIRGs or whether it relates to our selection criteria. In either case, it provides evidence that several interaction types can be associated with a ULIRG at z2.
Appendix A APPENDIX: Surface Brightness Dimming Simulations
A question that naturally arises during the photometric analysis of intermediate and high sources is what the effects are of surface brightness dimming on the analysis performed. Although this issue has been addressed several times (e.g., Giavalisco et al. 1996; Hibbard & Vacca 1997), the results significantly depend on the type of sources under examination and the setup (e.g., central wavelength) of the observations. We therefore constructed a model to specifically address the following questions: (1) Up to which magnitude can secondary, faint nuclei be observed? (2) How do the observed magnitudes and effective radii relate to their intrinsic values? And (3) at which point does the bulge-to-disk decomposition become unreliable?
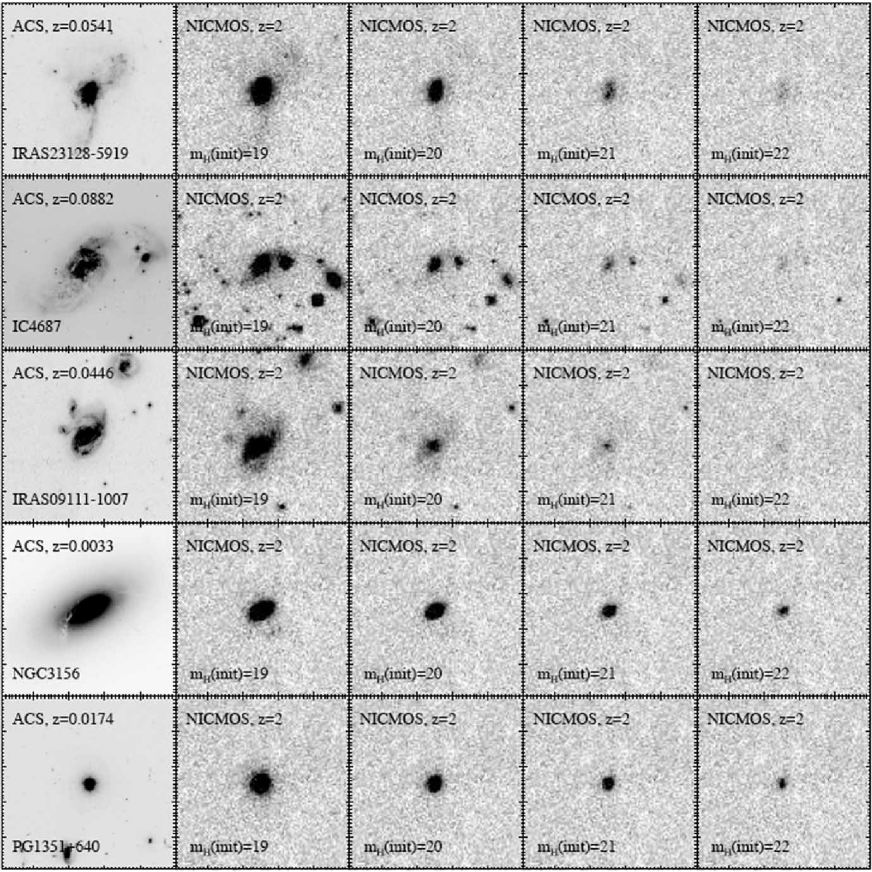
Our surface-brightness-dimming simulations use templates of local galaxies that are shifted to =2. The templates were selected in a manner such that a large number of galaxy types are examined. We used archival data (PIs: A. S. Evans, R. Sharples) of two ULIRGs, one LIRG, one quasar, and one elliptical galaxy in the local Universe observed with ACS. Namely, these sources are IRAS 23128-5919, which is a binary ULIRG separated by 4.3 kpc (Dasyra et al. 2006a), IC 4687, which is a LIRG with a significantly distorted disk, IRAS 09111-1007, which has secondary components, NGC 3156, and PG 1351+640. The sources were observed using either the 435W, the 475W, or the 625W filter, similar to the rest-frame wavelengths of our observations.
To simulate =2 galaxies from local Universe templates, we followed the prescriptions of Giavalisco et al. (1996). First, we scaled down the angular size of the template galaxy. The binning factor was given by
| , | (A1) |
where is the initial redshift of each template, is the final redshift for all templates (which is equal to 2), and is the pixel scale of the instrument used to perform the observations at a given redshift . In our case, the instrumental pixel scales correspond to == and ==. To ensure that the physical size of each source remains the same at all redshifts, its angular size ratio at and needs to be
| , | (A2) |
where is the luminosity distance of a source at redshift .
We then accounted for the surface brightness dimming by multiplying the rescaled images with a dimming factor that was equal to
| . | (A3) |
The factor is the constant that converts counts (or electrons) per second to flux. For the 160W filter of NICMOS, is ergs cm-2 count-1. For ACS 435W, 475W, and 625W, the factor is equal to 3.14, 1.81, and 1.20 ergs cm-2 electron-1, respectively. The quantity is the filter width for the instrument used for the observations at redshift ; it is equal to 4000, 1038, 1458, and 1442 Å for NICMOS 160W, ACS F435W, ACS, F475W, and ACS F625W, respectively. The factor is used to match the intrinsic luminosity of the template with that of a source of a given magnitude at =2. Given the observed magnitudes of our sources, we set the initial value to either 19, 20, 21, or 22 mag.
After convolving the resulting images with the NIC2 PSF, we added background noise to them. For this step, we computed and added to our images the median sky image of all data sets. To imitate the reduction of the real data, we then subtracted from these images the sky background of a random data set. We present the final simulated images in Figure 8. We processed these images with sextractor and galfit in a manner similar to the NICMOS data. The magnitudes and effective radii, as they would be observed following the addition of the sky background, are denoted as and and are presented in Table 4.
Already a visual inspection of the simulation results indicates that sources of =19 preserve to a large extent their initial light profiles. The sources of =20 lose part of their low surface brightness components but still maintain an extended structure. Mergers of equal luminosity systems can be identified all the way up to =21 or an observed magnitude that is . However, faint secondary nuclei are mostly seen up to =20. For sources with 21, one could often be unable to disentangle between minor mergers, single-nucleus remnants of major mergers, or quiescent sources.
To quantify the surface-brightness-dimming effects on the photometric properties of our sources, we ran sextractor for all simulated galaxies. The results are presented in Table 4 and depend on the initial light profile distribution. Compact distributions, such as PSFs and bulge components are more resilient to the surface brightness dimming than extended, disk-like distributions. For instance, we found that a spiral or irregular galaxy of 19 and 20 loses about 27% and 38% of its light, respectively, because of dimming effects. The observed effective radius is smaller by less than 14% and 25%, respectively, than its initial value. At 21, about half of the light is lost, leading to values that are underestimated by a factor of 2. Systems of 22 are typically undetected at 3 levels. In contrast, the light losses are small for an elliptical galaxy. Its flux is decreased by 1% up to 22% and its radius is reduced by 2% up to 17% from its intrinsic values at 19 and 22.
We then aimed to address the reliability of the bulge-to-disk decomposition technique by examining how different its results are when shifting a local source to 2, and when increasing (or decreasing) the brightness of a 2 system by 1 mag. For this purpose, we ran galfit for some local sources and their simulated 2 images, namely, the disk-dominated main component of IC 4687 and the elliptical galaxy NGC 3156. IRAS 23128-5919 and IRAS 09111-1007 are too perturbed to allow a decomposition. Compact light profiles such as those of PG 1351+640 were not analyzed either because they are degenerate between a PSF, and a small, unresolved bulge or disk. Since the light profiles of IC 4687 and NGC 3156 are close to those of a disk and a bulge, we examined the value of their Sérsic index as a function of redshift and integrated magnitude. We find that the 2 images of IC 4687 have 1.05 and 1.06, respectively, for =19 and 20. For comparison, the actual Sérsic index of IC 4687 at a redshift of 0.0173 is 1.20. The 2 images of NGC 3156 have 5.67 and 5.28 for =19 and 20, whereas at 0.004396, NGC 3156 has 6.70. The small differences for the elliptical galaxy are likely related to the spatial dilution of the initial (ACS) PSF with redshift. This comparison shows that the shape of the light profile can be accurately predicted at 2. However, we wish to note that in these simulations, we used different magnitudes but identical initial structural parameters for the 2, =19 and 20 images of each source to properly examine the effects of surface brightness dimming. For observational data there is an extra difficulty; the best galfit solution can significantly depend on the initial parameter values. For the systems of =19, a reasonable input file can be constructed by visual inspection of the images, e.g., by determining the size of the extended structures. For the systems of 20, the surface brightness dimming does not always allow for the determination of an optimal input file. Galfit can then fall into a local (instead of the global) minimum. To avoid degenerate solutions, we opt to apply this decomposition technique only to sources that are brighter than =20.
References
- Alonso-Herrero et al. (2006) Alonso-Herrero, A., Rieke, G. H., Rieke, M, J., Colina, L., Pérez-González, P. G., & Ryder, S. D. 2006, ApJ, 650, 835
- Armus et al. (1989) Armus, L., Heckman, T. M., & Miley, G. K. 1989, ApJ, 347, 727
- Armus et al. (2007) Armus, L, et al. 2007, ApJ, 656, 148
- Barker et al. (2006) Barker, E., et al. 2006, NICMOS Instrument Handbook, Version 9.0
- Barnes (1992) Barnes, J. E. 1992, ApJ, 393, 484
- Bell et al. (2005) Bell, Eric F. et al. 2005, ApJ, 625, 23
- Bertin & Arnouts (1996) Bertin, E., & Arnouts, S. 1996, A&AS, 117, 393
- Brandl et al. (2006) Brandl, B. R. et al. 2006, ApJ, 653, 1129
- Bridge et al. (2007) Bridge, C. R., et al. 2007, ApJ, 659, 931
- Bushouse et al. (2002) Bushouse, H. A., et al. 2002, ApJS, 138, 1
- Chapman et al. (2004) Chapman, S. C., Smail, I., Windhorst, R., Muxlow, T., & Ivison, R. J. 2004, ApJ, 611, 732
- Conselice (2006) Conselice, C. J. 2006, ApJ, 638, 686
- Dasyra et al. (2006a) Dasyra, K. M., et al. 2006a, ApJ, 638, 745
- Dasyra et al. (2006b) Dasyra, K. M., et al. 2006b, ApJ, 651, 835
- Dickinson et al. (2002) Dickinson, M., Sosey, M., Rieke, M., Bohlin, R. C., & Calzetti, D. 2002, hstc, conf, 231
- Djorgovski & Davis (1987) Djorgovski, S., & Davis, M. 1987, ApJ, 313, 59
- Downes & Solomon (1998) Downes, D., & Solomon, P.M. 1998, ApJ, 507, 615
- Dressler et al. (1987) Dressler, A., Lynden-Bell, D., Burstein, D., Davies, R. L., Faber, S. M., Terlevich, R., & Wegner, G. 1987, ApJ, 313, 42
- Elbaz et al. (2002) Elbaz, D., Cesarsky, C. J., Chanial, P., Aussel, H., Franceschini, A., Fadda, D., & Chary, R. R. 2002, A&A, 384, 848
- Fadda et al. (2006) Fadda, D., et al. 2006, AJ, 131, 2859
- Fazio et al. (2004) Fazio, G., et al. 2004, ApJS, 154, 10
- Flores et al. (1999) Flores, H. et al. 1999, ApJ, 517, 148
- Genzel et al. (1998) Genzel, R., et al. 1998, ApJ, 498, 579
- Genzel et al. (2001) Genzel, R., Tacconi, L. J., Rigopoulou, D., Lutz, D., & Tecza, M. 2001, ApJ, 563, 527
- Giavalisco et al. (1996) Giavalisco, M., Livio, M., Bohlin, R. C., Macchetto, F. D., Stecher, T. P. 1996, AJ, 112, 369
- Hammer et al. (2005) Hammer, F., Flores, H., Elbaz, D., Zheng, X. Z., Liang, Y. C., & Cesarsky, C. 2005, A&A, 430, 115
- Häussler et al. (2007) Häussler, B. et al. 2007, ApJS, 172, 615
- Hibbard & Vacca (1997) Hibbard, J. E., & Vacca, W. D. 1997, AJ, 114, 1741
- Houck et al. (2004) Houck, J., et al. 2004, ApJSS, 154, 18
- Ishida (2004) Ishida, C. M. 2004, Ph. D. Thesis, University of Hawaii
- Joseph & Wright (1985) Joseph, R. D., & Wright, G. S. 1985, MNRAS, 214, 87
- Kartaltepe et al. (2007) Kartaltepe, J. S., et al. 2007, ApJ, submitted (arXiv/0705.2266v1)
- Kim et al. (2002) Kim, D.-C., Veilleux, S., & Sanders, D. B. 2002, ApJS, 143, 277
- Kormendy & Sanders (1992) Kormendy, J., Sanders, D. B. 1992, ApJ, 390L, 53
- Krist & Hook (1997) Krist, J. E., & Hook, R. N. 1997, HST Calibration Workshop, Space Telescope Science Institute, S. Casertano eds.
- Lacy et al. (2005) Lacy, M., et al. 2005 ApJS, 161, 41
- Larson & Tinsley (1978) Larson, R. B., & Tinsley, B. M. 1978, ApJ, 219, 46
- Le Floc’h et al. (2005) Le Floc’h, E. et al. 2005, ApJ, 632, 169
- Melbourne et al. (2005) Melbourne, J., Koo, D. C., & Le Floc’h, E. 2005, ApJ, 632, 65L
- Metcalfe et al. (2006) Metcalfe, N., Shanks, T., Weilbacher, P. M., McCracken, H. J., Fong, R., & Thompson, D. 2006, MNRAS, 370, 1257
- Murphy et al. (2001) Murphy, T. W., Jr., Soifer, B. T., Matthews, K., & Armus, L. 2001, ApJ, 559, 201
- Murphy et al. (1996) Murphy, T. W., Jr., Armus, L., Matthews, K., Soifer, B. T., Mazzarella, J. M., Shupe, D. L., Strauss, M. A., & Neugebauer, G. 1996 AJ, 111, 1025
- Peng et al. (2002) Peng, C. Y., Ho, L. C., Impey, C. D., & Rix, H.-W. 2002, AJ, 124, 266
- Pérez-González et al. (2005) Pérez-González, P. G., et al. 2005, ApJ, 630, 82
- Rigopoulou et al. (1999) Rigopoulou, D., Spoon, H. W. W., Genzel, R., Lutz, D., Moorwood, A. F. M., & Tran, Q. D. 1999, AJ, 118, 2625
- Robertson et al. (2006) Robertson, B., Bullock, J. S., Cox, T. J., Di Matteo, T., Hernquist, L., Springel, V., & Yoshida, N. 2006 ApJ, 645, 986
- Sajina et al. (2007) Sajina, A., Yan, L., Armus, L., Choi, P., Fadda, D., Helou, G., & Spoon, H. 2007, ApJ, 664, 713
- Sajina et al. (2008) Sajina, A., et al. 2008, ApJ, submitted
- Sanders et al. (1988a) Sanders, D. B., Soifer, B. T., Elias, J. H., Madore, B. F., Matthews, K., Neugebauer, G., & Scoville, N. Z. 1988a, ApJ, 325, 74
- Sanders et al. (1988b) Sanders, D. B., Soifer, B. T., Elias, J. H., Neugebauer, G., & Matthews, K. 1988b, ApJ, 328, 35L
- Scoville et al. (1998) Scoville, N. Z., et al. 1998, ApJ, 492, L107
- Scoville et al. (2000) Scoville, N. Z., et al. 2000, AJ, 119, 991
- Simmons & Urry (2008) Simmons, B. D., & Urry, C. M. 2008, ApJ, submitted, (arXiv:0804.1363v1)
- Soifer et al. (2002) Soifer, B. T., Neugebauer, G., Matthews, K., Egami, E., & Weinberger, A. J. 2002, AJ, 124, 2980
- Spoon et al. (2007) Spoon, H. W. W., Marshall, J. A., Houck, J. R., Elitzur, M., Hao, L., Armus, L., Brandl, B. R., & Charmandaris, V. 2007, ApJ, 654, 49L
- Springel et al. (2005) Springel, V., Di Matteo, T., & Hernquist, L. 2005 ApJ, 620, L79
- Springel & Hernquist (2005) Springel, V., & Hernquist, L. 2005 ApJ, 622, L9
- Surace et al. (1998) Surace, Jason A., Sanders, D. B., Vacca, W. D., Veilleux, S, & Mazzarella, J. M. 1998, ApJ, 492, 116
- Surace & Sanders (2000) Surace, J. A., & Sanders, D. B. 2000, AJ, 120, 604
- Surace et al. (2000) Surace, J. A., Sanders, D. B., & Evans, A. S. 2000, ApJ, 529, 170
- Swinbank et al. (2006) Swinbank, A. M., Chapman, S. C., Smail, I., Lindner, C., Borys, C., Blain, A. W., Ivison, R. J., & Lewis, G. F. 2006, MNRAS, 371, 465
- Tacconi et al. (2002) Tacconi, L. J., Genzel, R., Lutz, D., Rigopoulou, D., Baker, A. J., Iserlohe, C., & Tecza, M. 2002, ApJ, 580, 73
- Tacconi et al. (2006) Tacconi, L. J. et al. 2006, ApJ, 640, 228
- Taylor et al. (2005) Taylor, V. A., Jansen, R. A., Windhorst, R. A., Odewahn, S. C., & Hibbard, J. E. 2005, ApJ, 630, 784
- Tran et al. (2001) Tran, Q. D., et al. 2001, ApJ, 552, 527
- Veilleux et al. (1995) Veilleux, S., Kim, D.-C., Sanders, D. B., Mazzarella, J. M., & Soifer, B. T. 1995, ApJS, 98, 171
- Veilleux et al. (1999) Veilleux, S., Kim, D.-C., & Sanders, D. B. 1999, ApJ, 522, 113
- Veilleux et al. (2002) Veilleux, S., Kim, D.-C., & Sanders, D. B. 2002, ApJS, 143, 315
- Veilleux et al. (2006) Veilleux, S., et al. 2006, ApJ, 643, 707
- Yan et al. (2004) Yan, L., et al. 2004, ApJS, 154, 75
- Yan et al. (2005) Yan, L., et al. 2005, ApJ, 628, 604
- Yan et al. (2007) Yan, L., et al. 2007, ApJ, 658, 778
- Zheng et al. (2004) Zheng, X. Z., Hammer, F., Flores, H., Assémat, F., & Pelat, D. 2004, A&A, 421, 847
| Galaxy | RA aaUnits of right ascension are hours, minutes and seconds, and units of declination are degrees, arcminutes, and arcseconds. The coordinates of the sources are those of the IRAC 3.6 µm catalog of Lacy et al. (2005). | Dec aaUnits of right ascension are hours, minutes and seconds, and units of declination are degrees, arcminutes, and arcseconds. The coordinates of the sources are those of the IRAC 3.6 µm catalog of Lacy et al. (2005). | bbThe redshifts and the MIR spectra used for the type classifications are from Sajina et al. (2007). The spectral type nomenclature adopted here simply denotes the dominant component of the MIR spectrum, namely the AGN continuum, the PAH emission features, or the SiO absorption feature at 9.7 µm. If the dominant component is not obvious, we simply describe it as a mixed system. | log(/ ) ccThe IR and 14 µm luminosities are from Sajina et al. (2008) and Sajina et al. (2007) respectively. The 14 µm luminosity can be considered a lower limit of when the latter is not available. | log( / ) ccThe IR and 14 µm luminosities are from Sajina et al. (2008) and Sajina et al. (2007) respectively. The 14 µm luminosity can be considered a lower limit of when the latter is not available. | MIR bbThe redshifts and the MIR spectra used for the type classifications are from Sajina et al. (2007). The spectral type nomenclature adopted here simply denotes the dominant component of the MIR spectrum, namely the AGN continuum, the PAH emission features, or the SiO absorption feature at 9.7 µm. If the dominant component is not obvious, we simply describe it as a mixed system. | tint ddTotal integration time of the NIC2 exposures. | eeRest-frame wavelength range of the observations performed with the NIC2 camera and the F160W filter. |
|---|---|---|---|---|---|---|---|---|
| (2000) | (2000) | type | (s) | ( Å) | ||||
| MIPS42 | 17:17:58.54 | +59:28:16.18 | 1.95 | 12.68 | obscured | 5120 | 47506100 | |
| MIPS78 | 17:15:38.18 | +59:25:40.08 | 2.65 | 12.76 | mixed | 5248 | 38404930 | |
| MIPS180 | 17:15:43.73 | +58:35:32.97 | 2.47 | 12.57 | obscured | 5248 | 40405190 | |
| MIPS227 | 17:14:55.99 | +58:38:16.44 | 1.87 | 12.39 | mixed | 2560 | 48806270 | |
| MIPS289 | 17:13:50.04 | +58:56:54.45 | 1.86 | 11.80 | 12.9 | PAH | 2560 | 49006300 |
| MIPS464 | 17:14:39.60 | +58:56:32.07 | 1.85 | 12.16 | mixed | 5120 | 49106320 | |
| MIPS506 | 17:11:38.52 | +58:38:38.58 | 2.52 | 12.74 | mixed | 2560 | 39805110 | |
| MIPS8196 | 17:15:10.17 | +60:09:54.54 | 2.60 | 12.53 | obscured | 2688 | 38905000 | |
| MIPS8242 | 17:14:33.19 | +59:39:11.31 | 2.45 | 12.74 | mixed | 2560 | 40605220 | |
| MIPS8245 | 17:15:36.31 | +59:36:14.73 | 2.70 | 12.55 | mixed | 5248 | 37804870 | |
| MIPS8327 | 17:15:35.62 | +60:28:24.49 | 2.48 | 12.40 | mixed | 5248 | 40205170 | |
| MIPS8342 | 17:14:11.45 | +60:11:09.20 | 1.57 | 11.93 | 12.7 | AGN | 2688 | 54507000 |
| MIPS8493 | 17:18:04.99 | +60:08:32.28 | 1.80 | 11.49 | PAH | 2688 | 50006430 | |
| MIPS15840 | 17:19:22.44 | +60:05:00.42 | 2.30 | 12.50 | AGN | 5248 | 42405450 | |
| MIPS15880 | 17:21:19.61 | +59:58:17.87 | 1.64 | 12.51 | 12.9 | obscured | 2560 | 53106820 |
| MIPS15928 | 17:19:17.47 | +60:15:19.62 | 1.52 | 12.04 | mixed | 2688 | 55607140 | |
| MIPS15949 | 17:21:09.21 | +60:15:01.66 | 2.15 | 12.45 | AGN | 2688 | 44405710 | |
| MIPS15958 | 17:23:24.21 | +59:24:55.62 | 1.97 | 12.28 | mixed | 2560 | 47106060 | |
| MIPS15977 | 17:18:55.66 | +59:45:45.61 | 1.85 | 12.28 | 13.0 | AGN | 2560 | 49106320 |
| MIPS16059 | 17:24:28.34 | +60:15:33.08 | 2.43 | 12.46 | mixed | 5376 | 40805250 | |
| MIPS16080 | 17:18:44.83 | +60:01:15.82 | 2.04 | 12.18 | obscured | 2688 | 46105920 | |
| MIPS16095 | 17:23:59.77 | +59:57:52.42 | 1.81 | 12.12 | mixed | 5120 | 49806410 | |
| MIPS16113 | 17:21:26.47 | +60:16:46.27 | 1.90 | 11.88 | obscured | 2688 | 48306210 | |
| MIPS16122 | 17:20:51.50 | +60:01:48.75 | 1.97 | 12.13 | mixed | 5376 | 47106060 | |
| MIPS16144 | 17:24:22.03 | +59:31:50.63 | 2.13 | 12.01 | PAH | 2560 | 44705750 | |
| MIPS22204 | 17:18:44.40 | +59:20:00.96 | 2.08 | 12.63 | obscured | 2560 | 45505850 | |
| MIPS22277 | 17:18:26.73 | +58:42:42.12 | 1.77 | 12.36 | mixed | 2560 | 50506500 | |
| MIPS22303 | 17:18:48.87 | +58:51:14.87 | 2.34 | 12.57 | obscured | 5248 | 41905390 | |
| MIPS22530 | 17:23:03.31 | +59:16:00.55 | 1.96 | 12.10 | 13.0 | PAH | 2560 | 47306080 |
| MIPS22558 | 17:20:45.15 | +58:52:21.50 | 3.20 | 12.88 | AGN | 5248 | 33304290 | |
| MIPS22651 | 17:19:26.54 | +59:09:29.12 | 1.73 | 11.86 | 12.9 | mixed | 2560 | 51306590 |
| MIPS22661 | 17:18:19.63 | +59:02:42.68 | 1.75 | 11.93 | AGN | 5248 | 50906550 | |
| MIPS22699 | 17:20:47.52 | +59:08:14.71 | 2.59 | 12.17 | mixed | 5248 | 38905010 |
| Galaxy | aaThe -band (or restframe optical) apparent and absolute magnitudes, half-light radii, and surface brightnesses were derived using Sextractor, which models the galaxies as series of isophotal ellipses. For the spatially overlapping binary systems, these numbers are computed for the system as a whole. No spectroscopic -corrections have been applied to these quantities. | aaThe -band (or restframe optical) apparent and absolute magnitudes, half-light radii, and surface brightnesses were derived using Sextractor, which models the galaxies as series of isophotal ellipses. For the spatially overlapping binary systems, these numbers are computed for the system as a whole. No spectroscopic -corrections have been applied to these quantities. | aaThe -band (or restframe optical) apparent and absolute magnitudes, half-light radii, and surface brightnesses were derived using Sextractor, which models the galaxies as series of isophotal ellipses. For the spatially overlapping binary systems, these numbers are computed for the system as a whole. No spectroscopic -corrections have been applied to these quantities. | aaThe -band (or restframe optical) apparent and absolute magnitudes, half-light radii, and surface brightnesses were derived using Sextractor, which models the galaxies as series of isophotal ellipses. For the spatially overlapping binary systems, these numbers are computed for the system as a whole. No spectroscopic -corrections have been applied to these quantities. | (opt) aaThe -band (or restframe optical) apparent and absolute magnitudes, half-light radii, and surface brightnesses were derived using Sextractor, which models the galaxies as series of isophotal ellipses. For the spatially overlapping binary systems, these numbers are computed for the system as a whole. No spectroscopic -corrections have been applied to these quantities. | interaction |
|---|---|---|---|---|---|---|
| (mag arcsec-2) | (kpc) | ( ) | signs | |||
| MIPS42 | 21.79 | -24.10 | 21.29 | 2.66 | 2.68 | none |
| MIPS78 | 21.98 | -24.72 | 21.95 | 3.13 | 4.72 | nonebbIn these systems the nucleus does not seem distorted, but secondary low surface-brightness sources exist within a projected separation of 10 kpc. Although these systems may be dynamically related, no prominent indication of interaction between them can be seen at our surface-brightness limits. |
| MIPS180 | 22.15 | -24.37 | 20.85 | 1.77 | 3.41 | nonebbIn these systems the nucleus does not seem distorted, but secondary low surface-brightness sources exist within a projected separation of 10 kpc. Although these systems may be dynamically related, no prominent indication of interaction between them can be seen at our surface-brightness limits. |
| MIPS227 | 18.85 | -26.93 | 18.32 | 2.63 | 3.62 | none |
| MIPS289 | 19.72 | -26.04 | 20.01 | 3.84 | 1.60 | distortedccIn these cases, the bright nucleus has a faint component in the same envelope that could either be a secondary nucleus or a bright star-formation knot. |
| MIPS464 | 21.45 | -24.30 | 20.62 | 2.29 | 3.19 | distortedddBright sources of 1.2 exist close to these sources but there are no signs of interaction between them. |
| MIPS506 | 21.66 | -24.91 | 20.60 | 1.97 | 5.60 | distorted |
| MIPS8196 | 18.68 | -27.97 | 18.76 | 3.31 | 9.46 | distorted |
| MIPS8242 | 20.21 | -26.28 | 20.85 | 4.34 | 1.99 | distortedeeSecondary, low surface-brightness structures exist around the distorted nucleus of these systems. |
| MIPS8245 | 22.21 | -24.54 | 21.17 | 1.96 | 3.98 | none |
| MIPS8327 | 21.06 | -25.47 | 20.09 | 2.07 | 9.35 | distortedccIn these cases, the bright nucleus has a faint component in the same envelope that could either be a secondary nucleus or a bright star-formation knot. |
| MIPS8342 | 21.54 | -23.77 | 20.68 | 2.28 | 1.96 | nonebbIn these systems the nucleus does not seem distorted, but secondary low surface-brightness sources exist within a projected separation of 10 kpc. Although these systems may be dynamically related, no prominent indication of interaction between them can be seen at our surface-brightness limits. |
| MIPS8493 | 21.23 | -24.45 | 21.18 | 3.29 | 3.68 | distortedeeSecondary, low surface-brightness structures exist around the distorted nucleus of these systems. |
| MIPS15840 | 21.67 | -24.66 | 20.96 | 2.36 | 4.44 | noneddBright sources of 1.2 exist close to these sources but there are no signs of interaction between them. |
| MIPS15880 | 21.26 | -24.17 | 21.74 | 4.22 | 2.83 | distortedddBright sources of 1.2 exist close to these sources but there are no signs of interaction between them. |
| MIPS15928 | 19.65 | -25.57 | 19.31 | 2.88 | 1.04 | distortedccIn these cases, the bright nucleus has a faint component in the same envelope that could either be a secondary nucleus or a bright star-formation knot. |
| MIPS15949 | 20.73 | -25.42 | 20.00 | 2.36 | 9.00 | none |
| MIPS15958 | 21.09 | -24.83 | 19.25 | 1.43 | 5.19 | none |
| MIPS15977 | 19.83 | -25.92 | 19.05 | 2.35 | 1.42 | distorted |
| MIPS16059 | 20.49 | -25.98 | 20.19 | 2.82 | 1.51 | binary |
| MIPS16080 | 20.31 | -25.70 | 19.62 | 2.43 | 1.16 | distorted |
| MIPS16095 | 19.96 | -25.73 | 18.93 | 2.09 | 1.20 | none |
| MIPS16113 | 21.40 | -24.42 | 20.94 | 2.71 | 3.58 | distortedeeSecondary, low surface-brightness structures exist around the distorted nucleus of these systems. |
| MIPS16122 | 21.36 | -24.56 | 21.14 | 3.03 | 4.08 | distorted |
| MIPS16144 | 20.85 | -25.27 | 20.80 | 3.24 | 7.83 | distortedeeSecondary, low surface-brightness structures exist around the distorted nucleus of these systems. |
| MIPS22204 | 20.17 | -25.89 | 18.50 | 1.53 | 1.39 | none |
| MIPS22277 | 20.08 | -25.55 | 19.10 | 2.15 | 1.01 | nonebbIn these systems the nucleus does not seem distorted, but secondary low surface-brightness sources exist within a projected separation of 10 kpc. Although these systems may be dynamically related, no prominent indication of interaction between them can be seen at our surface-brightness limits. |
| MIPS22303 | 22.76 | -23.61 | 22.13 | 2.44 | 1.70 | none |
| MIPS22530 | 21.07 | -24.83 | 21.88 | 4.87 | 5.25 | binary |
| MIPS22558 | 21.62 | -25.58 | 21.39 | 2.71 | 1.03 | distorted |
| MIPS22651 | 20.11 | -25.46 | 19.32 | 2.35 | 9.35 | noneddBright sources of 1.2 exist close to these sources but there are no signs of interaction between them. |
| MIPS22661 | 20.22 | -25.38 | 19.48 | 2.40 | 8.65 | none |
| MIPS22699 | 22.19 | -24.45 | 20.88 | 1.75 | 3.67 | none |
| Galaxy | (bulge) aaThe best-fit solutions for the bulge and the disk magnitudes and half-light radii were derived using galfit. For an exponential disk, the half-light radius is related to the scale length as = . | (bulge) aaThe best-fit solutions for the bulge and the disk magnitudes and half-light radii were derived using galfit. For an exponential disk, the half-light radius is related to the scale length as = . | (disk) aaThe best-fit solutions for the bulge and the disk magnitudes and half-light radii were derived using galfit. For an exponential disk, the half-light radius is related to the scale length as = . | (disk) aaThe best-fit solutions for the bulge and the disk magnitudes and half-light radii were derived using galfit. For an exponential disk, the half-light radius is related to the scale length as = . | bulge-to-disk | residualsbbThe residuals are given as a percentage fraction of the initial flux. | ccFor comparison with the bulge-to-disk decomposition results, we also perform a free Sérsic index versus PSF decomposition. We provide the value of and the magnitude of the Sérsic component, as well as the PSF magnitude. | () ccFor comparison with the bulge-to-disk decomposition results, we also perform a free Sérsic index versus PSF decomposition. We provide the value of and the magnitude of the Sérsic component, as well as the PSF magnitude. | () | (PSF) ccFor comparison with the bulge-to-disk decomposition results, we also perform a free Sérsic index versus PSF decomposition. We provide the value of and the magnitude of the Sérsic component, as well as the PSF magnitude. |
|---|---|---|---|---|---|---|---|---|---|---|
| (kpc) | (kpc) | ratio | % | (kpc) | ||||||
| MIPS227 | 19.90 | 2.37 | 19.30 | 1.98 | 0.57 | 6.25 | 1.23 | 18.83 | 2.35 | 21.97 |
| MIPS289 | 20.89 | 1.25 | 20.14 | 5.76 | 0.50 | 3.51 | 0.60 | 20.07 | 3.66 | 21.91 |
| MIPS8196 | 19.15 | 2.06 | 19.64 | 4.36 | 1.57 | 0.97 | 2.65 | 18.64 | 3.10 | 22.14 |
| MIPS15928 | 22.60 | 1.20 | 19.78 | 2.64 | 0.07 | 14.2 | 0.67 | 19.85 | 2.57 | 21.49 |
| MIPS15977 | 20.86 | 1.13 | 20.21 | 2.01 | 0.55 | 1.00 | 0.54 | 20.09 | 2.08 | 21.31 |
| MIPS16095 | 21.15 | 1.38 | 20.36 | 2.03 | 0.48 | 0.72 | 1.35 | 20.41 | 1.94 | 23.31 |
| Galaxy | (init) aaMagnitude and effective radius of each redshifted source prior to the addition of the sky background. | (init) aaMagnitude and effective radius of each redshifted source prior to the addition of the sky background. | (obs) bbMagnitude and effective radius of each redshifted source as measured after the addition of an appropriate sky background. All quantities are measured with sextractor, as for the NICMOS observations. | (obs) bbMagnitude and effective radius of each redshifted source as measured after the addition of an appropriate sky background. All quantities are measured with sextractor, as for the NICMOS observations. | ||
|---|---|---|---|---|---|---|
| template | (mag arcsec-2) | (kpc) | (mag arcsec-2) | (kpc) | ||
| IC 4687 | 19.00 | 20.61 | 7.01 | 19.37 | 20.65 | 6.03 |
| IC 4687 | 20.00 | 21.61 | 7.01 | 20.51 | 21.49 | 5.24 |
| IC 4687 | 21.00 | 22.62 | 7.01 | 21.84 | 21.90 | 3.43 |
| IC 4687ccThese sources cannot be detected at 3 levels. | 22.00 | 23.62 | 7.01 | |||
| IRAS 09111-1007 | 19.00 | 20.37 | 6.29 | 19.31 | 20.45 | 5.65 |
| IRAS 09111-1007 | 20.00 | 21.37 | 6.29 | 20.53 | 21.30 | 4.77 |
| IRAS 09111-1007 | 21.00 | 22.37 | 6.29 | 21.74 | 22.13 | 4.00 |
| IRAS 09111-1007ccThese sources cannot be detected at 3 levels. | 22.00 | 23.37 | 6.29 | |||
| IRAS 23128-5919 | 19.00 | 19.70 | 4.62 | 19.20 | 19.63 | 4.06 |
| IRAS 23128-5919 | 20.00 | 20.70 | 4.62 | 20.44 | 20.36 | 3.22 |
| IRAS 23128-5919 | 21.00 | 21.70 | 4.62 | 21.60 | 21.30 | 2.91 |
| IRAS 23128-5919 | 22.00 | 22.70 | 4.62 | |||
| NGC 3156 | 19.00 | 17.88 | 1.99 | 19.06 | 17.82 | 1.89 |
| NGC 3156 | 20.00 | 18.88 | 1.99 | 20.10 | 18.78 | 1.82 |
| NGC 3156 | 21.00 | 19.88 | 1.99 | 21.17 | 19.74 | 1.73 |
| NGC 3156 | 22.00 | 20.88 | 1.99 | 22.26 | 20.74 | 1.66 |
| PG 1351+640 | 19.00 | 17.65 | 1.79 | 19.12 | 17.62 | 1.67 |
| PG 1351+640 | 20.00 | 18.65 | 1.79 | 20.17 | 18.56 | 1.59 |
| PG 1351+640 | 21.00 | 19.65 | 1.79 | 21.21 | 19.50 | 1.52 |
| PG 1351+640 | 22.00 | 20.65 | 1.79 | 22.25 | 20.45 | 1.50 |

![[Uncaptioned image]](/html/0802.1050/assets/x3.png)
Fig. 2– continued.
![[Uncaptioned image]](/html/0802.1050/assets/x4.png)
Fig. 2– continued.