A New Red Giant-based Distance Modulus of Mpc to the Antennae Galaxies and its Consequences11affiliation: Based on observations with the NASA/ESA Hubble Space Telescope, obtained at the Space Telescope Science Institute, which is operated by the Association of Universities for Research in Astronomy, Inc., (AURA), under NASA Contract NAS 5-26555.
Abstract
The Antennae galaxies are the closest example of an ongoing major galaxy merger, and thereby represent a unique laboratory for furthering the understanding of the formation of exotic objects (e.g., tidal dwarf galaxies, ultra-luminous X-ray sources, super-stellar clusters, etc). In a previous paper HST/WFPC2 observations were used to demonstrate that the Antennae system might be at a distance considerably less than that conventionally assumed in the literature. Here we report new, much deeper HST/ACS imaging that resolves the composite stellar populations, and most importantly, reveals a well-defined red giant branch. The tip of this red giant branch (TRGB) is unambiguously detected at mag. Adopting the most recent calibration of the luminosity of the TRGB then yields a distance modulus for the Antennae of corresponding to a distance of Mpc. This is consistent with our earlier result, once the different calibrations for the standard candle are considered. We briefly discuss the implications of this now well determined shorter distance.
Subject headings:
galaxies: distances and redshifts – galaxies: individual (NGC 4038, NGC 4039) – galaxies: interactions – galaxies: peculiar – galaxies: stellar content1. Introduction
The importance of having an accurate distance to the Antennae galaxies (NGC 4038/4039) cannot be overstated. These galaxies are the nearest major merger to the Milky Way, and as such, are taken as the archetypal merger system. The proximity makes the Antennae of paramount importance for studying mergers as a model for hierarchical galaxy formation, as well as providing an ideal setting to explore the physical processes in starforming galaxies. For example, the very idea of the formation of exotic objects (e.g., ultra-luminous X-ray sources, super-stellar clusters) in mergers owes much to studies of the Antennae. Indeed there exists a huge amount of data collected over the years, from ground and space missions, which might be precisely calibrated if an accurate distance to the system were available. Recent examples include: GALEX observations (Hibbard et al. 2005), near-IR WIRC imaging (Brandl et al. 2005); Chandra ACIS-S (Baldi et al. 2006); STIS data (Whitmore et al. 1995); VLT/ISAAC data (Mengel et al. 2005); and VLT/VIMOS data (Bastian et al. 2006). We also note the recent Type Ic supernova in the Antennae (SN 2004gt, IAUC 8456; Gal-Yam et al. 2005; Maund et al. 2005), but the nature of its progenitor remains a subject of debate in part due to the unresolved issue of the distance. Indeed, all basic physical quantities that enter the models (linear distances, masses, and luminosities), and hence the model predictions, depend on the adopted distance.
The most widely quoted distance to the Antennae is Mpc, based on the recession velocity of the system corrected with the flow model of Tonry et al. (2000). However values up to 30 Mpc are sometimes quoted (e.g., Fabbiano et al. 2001, Zezas & Fabbiano 2002). On the other hand, significantly shorter distance measurements were provided in Rubin et al. (1970) and Saviane, Hibbard, & Rich (2004; hereafter SHR04). The first of the two studies suggested a distance between and Mpc. The large distance uncertainty is due to the relatively low precision of their adopted distance indicators (the size of H II regions, the brightest stars, and the 1921 supernova), as well as to an unknown contribution from internal absorption. Yet they were the first to suggest a distance shorter than that predicted by the redshift.
The second study offered a much more accurate measurement of the distance to the Antennae system based on a standard candle. SHR04 used HST/WFPC2 images to investigate the stellar populations of the candidate tidal dwarf galaxy that lies at and beyond the tip of the southern tidal tail (cf. Schweizer 1978, Mirabel, Dottori, & Lutz 1992). The SHR04 color-magnitude diagram (CMD) revealed an apparently spatially extended population of old (age 2 Gyr) red giants, underlying the more concentrated star-forming regions. The detection of such a red giant branch (RGB) population was unexpected, since for an assumed distance of at least 19-20 Mpc, such a population would be fainter than , beyond the detection limit of the SHR04 photometry. Given that all other possible interpretations of this faint red stellar population were unsatisfactory, SHR04 assumed that the tip of the RGB (TRGB) had indeed been reached. Stellar populations older than – Gyr develop a well populated red giant branch. The luminosity of the brightest red giants is limited by the ignition of helium in the core, under degenerate conditions, the so-called helium flash. This luminosity corresponds to and is known as the red giant branch tip. With , and assuming an absolute luminosity of (Carretta et al. 2000), a distance to the Antennae of 13.8 Mpc follows, a value significantly smaller than those previously assumed. Admittedly, in SHR04 the TRGB was detected near the completeness limit of the imaging, where large errors and crowding affect the precision of the photometry. It is therefore reasonable to require confirmation of this shorter distance before it is universally accepted.
Such confirmation was the motivation for the new HST/ACS observations presented in this paper, which reach significantly fainter magnitudes than the WFPC2 data. We use this ACS photometry to derive a firm distance for the Antennae, finding a value consistent with that given in SHR04.
2. Observations and reductions
ACS/WFC observations of the NGC 4038 southern tidal tail (GO 10580,
P.I. Saviane) were obtained on December 30, 2005, and January 3 and
4, 2006; they were centered at
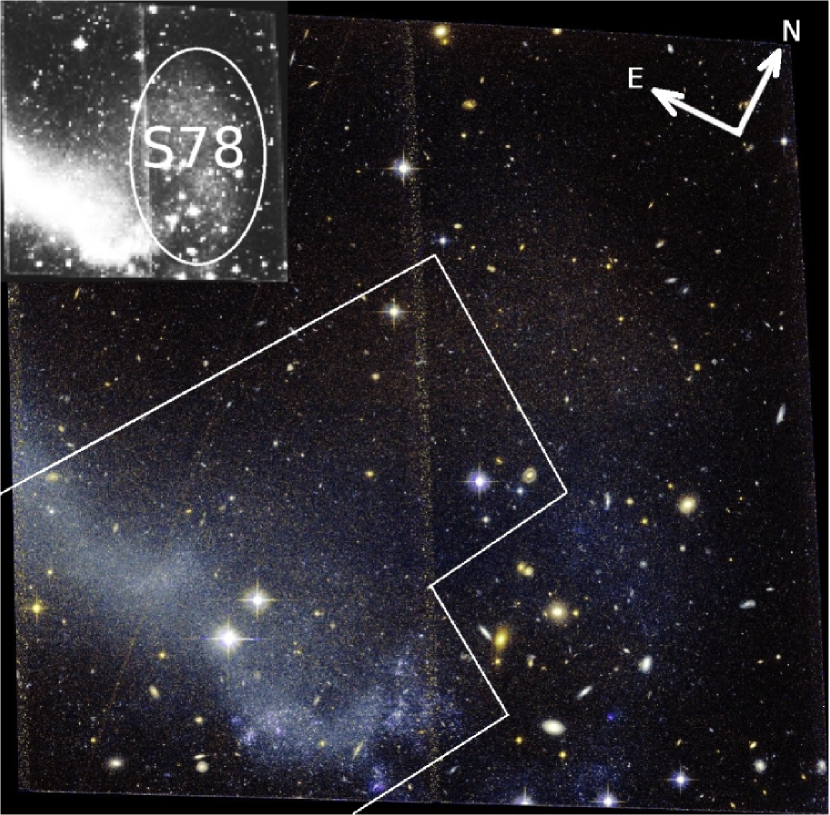
()=(::::) (see
Fig. 1). Of the 7 awarded orbits, 4 were dedicated
to deep observations through the and 3 through the
filters, for a total integration time of 10870 s and 8136 s, respectively.
No cosmic ray split was applied, but the 7 deep exposures were dithered
properly so that the frames, when combined via the drizzle process,
filled the inter-chip gap and allowed removal of the cosmic-ray contamination.
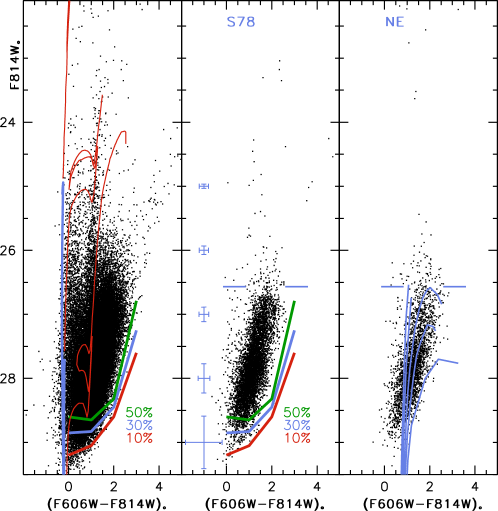
The photometric reduction of the final and images was performed with the Daophot/Allstar package (Stetson 1987, 1994). The calibration to the ACS VEGAMAG system was done following the recipes described in Sirianni et al. (2005; hereafter S05) and Bedin et al. (2005; hereafter B05). The instrumental magnitudes were transformed both to the HST VEGAMAG system, and to the Johnson-Cousins system. Magnitudes in the VEGAMAG system were obtained by adding the zero-points as listed in B05, and these were dereddened assuming: (i) (see next section); and (ii) the extinction ratios listed in Table 14 of S05, for a star of spectral type G2. For the stars in common with the WFPC2 imaging, we found a 3 clipped mean difference with the ACS VEGAMAG magnitudes of mag. No dependence on magnitude for was found. This confirms the excellent consistency of the two scales. To determine the photometric errors and completeness of the ACS data, we introduced artificial stars into the original drizzled images, and reduced and calibrated the frames exactly as was done for the original images (see Momany et al. 2005 for a detailed description and example of this process). The CMD of stars for the whole ACS field-of-view is shown in the left panel of Fig. 2. The dependence of completeness on stellar color is summarized by the plotted iso-completeness lines: we can be confident that in the color range of the RGB all stars are measured, while only approximately half of any extremely red stars, if they exist, would be recovered. Nevertheless by looking at the middle and right panels of Fig. 2, which are for the areas outside the regions of active star formation, one can conclude that very few stars with colors exist at magnitudes comparable to the RGB tip. These would be carbon stars along the asymptotic giant branch (see e.g., Fig. 6 in Stetson et al. 1998).
3. Foreground and internal reddening
In SHR04 the apparent luminosity of the TRGB was computed by considering only stars located far from star-forming regions. A few triangular areas were picked from PC, WF3, and WF4 chips, with the dominant sample coming from the southern portion of WF4 (see Fig. 2 in that paper). The WF2 area was excluded since it is within the H I isodensity contours, while the WF4 portion is just outside the southernmost contour, which marks a value of cm-2 (Fig. 9 in SHR04). Assuming that internal extinction is negligible in the low gas density areas, in SHR04 the tip luminosity was then corrected only for the foreground extinction.
In the case of our new ACS data, we expect that the internal extinction is negligible for stars located in the north-eastern quadrant of the ACS field: Fig. 6 of Hibbard et al. (2001) shows that the H I density is below the detection limit in that area. The apparent luminosity of the TRGB was then measured using stars located in that area, which is also far from SF regions, hence yielding a nearly reddening-free measurement of the TRGB. On the other hand, the low stellar density implies a relatively large uncertainty on the tip position. As a further check, we then repeated the tip detection using stars in the region with the highest stellar density, which is that coincident with the S78 object (cf. inset in Fig. 1). Although this population allows the clearest detection of the TRGB, at the same time it is affected by high extinction due to the high gas and dust density ( cm-2), so for a proper consistency check, we need to estimate the reddening in the S78 region.
Using the technique explained below, we found that in the dense regions the observed magnitude of the tip is indeed mag fainter in the F814W band. From S05 we get for a G2 spectral energy distribution, so we conclude that the internal reddening in the S78 region is . This is roughly consistent with what we expect based on the gas and dust column density. The study of Lockman & Condon (2005) finds , with two possible solutions: mag and mag cm2, or mag and mag cm2. Inserting the H I density of the S78 region in the equations, these yield a reddening comprised between and . When compared to the value estimated above, these reddenings suggest that to of the gas and dust could be in front of the stars. If instead we use the calibration of Bohlin et al. (1978), then the reddening is mag cm2, which gives , or of the gas and dust in front of the stars. The foreground reddening to the Antennae is (Schlegel et al. 1998), so the total reddening in the S78 region is then . Note that the color of the RGB in the higher reddening area is not significantly different from that in the lower reddening area. This is because the expected shift to redder colors (by ca. mag) is counter balanced by the shift to the blue due to field crowding (the full results of the artificial-star experiments will be discussed in the main article dealing with the SFH of the tidal feature).
The reddening is also used to calibrate the photometry (see previous section), so in principle stellar populations of different age and/or spatial location should be calibrated independently. However, since in this study we are mainly concerned with the distance, we adopt only one calibration, which is valid for the old population of the north-eastern quadrant of the ACS field.
4. Distance
We measure the distance of the Antennae using the luminosity of the TRGB in the -band, a now well established technique (e.g., Rizzi et al. 2006, and the references therein). By definition the distance modulus is , where is measured on the luminosity function (LF) of the RGB population, is a function of the average metallicity of the RGB population, and is the extinction in the -band. To compute the average metallicity one can use a color-metallicity relation, which gives as a function of the color of the RGB measured at some pre-defined absolute luminosity of the branch. Therefore one needs , which is the quantity one is trying to compute. Distance and metallicity are then computed iteratively, starting from some reasonable guess of , and working until convergence (see Sakai et al. 1996). The details of this procedure are the following.
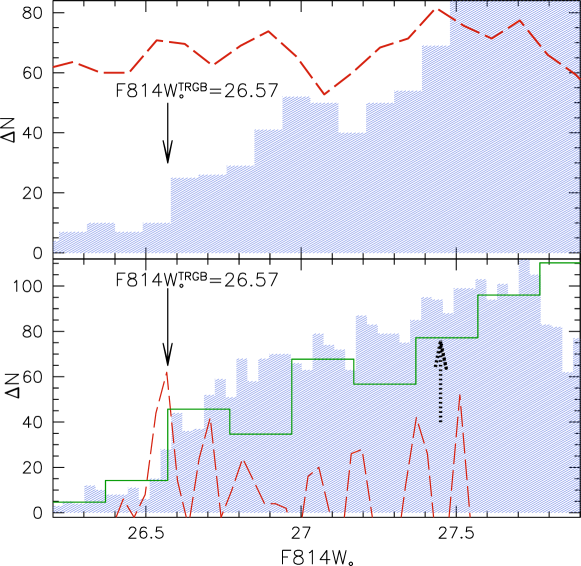
To measure the luminosity function (LF) of RGB stars, RGB samples were defined by applying two spatial selections, that include only objects in the S78 region or the NE quadrant away from star-forming regions (cf. Fig. 1). The CMDs for these samples of and stars (NE quadrant and S78 region, respectively) are shown in the middle and right panels of Fig. 2. The RGB of a presumably old (age 2 Gyr) population is clearly evident in these panels (populations younger than 2 Gyr do not generate substantial RGB sequences). This population most likely arises from the original disk of NGC 4038. In Fig. 3 we show the luminosity functions of the RGB populations presented in the middle and right panels of Fig. 2. The RGB tip is readily visible and application of a Sobel edge-detection filter yields for the population of the NE region. Here the error is just the formal uncertainty of the method, which depends on the bin size. This value must be corrected for the bias in the observed magnitudes, derived from the artificial star experiments, which is mag at this luminosity. The corrected value is then mag. The TRGB luminosity and color [] were converted from the VEGAMAG system to the Johnson-Cousins system, yielding . The observed tip luminosity (i.e., with no bias applied) is magnitudes fainter than that derived in SHR04. The difference in the two determinations is probably due to the same photometric bias that was found above by means of simulations. The mag found here might well turn into 0.1 mag when working near the photometric limit of the WFPC2 dataset.
As recalled above, can now be converted into a distance once and are computed iteratively. The metallicity was determined by comparing the color of the RGB to the fiducial branches of Galactic globular clusters taken from B05. The luminosities and colors of the fiducials were computed using values of the distance moduli and reddenings from Harris (1996; catalog version 2003 February). The of the clusters was then plotted against the color of the RGB at (cf. Da Costa & Armandroff 1990). The metallicities were again taken from Harris (1996) and a fit was obtained excluding the two clusters at the metallicity extremes (namely NGC 6341 and NGC 6528): this ensures that a linear relation is a good approximation to the metallicity–color relation in the range of interest. The mean color of the RGB stars was then obtained by selecting stars with luminosities , and was converted into a mean metallicity by using the relation obtained above, which has a slope dex/mag. In this way we measure a mean metallicity for the RGB stars of . The error is dominated by the uncertainty on the distance modulus, and it takes into account the uncertainty on the mean color of the RGB, that on the photometric zero point and the reddening determination, and the error on the metallicity-color calibration. The value of the mean metallicity is valid only if the RGB stars are as old as those in Galactic globular clusters. If they are younger, then since at fixed abundance a younger RGB has bluer colours (using isochrones from Girardi et al. (2002) we estimate that an age decrease of Gyr changes the color of the RGB at by 0.2 mag) our mean metallicity estimate is actually a lower limit on the true value. With the metallicity-color relation quoted above, we can estimate a slope of the metallicity-age relation of dex/Gyr. We note, however, that Mirabel et al. (1992) measured a gas-phase oxygen abundance of for the star-forming regions in this vicinity, which must be also the metallicity of the current generation of stars. Assuming that the metallicity increases with time, and that oxygen traces iron, then this value represents an upper limit to the metallicity of the RGB population.
To estimate the absolute luminosity of the TRGB, we use the fact that the mean metallicity of RGB stars computed above is intermediate between those of Cen and 47 Tuc. These two clusters are the fixed points of the luminosity-metallicity relation established by Bellazzini et al. (2004), with TRGB luminosities set at mag and mag, respectively. Note that, although it is well-know that Cen stars have a range in metallicity, still more than of the cluster stars share a common [Fe/H] within dex (Suntzeff & Kraft 1996, Norris et al. 1996, Hilker et al. 2000), hence the cluster suitability as a TRGB calibrator. Since the metallicity of Antennae stars is in the scale of Harris (1996), we adopt [Fe/H] dex for Cen and [Fe/H] dex for 47 Tuc. A linear interpolation then yields . This luminosity value is valid only for a population with an age comparable to that of Galactic globular clusters (GGC). Since RGB stars in the tidal tail were once part of the NGC 4038 disk, it is likely that they have an age spread. Using theoretical models from Girardi et al. (2002) we computed the luminosity spread of the TRGB for ages greater than Gyr, and metallicities smaller than , which amounts to mag () in the band. On the other hand the same models show that age and metallicity act in opposite directions, so the likely presence of an age-metallicity relation will tend to reduce the luminosity variation, and mag can be taken as an upper limit to the luminosity spread.
Our firm distance modulus to the Antennae is then (m–M)∘, corresponding to Mpc. In the error budget we have included the error in the aperture correction ( mag), the zero-point error of the VEGAMAG photometric system ( mag) and the error on the reddening, the uncertainty in the tip position in the LF ( mag), the error in the HST-Johnson transformation ( mag), an uncertainty of mag to account for a possible age spread, and finally the error on the absolute magnitude of the tip ( mag).
Before comparing our new value of the distance to that obtained in SHR04, the Population II distance scale must be discussed. Traditionally the tip luminosity in the -band was taken as (e.g Da Costa & Armandroff 1990), with a mild dependence on the metallicity. However, after Hipparcos released the catalog of parallaxes for subdwarf stars in the solar vicinity, the traditional Pop II distance scale was revised. By fitting globular clusters’ main sequences to subdwarf sequences, Carretta et al. (2000) suggested that the so-called ‘long’ distance scale was favored by the new data. This means that Galactic globular clusters’ distance moduli are on average 0.2 mag greater than traditional values, and hence the RGB tip luminosity is greater by the same amount. In SHR04 such a distance scale was adopted, which led to a distance of Mpc for the Antennae. However, more recent calibrations of the Pop II distance scale seem to be moving back to ‘short’ distances. For example, in the case of 47 Tuc Zoccali et al. (2001) find by fitting the cluster’s white dwarf (WD) cooling sequence to local WDs with measured parallaxes, and Bellazzini et al. (2004) have recently published a TRGB luminosity calibration where they adopt for 47 Tuc. The newer distances are then shorter by mag compared to Carretta et al. (2000), and Gratton et al. (2003). In this paper we adopt the more recent distance scale, but if we adopted the tip luminosity of SHR04, the distance of the Antennae would be Mpc, fully compatible with our previously derived value of Mpc.
Note that, although the distance we measure strictly applies only to stars in the southern tail of the Antennae, it can be safely used for the whole system. In fact adopting the distance of this paper, the numerical model that was matched to the H I kinematics in Hibbard et al. (2001), gives a maximum tidal extent (tip to tip, in real space) of kpc. The maximum line-of-sight depth is kpc (tip of N tail to base of N disk). The maximum line-of-sight depth between our pointing and anywhere else in the system is kpc (tip of southern tail to base of N disk). If we adopt kpc as an upper limit to the maximum line-of-sight depth, then the distance modulus to any other region of the Antennae will be less than mag different from the one we measure.
For distances of the order of Mpc, the recession velocity for the Antennae differs from that inferred from the flow model of Tonry et al. (2000) by approximately . The model predicts a peculiar velocity dispersion of , so this difference from the model is not extreme, being at the level of . We note also that a similar difference is present for another galaxy near the position of the Antennae; in Fig. 11 of Tonry et al. (2000) there is an object near the Antennae that has a radial velocity larger than the model prediction. Moreover, objects near the Antennae are beginning to fall within the gravitational influence of the Great Attractor (GA), and the quoted figure in Tonry et al. (2000) shows several other objects with large residual velocities pointing toward the GA. Thus we believe our new distance does not generate any significant discrepancies with the observed recession velocity of the Antennae system.
5. Discussion
With our new HST/ACS imaging of the tidal tail region studied in SHR04, more than two magnitudes of the red-giant branch of an old (age 2 Gyr) population is readily visible. The resulting clear detection of the red-giant branch tip confirms the short distance found in the earlier paper. The downward revision of the distance to the Antennae has far reaching scientific implications: some of these are discussed in SHR04, and an update is given here.
5.1. Young massive clusters
An immediate implication is that the linear scales of, e.g., Antennae clusters are reduced by a considerable factor, which depends on the distance adopted in the original study. For example, using two different techniques Whitmore et al. (1999) estimated a median effective radius of pc and pc for the young clusters. This is larger than the median of globular clusters in the Milky Way ( pc, see van den Bergh 1996), and of clusters in nearby starburst galaxies (– pc, see Meurer et al. 1995). With the shorter distance all linear dimensions are reduced by a factor , so the radii quoted above become pc and pc, respectively. Therefore the size of the clusters formed as a consequence of the Antennae merger now agree with those of well-studied objects in the nearby Universe, and with – pc for clusters created in other mergers (Schweizer et al. 1996; Miller et al. 1997; Whitmore et al. 1997; Carlson et al. 1998).
Moreover all luminosities are reduced by a factor of compared to the most commonly quoted distance of Mpc. Thus, along with the reduction factor of in linear scales, this implies a smaller projected length for the tails while the radial velocities would remain unchanged, leading to a shorter timescale for the interaction (Hibbard et al. 2001). The luminous to dynamical mass estimate for the tidal dwarf candidates (Hibbard et al. 2001) would be times lower (), implying a more significant dark-matter content, as recently inferred for other tidal dwarfs (Bournaud et al. 2007).
Observations of advanced stages of mergers has lead to the idea that the end product of a disk-disk encounter could be a giant elliptical (E) galaxy (Toomre & Toomre 1972; Toomre 1977; Schweizer 1987). However there are two problems with this idea, both related to the presence of rich globular cluster (GC) populations around E galaxies. The first problem is that E galaxies have higher specific frequencies of GCs (number of clusters per unit luminosity, see Harris & van den Bergh 1981) compared to spiral galaxies (van den Bergh 1982). While massive disk galaxies have , Es have – depending on the environment (e.g., Brodie & Strader 2006). The second problem is that the mass function (MF) of GCs is log-normal (i.e., Gaussian when plotted vs. the logarithm of the mass), while young massive clusters show power-law MFs with exponents close to (Elmegreen & Efremov 1997, Hunter et al. 2003, Bik et al. 2003, De Grijs et al. 2003, Zhang & Fall 1999). These two issues are discussed more thoroughly in the following sections.
5.1.1 Specific frequency
The fact that new clusters are formed in mergers, as first shown by HST observations of NGC 1275 (Holtzman et al. 1992), suggests that they could increase as long as new clusters are formed with higher efficiency with respect to field stars, compared to that of the primordial cluster population of the interacting disks. In the case of the Antennae, Whitmore & Schweizer (1995) estimated that new clusters have been formed in the interaction, and that in a Hubble time the system will fade from to . By definition , so with the above parameters for the system. Our new distance modulus is magnitudes shorter than adopted by Whitmore & Schweizer (1995), so with a fainter , the frequency becomes . This is comparable even to Es with the richest cluster systems, so it might appear that is not a problem in the case of the Antennae. However it is difficult to attach an uncertainty to this number. On one hand, a substantial number of clusters is below the detection limit, and more clusters will be formed in the future perigalactic passages, so seems underestimated. But on the other hand a large fraction of clusters will be destroyed by internal and external dynamical processes (see e.g., Bastian & Gieles 2007), and this will drive down. To gain some insight we can look at merger remnants, which should represent the future evolution of the Antennae. In the case of NGC 7252 Miller et al. (1997) find after Gyr of fading, and a post-fading is computed in Schweizer et al. (1996) for NGC 3921. So it is possible that the net effect of the cluster evolution will be to reduce the of the Antennae, but thanks to its presently high value, the final value might well still be compatible with that of a field elliptical galaxy. Note that about two thirds of the clusters should be destroyed, which is compatible with the results of Vesperini (2000).
5.1.2 Mass function
It is been observed that the LF of young-massive clusters (YMC) can be represented by two power-laws of different slope (Whitmore et al. 1999), and with a bend at . This is discussed in the scenario of the possible transformation of an initial power-law MF into a log-normal MF via destruction of the lower mass clusters. Adopting Myr for the age, and using solar metallicity models from Bruzual & Charlot 2003, they find that the bend corresponds to . Although the peak of the MF for GCs in the Milky Way is at a higher mass of , Whitmore et al. (1999) claim that, given the uncertainties on the location of the bend and on the ratio given by the models, the two mass values are compatible. Therefore the proposal is that selective destruction of clusters less massive than the peak should eventually lead to a GC-compatible, log-normal MF, as proposed by Fall & Zhang (2001). With a shorter distance, the change of slope of the broken power-law of Whitmore et al. (1999) is at , which makes its identification with the MF peak of old Galactic GCs less likely. Moreover Zhang & Fall (1999), modeling the age distribution of YMCs find that the MF is a power-law of , with no signs of a break. They interpret the bend in the LF as an effect of a MF truncated at , and of the fading of the more massive clusters. Note also that cluster destruction would leave behind a power-law LF with in the brightest part, and a shallower LF in the fainter part, while Whitmore et al. (1999) find that in the fainter part, and a steeper LF in the brightest part, which can indeed be interpreted as an effect of fading (Gieles et al. 2006).
If the MF is a power-law, then a change of distance only affects the mass of the most massive clusters generated by the merger. Assuming a distance of Mpc Whitmore & Schweizer (1995) found that the cluster luminosity function ends at , which translates into a mass of . Old Galactic GCs have average logarithmic mass and a dispersion (e.g., Brodie & Strader 2006), so the largest clusters in the Antennae would be larger than the (logarithmic) average mass of Galactic GCs, and the most massive young clusters in the Antennae would be almost twice as massive than their counterparts in the Milky Way. Since massive clusters are not destroyed, this would pose another problem for the merger-induced formation of globular clusters. Instead with the new distance the most massive clusters in the Antennae have masses of , which is well within the mass limits of Galactic GCs.
Although the models of Fall & Zhang (2001) can transform a power-law MF into a log-normal one, this happens only with a restricted set of parameters. Instead the simulations of Vesperini (2000) have shown that an initial log-normal MF stays log-normal for large variations of the initial conditions, and the average mass and dispersion tend to reach those of old GCs after a few Gyr of dynamical evolution. This is despite the fact that of the clusters are destroyed in the process. This convergence would explain why the GC MF is almost universal. In this respect, some investigations have warned that log-normal and power-law mass (or luminosity) functions are significantly different only at the faint end, where they are usually hard to determine due to incompleteness of the data (e.g., Anders et al. 2007). The Antennae are a particularly important case, since their YMC population is one of the youngest (only a few tens of Myr old), so it can tell us what is the shape of the MF of merger-induced clusters at the very beginning. With a different analysis of the HST imaging presented in Whitmore et al. (1999), a new LF was obtained by Anders et al. (2007) and converted into a MF assuming an average age of Myr and solar metallicity. They found that a log-normal function provides a better fit, with and dex (and assuming again Mpc distance). With a shorter distance the average mass of Anders et al. (2007) becomes , so more dynamical evolution is required to shift it to a value comparable to old GCs. While an initial log-normal MF would be appealing, preliminary results, based on new and deeper HST/ACS imaging, seem to show that the MF is a power-law even past the older detection threshold (Whitmore 2006). So the issue of GC creation in mergers is still open. Either conditions in the primordial Universe made clusters with a characteristic mass, and today they do not. Or clusters are always born with power-law MFs which evolve to log-normal. A definite answer will need more realistic simulations of cluster evolution in a time-variable potential like that of a merger. Note also that evolution of the cluster MF has perhaps been detected in intermediate-age mergers like NGC 1316 and NGC 3610 (Goudfrooij et al. 2004; Goudfrooij et al. 2007).
5.2. SN 2004gt
SN 2004gt is of great interest because its presence in the Antennae may permit the strongest yet constraints on the progenitor of Type Ic SNe. It is currently debated whether the progenitors of these SNe are high-mass single stars or intermediate-mass stars in a binary system (see below), and since a small fraction of type Ic SNe are associated with gamma-ray bursts (GRB, e.g., Bloom et al. 1999; Stanek et al. 2003; Hjorth et al. 2003; Malesani et al. 2004; Pian et al. 2006), being able to discriminate between these two hypothesis is of great interest for GRB models as well. Indeed no progenitor of a type Ic SN has ever been found, and we only have upper luminosity limits for five stars (see Table 1 in Maund et al. 2005). Although SNe of type Ic have been identified in galaxies closer than the Antennae, the depth of HST archival images permits to reach fainter absolute magnitudes. Nevertheless both Maund et al. (2005) and Gal-Yam et al. (2005) failed to find the progenitor of SN2004gt, and only upper limits could be established. Still these limits are fainter than all previous determinations, and consequently place the strongest constraints on possible candidates.
The first study adopted a conventional Mpc distance, while the second one used the shorter Mpc distance established in SHR04. With the distance proposed in this paper (which is only smaller than our previous one) the results of Maund et al. (2005) can be put in better agreement with those of Gal-Yam et al. (2005), as we now show. The conclusion of Gal-Yam et al. (2005) is that the progenitor of SN2004gt, if a Wolf-Rayet (WR) star, must have belonged to one of the more evolved types. This is because as a WR star evolves and its envelope gets progressively stripped, it becomes hotter and fainter (see, e.g., the tracks plotted in Maund et al. 2005), and all progenitors brighter than in the band () are excluded by Gal-Yam et al. (2005). So the progenitor of SN2004gt must have been of type WNE (where the products of hydrogen-burning through CNO-cycle are exposed), or WC/WO (where the products of helium burning are exposed). See Maeder & Conti (1994) for more details.
The approach of Maund et al. (2005) was to perform a direct comparison with stellar tracks from the Geneva group, computed with a prescription for mass loss. The magnitude and color limits of their photometry were converted into a limit in bolometric luminosity dependent on the effective temperature, and all stars having their end-point evolution fainter than that limit were accepted as viable progenitors. The permitted Hertzsprung-Russell diagram region is that of relatively faint and blue stars, so all red supergiants are excluded, in agreement with the result of Gal-Yam et al. (2005) illustrated above. The end points of and stars do reach this region of luminosities smaller than and temperatures greater than while and tracks are always too luminous. Adopting Mpc, all luminosities become smaller, and all WR evolutionary end-points are above the detection threshold, and thus in principle should be excluded. However WR stars fainter than the limit computed by Maund et al. (2005) do exist (see Vacca & Torres-Dodgen 1990), so our shorter distance reveals an inconsistency in one of the thresholds computed by Maund et al. (2005). Indeed the luminosity limits for the hottest stars are more uncertain due to the particular approximation for the WR spectral energy distribution that was adopted, and to the uncertainties on the bolometric corrections (Maund, priv. comm.). So at Mpc progenitors of could still be possible.
The general conclusion is then that both Maund et al. (2005) and Gal-Yam et al. (2005) support a type Ic progenitor which is a WR star of the most evolved types, and with a main-sequence mass in the lowest range of these wind-dominated stars (see, e.g., Maeder & Conti 1994 for a review). However, an alternative scenario for SNe Ic is an origin from a star of lower mass than a WR, and in a binary system. In that case the envelope is stripped through interaction with its companion (see Pods et al. 2004 and references therein). This possibility cannot be constrained by the SN in the Antennae, so this issue is still open.
5.3. Star formation induced by the merger
The Antennae is often used as an example of the kind of ‘violent’ processes occurring in mergers. For example, Sanders & Mirabel (1996) include this system in their compilation of Luminous Infrared Galaxies, which owe their high IR luminosity to a starburst. This is a class of galaxies whose total IR luminosity exceeds : according to Vigroux et al. (1996), who assumed a distance of Mpc, this is precisely the IR luminosity of the Antennae. Since the total IR luminosity is now , the Antennae should be classified in the regime of normal galaxies. This is perhaps not surprising, since most interacting galaxies have normal IR luminosities (Bushouse et al. 1988). And in particular the Antennae are the object opening the so-called Toomre sequence (Toomre 1977), so the star-formation rate (SFR) is not expected to be that of the more advanced stages. Indeed Charmandaris et al. (2000) studied the SFR along a modified Toomre sequence, as traced by the to flux ratio, and found that the ratio is small for galaxies in early stages of interaction, it increases by a factor of in merging/starburst systems, and it goes back to pre-starburst values in merger remnants. Although the Antennae was not part of the sequence studied by Charmandaris et al. (2000), the low IR luminosity deduced here is in line with the low SFR expected for a merger in its earliest stages.
Another, indirect confirmation of this is the fact that, thanks to the shorter distance, the luminosity function of the X-ray sources (XLF) in the Antennae becomes comparable with that of M82. The most recent XLF is presented in Zezas & Fabbiano (2007), and it is a power-law reaching maximum luminosities of in the – band, for an assumed c distance. The maximum luminosity becomes after subtracting , which is the factor of reduction in luminosity implied by our shorter distance. This means that is close to that of the XLF of M82 (e.g., Zezas & Fabbiano 2002), which also has a similar slope. The high-luminosity tail of the XLF is populated by high-mass X-ray binaries, which are a signature of a young stellar population. The similarity of the XLFs of the Antennae and M82 means that the underlying stellar population has comparable age, i.e. that the strength of the on-going SF is also comparable. The SFR per unit area of M82 is comparable to that of NGC 520 (Kennicutt 1998), which is classified as pre-starburst in the modified Toomre sequence of Charmandaris et al. (2000). So we might infer that the SFR in the Antennae is also comparable to that of NGC 520 and M82, in turn a sign of an early merger stage. In fact another consequence of the reduced distance is that the number of so-called ultra-luminous X-ray sources (ULX; those exceeding erg cm-2 sec-1) become comparable to the number of ULXs found in NGC 520. Eighteen ULXs were found by Zezas & Fabbiano (2002) in the Antennae, for a distance of Mpc. With our distance, these become six which is a number closer to the three–four ULX sources detected by Read et al. (2005) in NGC 520. The maximum X-ray luminosities quoted above are also comfortably small: indeed Zezas & Fabbiano (2007) find that even luminosities up to erg cm-2 sec-1 can be radiated by a black-hole of , which in turn can be the end-point of normal stellar evolution in a binary system. In fact Zezas & Fabbiano (2007) propose to move the limit of ULX sources above , since only above such luminosities a non-standard scenario is required (like an intermediate-mass black hole or beamed radiation).
In summary, with the shorter distance determined here, the Antennae remain a spectacular system, but it is no longer an extreme merger in terms of its consequences (star-burst luminosity, cluster population, X-ray sources, etc). A full appreciation of the properties of this system in light of our new firm distance will have significant implications for many areas of Astronomy.
References
- (1) Anders, P., Bissantz, N., Boysen, L., de Grijs, R., & Fritze-v. Alvensleben, U. 2007, MNRAS, 377, 91
- (2) Bastian, N., & Gieles, M. 2007, in Mass loss from stars and the evolution of stellar clusters, Proc. of a workshop held in honour of H.J.G.L.M. Lamers, Lunteren, The Netherlands. Eds. A. de Koter, L. Smith and R. Waters (San Francisco: ASP)
- (3) Bellazzini, M., Ferraro, F. R., Sollima, A., et al. 2004, A&A, 199, 211 (B04)
- (4) Baldi, A., et al. 2006, ApJ, 636
- (5) Bastian, N., Emsellem, E., Kissler-Patig, M., & Maraston, C. 2006, A&A, 445, 471
- (6) Bedin, L. R., Cassisi, S., Castelli, F., Piotto, G., Anderson, J., Salaris, M., Momany, Y., & Pietrinferni, A. 2005, MNRAS, 357, 1038 (B05)
- (7) Bik, A., Lamers, H. J. G. L. M., Bastian, N., et al. 2003, A&A, 397, 473
- (8) Bloom, J. S., et al. 1999, Nature, 401, 453
- (9) Bohlin, R. C., Savage, B. D., & Drake, J. F. 1978,ApJ, 224, 132
- (10) Bournaud, F., Duc, P.-A., Brinks, E., Boquien, M., Amram, P., Lisenfeld, U., Koribalski, B., Walter, F., & Charmandaris, V. 2007,Science, 316, 1166
- (11) Brandl, B. R., et al. 2005, ApJ 635, 280
- (12) Brodie, J. P., & Strader, J. 2006,ARA&A, 44, 103
- (13) Bruzual, A. G., & Charlot, S. 1993, ApJ, 405, 538
- (14) Bushouse, H. A., Lamb, S. A., & Werner, M. W. 1988, ApJ, 335, 74
- (15) Carlson, M. N., Holtzman, J. A., and the WFPC2 IDT 1998, AJ, 115, 1778
- (16) Carretta, E., Gratton, R. G., Clementini, G., & Fusi Pecci, F. 2000, ApJ, 533, 215
- (17) Charmandaris, V., Laurent, O., Mirabel, I. F., Gallais, P., & Houck, J. 2000, In ISO beyond the Peaks, ESA SP-456, p. 253 (2000).
- (18) Da Costa, G. S., & Armandroff, T. E. 1990, AJ, 100, 162
- (19) Girardi, L., Bertelli, G., Bressan, A., Chiosi, C., Groenewegen, M. A. T., Marigo, P., Salasnich, B., & Weiss, A. 2002, A&A, 391, 195
- (20) Goudfrooij, P., Gilmore, D., Schweizer, F., Whitmore, B. C. 2004, ApJ, 613, L121
- (21) Goudfrooij, P., Schweizer, F., Gilmore, D., Whitmore, B. C. 2007, AJ, 133, 2737
- (22) de Grijs, R., Bastian, N., & Lamers, H. J. G. L. M. 2003, ApJ, 583, L17
- (23) Elmegreen, B. G., & Efremov, Y. N. 1997, ApJ, 480, 235
- (24) Fabbiano, G., Zezas, A., & Murray, S. S. 2001, ApJ, 554, 1035
- (25) Fall, S. M., & Zhang, Q. 2001, ApJ, 561, 751
- (26) Gal-Yam, A., et al. 2005, ApJ, 630, L29
- (27) Gieles, M., Larsen, S. S., Bastian, N., Stein, I. T. 2006, A&A, 450, 129
- (28) Gratton, R. G., et al. 2003, A&A, 408, 529
- (29) Harris, W. E. 1996, AJ, 112, 1487
- (30) Harris, W. E., & van den Bergh, S. 1981, AJ, 86, 1627
- (31) Hibbard, J. E., van der Hulst, J. M., Barnes, J. E., & Rich, R. M. 2001,AJ, 122, 2969
- (32) Hibbard, J. E., et al. 2005, ApJ, 619, L87
- (33) Hilker, & M., Richtler, T. 2000, A&A, 362, 895
- (34) Hjorth, J., et al. 2003, Nature, 423, 847
- (35) Holtzman, J. A., Faber, S. M., Shaya, E. J., Lauer, T. R., Groth, J., et al. 1992, AJ, 103, 691
- (36) Hunter, D. A., Elmegreen, B. G., Dupuy, T. J., & Mortonson, M. 2003,ApJ, 126, 1836
- (37) Kennicutt, R. C. 1998,ApJ, 498, 541
- (38) Lockman, F. J., & Condon, J. J. 2005, AJ, 129, 1968
- (39) A. Maeder, P. S. Conti, ARA&A 32, 227 (1994).
- (40) Malesani, D., et al. 2004, ApJ, 609, L5
- (41) Maund, J. R., Smartt, S. J., & Danziger, I. J. 2005, MNRAS, 364, L33
- (42) Mengel, S., Lehnert, M. D., Thatte, N., & Genzel, R. 2005, A&A, 443, 41
- (43) Meurer, G. R., Heckman, T. M., Leitherer, C., Kinney, A., Robert, C. , & Garnett, D. R. 1995, AJ, 110, 2665
- (44) Miller, B. W., Whitmore, B. C., Schweizer, F., & Fall, S. M. 1997, AJ, 114, 2381
- (45) Mirabel, I. F., Dottori, H., & Lutz, D. 1992, A&A, 256, L19
- (46) Momany, Y., Held, E. V., Saviane, I., et al. 2005, A&A, 439, 111
- (47) Norris, J. E., Freeman, K. C., & Mighell, K. L. 1996, ApJ, 462, 241
- (48) Pian, E., et al. 2006, Nature, 442, 1011
- (49) Podsiadlowski, P., Mazzali, P. A., Nomoto, K., Lazzati, D., Cappellaro, E. 2004, ApJ, 607, L17
- (50) Read, A. M. 2005, MNRAS, 359, 455
- (51) Rizzi, L., Bresolin, F., Kudritzki, R.-P., Gieren, W., & Pietrzynski, G. 2006, ApJ, 638, 766
- (52) Rubin, V. C., Ford, W. K., & D’Odorico, S. 1970, ApJ, 160, 801
- (53) Sakai, S., Madore, B. F., & Freedman, W. L. 1996, ApJ, 461, 713
- (54) Sanders, D. B., & Mirabel, F. 1996, ARA&A, 34, 749
- (55) Saviane, I., Held, E. V., & Bertelli, G. 2000, A&A, 355, 56
- (56) Saviane, I., Hibbard, J., & Rich, R. M. 2004, AJ, 127, 660 (SHR04)
- (57) Schlegel, D. J., Finkbeiner, D. P., & Davis, M. 1998, ApJ, 500, 525
- (58) Schweizer, F. 1978, in Structure and Properties of Nearby Galaxies, E. M. Berkhuijsen, R. Wielebinski, Eds. (Dordrecht, Reidel, 1978), p. 279
- (59) Schweizer, F. 1987, In Philos. Trans. R. Soc. London Ser. A 358, 2063
- (60) Schweizer, F., Miller, B., Whitmore, B. C., & Fall, S. M. 1996, AJ, 112, 1839
- (61) Sirianni, M., et al. 2005, PASP, 117, 1049 (S05)
- (62) Stanek, K. Z., et al. 2003, ApJ, 591, L17
- (63) Stetson, P. B. 1987, PASP, 99, 191
- (64) Stetson, P. B. 1994, PASP, 106, 250
- (65) Stetson, P. B., Hesser, J. E., & Smecker-Hane, T. A. 1998, PASP 110, 533
- (66) Suntzeff, N. B., & Kraft, R. P. 1996, AJ, 111, 1913
- (67) Tonry, J. L., Blakeslee, J. P., Ajhar, E. A., & Dressler, A. 2000, ApJ, 530, 625
- (68) Toomre, A. 1977, In Evolution of Galaxies and Stellar Populations, ed. B. M. Tinsley, R. B. Larson, p. 40. Proc. Conf. Yale Univ. New Haven: Yale Univ. Obs.
- (69) Toomre, A., & Toomre, J. 1972, ApJ, 178, 623
- (70) Vacca, W. D., Torres-Dodgen, A. V. 1990, ApJS, 73, 685
- (71) van den Bergh, S. 1982, PASP, 94, 459
- (72) van den Bergh, S. 1996, AJ, 112, 2634
- (73) Vesperini, E. 2000, MNRAS, 318, 841
- (74) Vigroux, L., Mirabel, F., Altieri, B., et al. 1996, A&A, 315, 93
- (75) Whitmore, B. C. 2006, to be published in Massive Stars: From Pop III and GRBs to the Milky Way, eds. Mario Livio & Eva Villaver, Cambridge University Press
- (76) Whitmore, B. C., & Schweizer, F. 1995, AJ, 109, 960
- (77) Whitmore, B. C., Miller, B. W., Schweizer, F., Fall, S. M. 1997, AJ, 114, 1797
- (78) Whitmore, B. C., Zhang, Q., Leitherer, C., et al. 1999, AJ, 118, 155
- (79) Whitmore, B. C., et al. 2005, AJ, 130, 2104
- (80) Zhang, Q., & Fall, S. M. 1999, ApJ, 527, L81
- (81) Zezas, A., & Fabbiano, G. 2002, ApJ, 577, 726
- (82) Zezas, A., & Fabbiano, G. 2007, ApJ, 661, 135
- (83) Zoccali, M., et al. 2001, ApJ, 553, 733