LkH 330: Evidence for dust clearing through resolved submillimeter imaging
Abstract
Mid-infrared spectrophotometric observations have revealed a small sub-class of circumstellar disks with spectral energy distributions (SEDs) suggestive of large inner gaps with low dust content. However, such data provide only an indirect and model dependent method of finding central holes. We present here the direct characterization of a 40 AU radius inner gap in the disk around LkH 330 through 340 GHz (880 m) dust continuum imaging with the Submillimeter Array (SMA). This large gap is fully resolved by the SMA observations and mostly empty of dust with less than 1.3 10-6 M⊙ of solid particles inside of 40 AU. Gas (as traced by accretion markers and CO M-band emission) is still present in the inner disk and the outer edge of the gap rises steeply – features in better agreement with the underlying cause being gravitational perturbation than a more gradual process such as grain growth. Importantly, the good agreement of the spatially resolved data and spectrophometry-based model lends confidence to current interpretations of SEDs with significant dust emission deficits as arising from disks with inner gaps or holes. Further SED-based searches can therefore be expected to yield numerous additional candidates that can be examined at high spatial resolution.
1 Introduction
The conservation of angular momentum during cloud collapse leads to the creation of circumstellar disks around young stars that provide an environment for planetary system formation. These disks are widely studied through their dust content that causes excess emission above that expected from the stellar photosphere at near-IR to mm-wavelengths. The physical conditions in circumstellar disks are comparable to those inferred for the early stages of our own solar system, with sizes of tens to hundreds of astronomical units (AU; i.e. the distance between the Sun and the Earth) and masses of 0.1 (Beckwith 1996, Mundy et al. 2000). At the other end of the expected evolutionary sequence are less massive debris disks, which are older and exhibit weaker infrared (IR) excess emission that is thought to arise from collisions of planetesimals after the first generation of dust has coagulated or dissipated (Aumann et al. 1984, Rieke et al. 2005).
Less is understood about how disks transition between these phases, an interval over which significant evolution of proto-planetary bodies is expected to occur. Thus, knowledge of how disks dissipate is vital for our understanding of planetary system formation. Studies have shown that the transition period lasts at most 3-5 Myr (e.g. Strom et al. 1989; Beckwith et al. 1990), making the identification of a sample of this important, short-lived phase difficult. One indicator of intermediate systems is the presence of an inner hole or gap indicating that the inner disk has evolved while the outer disk has not. The presence of gaps may indicate that planets have already formed in the disks and cleared the material around their orbits, as has been shown in the case of TW Hya (Setiawan et al., 2008). Such systems can therefore strongly constrain models of planet formation, especially the role of gap formation and disk-planet interactions in various planet migration scenarios that lead to the creation of the “hot Jupiters” found to orbit much older systems (Marcy et al., 2005). It is therefore essential to search for further examples that either support or reject the gap hypothesis.
In theory, an inner gap in a proto-planetary disk can be identified spectrophotometrically since hotter dust emits at shorter wavelengths and dust temperature is primarily a function of radius in disks. Thus, a gap causes a reduction in flux at specific wavelengths which can then be related to radius. For gaps close to the star, the SED is depressed over wavelengths of 1-15 µm as the absence of hot dust results in the infrared flux coming largely from the stellar photosphere, rather than disk surface emission. To date, such emission “deficits” are the tool most widely used to infer the presence of gaps (Calvet et al. 2002, Forrest et al. 2004), but spectrophotometric signatures are indirect and notoriously difficult to interpret as multiple physical scenarios can result in the same SED. For instance, both a gap from a companion and large grain growth could lead to missing mid-IR emission in the SED. Additional constraints and detailed models are therefore required to distinguish between the possible physical scenarios that are consistent with the observed fluxes.
Disks emit strongly at submillimeter wavelengths where interferometers like the Submillimeter Array (SMA) allow small scale imaging. Here we present some of the first direct evidence for large inner holes in the form of a SMA 880 m continuum map resolving the 40 AU radius inner hole in the disk around LkH 330, a young G3 pre-main sequence star in the Perseus star forming region. Although the distance to the Perseus molecular cloud is uncertain, here we adopt 250 pc in agreement with Enoch et al. (2006). LkH 330 has a mass of 2.5 M⊙, an effective temperature of 5800 K and an age of 3 Myr (Osterloh & Beckwith 1995, Cohen & Kuhi 1979). We first present the relevant observational details before turning to a discussion of the results and their implications for SED-driven searches for gaps in circumstellar disks.
2 Observations
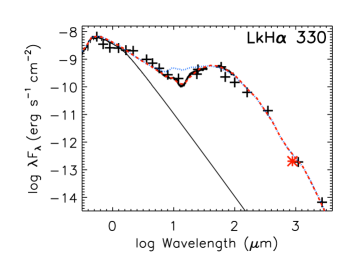
Mid-IR spectrophotometry of LkH 330 was acquired as part of the Spitzer “From Cores to Disks” (c2d) Legacy Science project. The resulting SED is shown in Figure 1. Out of a sample of over 100 spectra in the c2d first look program, LkH 330 was one of only 5 disks which showed SED features characteristic of an inner hole (Brown et al., 2007). Those disks visible from the northern hemisphere have been targeted for high spatial resolution follow-up imaging at IR through mm-wavelengths.
Dust emission measurements of LkH 330 were acquired with the Submillimeter Array (SMA)111The Submillimeter Array is a joint project between the Smithsonian Astrophysical Observatory and the Academia Sinica Institute of Astronomy and Astrophysics, and is funded by the Smithsonian Institution and the Academia Sinica. (Ho et al., 2004) on 2006 November 11 and 19 using the very extended configuration of seven of the 6 meter diameter antennas, which provided baselines ranging in length from 80 to 590 meters. Double sideband (DSB) receivers tuned to 341.165 GHz provided 2 GHz of bandwith/sideband, centered at an Intermediate Frequency (IF) of 5 GHz. The DSB system temperatures ranged from 210 to 870 K, and LkH 330 was observed from hr angles of -4.5 to 4.5 to yield a synthesized beam of 028x033. Calibration of the visibility phases and amplitudes was achieved with observations of 3C111, typically at intervals of 25 minutes. Measurements of Uranus and Titan provided the absolute scale for the flux density calibration and the uncertainties in the flux scale are estimated to be 15%. The data were calibrated using the MIR software package (http://cfa-www.harvard.edu/cqi/mircook.html), and processed with Miriad (Sault et al., 1995).
3 Results
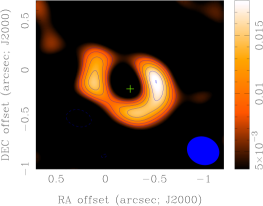
Fits to the optical through millimeter-wave SED yield an estimated gap outer radius of 40 AU (Fig. 1, Brown et al., 2007). With a sufficiently sharp transition, aperture synthesis observations should detect a null in the flux versus ()-distance as opposed to the smooth drop off in flux associated with power-law mass surface density profiles that characterizes most classical T Tauri star disks (Andrews & Williams, 2007). As Figure 2 shows, such a null is indeed present in the SMA data at a distance of 700-800 nsec (or 210-240 k at 340 GHz).
When Fourier transformed to the image plane, the SMA observations clearly resolve the size, orientation and radial structure in the LkH 330 disk (see Figure 3, top panel). The hole is approximately the size of the synthesized beam at 033, corresponding to a hole radius of 41 AU. The integrated flux of the disk is 60 mJy, and the 1-sigma Root Mean Square (1 RMS) noise in the map is 2.3 mJy. The outer disk has a radius of 05, or 125 AU at =250 pc; and the position angle of the disk major axis is 75∘. For a disk with azimuthal symmetry the inclination angle is 40∘, and this inclination causes the most prominent asymmetries where more flux is seen east-west than north-south. The edges of the disk where more dust lies along the line-of-sight have higher column densities, creating two bright regions aligned with the major axis of the disk. However, other significant asymmetries remain in the data.
The hole is largely empty of dust and the significant intensity contrast between the inner and outer disk indicates a large mass surface density contrast – even for mm-sized grains. The flux within the hole is below the 1 RMS of 2.3 mJy. Using the flux to disk mass conversion of Beckwith et al. (1990), this places a limit on the amount of mass in the hole of only 1.3 10-4 M⊙ for a gas:dust ratio of 100. The boundary between hole and outer disk is abrupt with the flux dropping 25% in less than 10 AU and 50% in less than 20 AU.
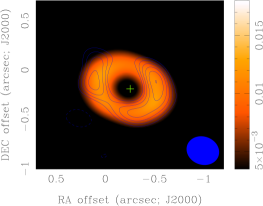
The 2-D radiative transfer code RADMC (Dullemond & Dominik, 2004) was used to simultaneously model both the resolved image and the SED. This model assumes a passive disk, which merely reprocesses the stellar radiation field. In order to fit the missing dust emission, the code was adapted to reduce the dust density over a specific region to create a gap in the disk. The resulting image was resampled in Miriad using the same ()-plane sampling as the SMA data so the two are directly comparable (see Figure 3, middle panel).
In the model, the disk is assumed to be flared such that the surface height, , varies with radius, R, as (Chiang & Goldreich, 1997). The models do not calculate the hydrostatic equilibrium self-consistently but physicality was checked with an a posteriori calculation at the outer disk edge. Thus, the pressure scale height (H/R) is anchored at 0.17 at the outer disk edge, in this case, 300 AU. The dust composition is set to a silicate:carbon ratio of 4:1, although moderate changes in this ratio have little effect at 880 µm. Only amorphous silicate is included as no crystalline features are seen in the Spitzer spectrum. The grain sizes range from 0.01 m to 10 cm with a power-law index of -3.5 (Draine, 2006), constrained by both the weak silicate features and the well-measured Rayleigh-Jeans slope. The total disk mass, assuming a gas of solar composition, is 0.017 M⊙ (Osterloh & Beckwith, 1995). The disk inner edge was set at 0.26 AU – the radius at which the dust sublimation temperature of 1500 K is reached.
The gap is represented in the model by three parameters: both an inner and an outer gap radius and a density reduction factor. The best fit model was found by performing a minimization on the inner and outer gap radii to find the best fit to the SED (see Brown et al. 2007 for further details). This model was then compared to the image to assess the validity of the SED interpretation. The SED best fit model matched the image remarkably well, lending confidence to current spectrophotometry-based models of transitional disks. Both the submillimeter image and the SED indicate that the gap has an outer radius of 40 AU. The SMA image places no constraint on the inner gap radius but the SED requires 0.2 Mlunar of dust closer than 1 AU to the star to account for the near-IR excess observed at wavelengths greater than 2 m (see Fig. 1). Within our solar system, this gap corresponds to the area between Earth’s orbit and the inner Kuiper Belt.
The density reduction factor is severely constrained by the low flux at large () distances in the SMA data (or R40 AU in the SMA image). The best fit model consistent with the SED has a density reduction of 1000 within the gap, corresponding to 3.1 10-5 M⊙ of material as compared to the 1.3 10-4 M⊙ upper limit derived from the image. For comparison, the model without the gap contains some 0.01 M⊙ of material within the same region. All of these models assume a gas:dust ratio of 100, and still require a ring of dust within an AU of the star to fit the observed near-IR excess. However, the required mass within 1 AU is well below the detection limit of the SMA image.
In order to further investigate the abruptness of the transition between hole and outer disk, a gap edge was introduced into the RADMC model such that the dust mass surface density rises logarithmically over a range of radii around the outer gap radius as one moves outward. This modeling confirms that the aperture synthesis data are consistent with a step function. Numerically, the transition region between the hole and the outer disk can be no larger than 5 AU given the present spatial resolution and dynamic range of the SMA data. Such a steep transition is more consistent with truncations induced by gravitational instabilities than a more gradual process such as dust settling and coagulation (Crida et al. 2006, Dullemond & Dominik 2005, Tanaka et al. 2005).
4 Discussion
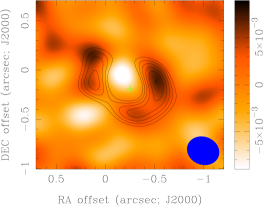
As the bottom panel of Fig. 3 shows, significant asymmetries remain in the data which cannot be explained by an axisymmetric disk. Excess flux can be seen in the right side of the disk and a deficit of flux can be seen in the north. Such asymmetries would be expected from gravitational perturbation caused by a large planet or binary companion. For planetary companions of sufficient mass, some disk gas is expected to be transported across the gap while the dust transport is strongly inhibited (Alexander & Armitage, 2007). In order to verify or refute the presence of close companions, high dynamic range diffraction-limited infrared searches with 8-10m class telescopes will be necessary.
The presence of material close to the star, making the density reduction a gap rather than a hole, places constraints on many physical processes which might produce the gap. While the only indication of dust close to the star is the 1-10 µm excess, we have two additional indications that there is gas close to the star. First, LkH 330 displays H Balmer emission, with equivalent width measurements ranging from 11 to 20 Å (Fernandez et al. 1995, Cohen & Kuhi 1979), and so is still accreting gas. Second, emission from warm (850 K) molecular gas is seen in the 4.7 µm =10 rovibrational emission lines of CO (Salyk et al., in prep.). This reservoir must be close to the star to reach such temperatures. Interestingly, no CO emission is detected from CoKu Tau 4, recently discovered to be a circumbinary disk with a 10 AU inner hole (Ireland et al., 2008).
One proposed process for quickly clearing the inner disk region is photoevaporation (Clarke et al. 2001, Alexander et al. 2006). An inner hole occurs when the photoevaporation rate driven by the ionizing flux from the central star matches the viscous accretion rate. However, this condition is only effectively fulfilled when accretion rates are low and would result in no gas or dust close to the star for gap radii of several tens of AU. Photoevaporation is thus unlikely to be responsible for the 40 AU radius gap observed in the LkH 330 disk. In contrast to photoevaporation, a recently proposed MRI-driven model predicts dust clearing, while substantial gas remains in the inner disk and accretion rates are high (Chiang & Murray-Clay, 2007). Such a model could account for the case of LkH 330, but a close examination of the accretion properties of the central star and the disk viscosity is still needed.
An alternative explanation to the physical removal of the dust is that it has grown beyond the size at which it efficiently radiates as a blackbody so that it no longer emits strongly in the mid-IR and submillimeter (Tanaka et al., 2005). Within any realistic distribution of dust grain sizes, even a minimum grain diameter of 50 µm significantly overproduces the flux in the 10 µm region with no density reduction. Thus, grain growth to very large sizes is needed for this scenario. The sharp cutoff in dust mass surface density between the inner and outer disk is also difficult to reconcile with dust coagulation models given the long orbital timescales and smooth variation in disk properties expected at 40 AU.
To summarize, LkH 330 presents a dramatic case of a disk evolving from the inside out rather than smoothly throughout the disk as would be expected in alpha-viscosity models of disk evolution. The 40 AU radius gap is largely empty of dust but gas does remain. The outer edge of the gap rises steeply, indicating an abrupt change in disk properties and limiting plausible explanations as to the origin of the gap. Importantly, the good agreement of both data and model lends confidence to current interpretations of SEDs with significant dust emission deficits as arising from disks with inner holes. Further SED-based searches can therefore be expected to yield numerous additional candidates that can be examined at high spatial resolution. Ultimately, in such studies it will be critical to not only image the dust but to provide estimates of the gas:dust ratios in the outer and inner disk if the different possible gap creation scenarios are to be disentangled. A combination of spatially resolved imaging, ultimately with the Atacama Large Millimeter Array (ALMA), to probe the dust and high resolution infrared through millimeter-wave spectroscopy to trace the gas content will provide the critical observational characterization needed for a quantitative understanding of these interesting objects.
References
- Alexander et al. (2006) Alexander, R. D., Clarke, C. J., & Pringle, J. E. 2006, MNRAS, 369, 229
- Alexander & Armitage (2007) Alexander, R. D. & Armitage, P. J. 2007, MNRAS, 375, 500
- Andrews & Williams (2007) Andrews, S. M. & Williams, J. P. 2007, ApJ, 659, 705
- Aumann et al. (1984) Aumann, H. H. et al. 1984, ApJ, 278, L23
- Beckwith (1996) Beckwith, S. V. W. 1996, Nature, 383, 139
- Beckwith et al. (1990) Beckwith, S. V. W., Sargent, A. I., Chini, R. S., & Guesten, R. 1990, AJ, 99, 924
- Brown et al. (2007) Brown, J. M. et al. 2007, ApJ, 664, L107
- Calvet et al. (2002) Calvet, N., D’Alessio, P., Hartmann, L., Wilner, D., Walsh, A., & Sitko, M. 2002, ApJ, 568, 1008
- Chiang & Murray-Clay (2007) Chiang, E. & Murray-Clay, R. 2007, Nature Physics, 3, 604
- Chiang & Goldreich (1997) Chiang, E. I. & Goldreich, P. 1997, ApJ, 490, 368
- Clarke et al. (2001) Clarke, C. J., Gendrin, A., & Sotomayor, M. 2001, MNRAS, 328, 485
- Cohen & Kuhi (1979) Cohen, M. & Kuhi, L. V. 1979, ApJS, 41, 743
- Crida et al. (2006) Crida, A., Morbidelli, A., & Masset, F. 2006, Icarus, 181, 587
- Dominik et al. (2003) Dominik, C., Dullemond, C. P., Waters, L. B. F. M., & Walch, S. 2003, A&A, 398, 607
- Draine (2006) Draine, B. T. 2006, ApJ, 636, 1114
- Dullemond & Dominik (2004) Dullemond, C. P. & Dominik, C. 2004, A&A, 417, 159
- Dullemond & Dominik (2005) —. 2005, A&A, 434, 971
- Enoch et al. (2006) Enoch, M. L. et al. 2006, ApJ, 638, 293
- Fernandez et al. (1995) Fernandez, M., Ortiz, E., Eiroa, C., & Miranda, L. F. 1995, A&AS, 114, 439
- Forrest et al. (2004) Forrest, W. J. et al. 2004, ApJS, 154, 443
- Ho et al. (2004) Ho, P. T. P., Moran, J. M., & Lo, K. Y. 2004, ApJ, 616, L1
- Ireland et al. (2008) Ireland, M., & Kraus, A. 2008, ApJ, submitted
- Marcy et al. (2005) Marcy, G., Butler, R. P., Fischer, D., Vogt, S., Wright, J. T., Tinney, C. G., & Jones, H. R. A. 2005, Progress of Theoretical Physics Supplement, 158, 24
- Mundy et al. (2000) Mundy, L. G., Looney, L. W., & Welch, W. J. 2000, Protostars and Planets IV, 355
- Osterloh & Beckwith (1995) Osterloh, M. & Beckwith, S. V. W. 1995, ApJ, 439, 288
- Rieke et al. (2005) Rieke, G. H. et al. 2005, ApJ, 620, 1010
- Sault et al. (1995) Sault, R. J., Teuben, P. J., & Wright, M. C. H. 1995, in ASP Conf. Ser. 77: Astronomical Data Analysis Software and Systems IV, ed. R. A. Shaw, H. E. Payne, & J. J. E. Hayes, 433–+
- Setiawan et al. (2008) Setiawan, J., Henning, T., Launhardt, R., Müller, A., Weise, P., & Kürster, M. 2008, Nature, 451, 38
- Strom et al. (1989) Strom, K. M., Strom, S. E., Edwards, S., Cabrit, S., & Skrutskie, M. F. 1989, AJ, 97, 1451
- Tanaka et al. (2005) Tanaka, H., Himeno, Y., & Ida, S. 2005, ApJ, 625, 414