Magnetic and Transport Properties of a Coupled Hubbard Bilayer with Electron and Hole Doping
Abstract
The single band, two dimensional Hubbard Hamiltonian has been extensively studied as a model for high temperature superconductivity. While Quantum Monte Carlo simulations within the dynamic cluster approximation are now providing considerable evidence for a -wave superconducting state at low temperature, such a transition remains well out of reach of finite lattice simulations because of the “sign problem”. We show here that a bilayer Hubbard model, in which one layer is electron doped and one layer is hole doped, can be studied to lower temperatures and exhibits an interesting signal of -wave pairing. The results of our simulations bear resemblance to a recent report on the magnetic and superconducting properties of Ba2Ca3Cu4O8F2 which contains both electron and hole doped CuO2 planes. We also explore the phase diagram of bilayer models in which each sheet is at half-filling.
I Introduction
The single band, two dimensional Hubbard Hamiltonian provides one possible microscopic model for pairing which is driven by electronic correlations rather than the interactions of electrons with the lattice. Many analytic and numeric numericreview treatments suggest that there may indeed be a superconducting phase at low temperature away from half-filling in this model. The issue is a difficult one, however, owing to the likely existence of a variety of different phases which are close in energy on the one hand, and the nature of the approximations made in the solution on the other. Exact diagonalization studies lin88 ; sorella , while very useful, are typically on lattices of only a few tens of sites, and hence finite size effects are a considerable concern. Quantum Monte Carlo (QMC) hirsch88 ; white89p , which can in principle address the issue in an unbiased way (on lattices an order of magnitude or more larger than diagonalization) has been unable to access sufficiently low temperatures due to the ‘minus sign problem’ loh90 .
Recently, progress has been made using improved numerical methods. The ‘density matrix renormalization group’ has pushed forward from one dimension to address geometries of many coupled chainsdmrg . The dynamic cluster approximation has improved on dynamical mean field treatments by showing the robustness of a finite temperature transition to a superconducing state as an increasingly fine momentum grid is incorporated in the self-energy dca . Nevertheless, there is still numeric work which contests the conclusion that the two dimensional Hubbard Hamiltonian has long range -wave pair correlationsimada07 .
In this paper, we present determinant Quantum Monte Carlo (DQMC) calculations of a bilayer Hubbard model for which we are able to attain much lower temperatures than the single layer case. Specifically, by doping the two layers symmetrically about half-filling, , we find that the sign problem is greatly reduced, allowing simulations at temperatures which are roughly two orders of magnitude below the bandwidth, . In single layer simulations of the doped system, the lowest attainable temperatures are . Previous DQMC studies of bilayer models have looked at the case when both layers are half-filled, and examined magnetic order-disorder transitions which occur as the interlayer hopping is increased scalettar94 . A decreasing interlayer hopping monotonically reduces the pairing correlations in this situation.
Our work is partially motivated by studies of Ba2Ca3Cu4O8F2 and Ba2Ca2Cu4O6F2 which are an experimental realization of materials in which electron and hole doped sheets coexist within the family of cuprate superconductors shimizu07 . In the former, four-layered compound, the two outer planes are electron-doped with , while the two inner planes are hole doped roughly symetrically, that is . The superconducting transition temperature is K, and pairing coexists with long range antiferromagnetic order with Néel temperature K. The latter, three-layered compound has outer plane doping , but a larger inner plane doping . Its superconducting K with only short range antiferromagnetic correlations. This is attributed to a decoupling of the magnetism of the electron doped outer planes by the large doping of the inner plane shimizu07 .
II Model and Methodology
In order to model such materials, we consider the two layer Hubbard Hamiltonian,
| (1) | |||||
The first term is the usual hopping of electrons between near neighbor sites and of a two dimensional square lattice. Unless otherwise stated, the results in this paper are for two coupled 8x8 lattices. The electrons in the kinetic energy term have a spin index and also a layer index . The second term is an interlayer hopping. The third term is a layer-dependent chemical potential. We will choose to produce layers which have opposite dopings. Finally, electrons of opposite spin on the same site of the same layer feel a repulsion .
Our simulations employ the DQMC algorithm blankenbecler81 ; white89p in which a path integral is written for the partition function, the fermion interactions are replaced by a coupling to an auxiliary Hubbard-Stratonovich field, and then the fermion degrees of freedom are integrated out analytically. The method produces exact results on the lattice sizes considered, apart from ‘Trotter’ errors associated with the imaginary time discretization, which we have verified are smaller than our statistical error bars.
The magnetic properties are determined from the spin-spin correlations,
| (2) |
which are independent of layer index because of our choice of symmetric doping and the particle-hole symmetry of the Hubbard Hamiltonian. The Fourier transform gives the structure factor,
| (3) |
At half-filling, is largest at the antiferromagnetic wavevector .
A first insight into the metal-insulator transition can be obtained from the zero momentum spectral function (density of states) which is determined from the Greens function,
| (4) |
using the maximum entropy method gubernatis .
The dc conductivity also characterizes the metal-insulator transition, and is measured from the current-current correlation function,
| (5) |
This imaginary time quantity, which comes directly out of the determinant QMC simulations, is related to the real frequency response by the fluctuation-dissipation theorem,
| (6) |
As discussed in [trivedi96, ], at sufficiently low temperatures we can replace by its low frequency behavior , leading to the relation,
| (7) |
This enables us to obtain the conductivity directly from the imaginary time response without the necessity for analytic continuation, which is more difficult for two particle response functions, like the current-current correlator, than for the single particle Greens function, owing to their larger fluctuations.
To describe superconductivity, we compute the correlated pair field susceptibility, , in different symmetry channels,
| (8) |
The correlated susceptibility takes the expectation value of the product of the four fermion operators entering Eq. 8. We also define the uncorrelated pair field susceptibility which instead computes the expectation values of pairs of operators prior to taking the product. Thus, for example, in the -wave channel,
| (9) |
includes both the renormalization of the propagation of the individual fermions as well as the interaction vertex between them, whereas includes only the former effect. Indeed by evaluating both and we are able to extract white89 the interaction vertex ,
| (10) |
If , the associated pairing interaction is attractive. In fact, rewriting Eq. 10 as,
| (11) |
suggests that signals a superconducting instability. We will discuss this criterion in more detail in the coming sections.
III Bilayer Phase Diagram at Half-Filling
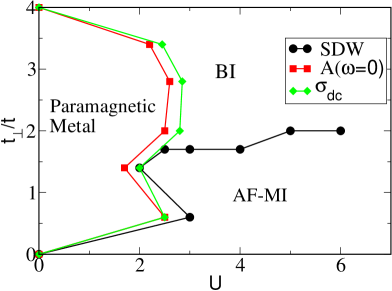
We begin with the phase diagram at half-filling, that is when , and both layers have equal occupation . (Note there is no sign problem in this case because of particle-hole symmetry.) Here we do not expect superconductivity. Nevertheless there is an interesting competition between Mott insulating behavior when is the dominant energy scale, and band insulating behavior for large . Indeed, increased interlayer coupling suppresses the antiferromagnetic correlations which are present in the Mott phase, since promotes the formation of interlayer singlets between the two spatial sites immediately above and below each other. These spin-0 singlets are magnetically decoupled, destroying long range spin order. Earlier determinant QMC studies determined the critical value of for this AF-PM transition scalettar94 .
The strong coupling region of Fig. 1 exhibits this phenomena, and yields a consistent with the earlier study scalettar94 . At weak coupling, however, this insulator-insulator transition is replaced by a metallic phase. Previous cluster DMFT kancharla07 studies of the bilayer model show a phase diagram which is in qualitative agreement with Fig. 1. We will compare the results of the two methods in more detail at the end of this section. First, we will describe in detail how this phase diagram is obtained.
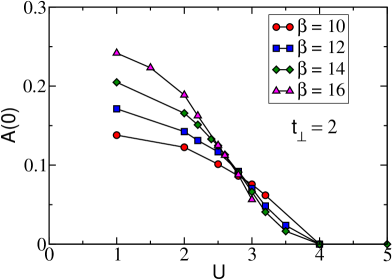
In Fig. 2 the density of states at the Fermi surface, is shown for four temperatures along a horizontal cut through the phase diagram at fixed . At weak coupling, the low temperature limit is non-zero, indicating a metallic phase, while at strong coupling, decreases as is lowered. We conclude that at the crossing point a metal-insulator transition occurs.
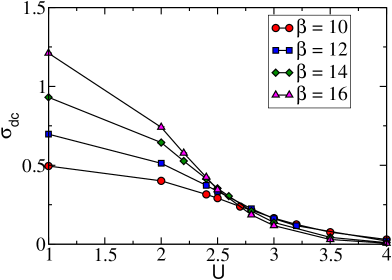
In Fig. 3 we see that the conductivity similarly can determine the location of the metal-insulator phase boundary. Here a change in the temperature behavior of the conductivity, from increasing as is lowered (metallic) to decreasing when is lowered (insulating) occurs at when the interlayer hopping is .
Multiple horizontal (constant ) cuts through the phase diagram similar to those of Figs. 2-3 were used to generate the metal-insulator phase boundary of Fig. 1. Note the consistency of the locations of the critical interaction strengths between those obtained from the density of states (red squares in Fig. 1) and the conductivity (green diamonds in Fig. 1).
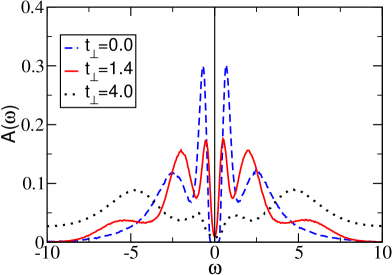
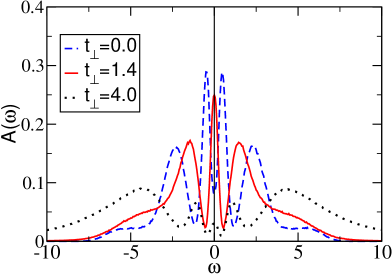
In this bilayer model, at half-filling , the suppression of the zero frequency spectral weight can come from any of three mechanisms: the opening of a band gap at sufficiently large , a “Slater gap” created by antiferromagnetic fluctuations which can form on a scale set by the exchange constant , and a “Mott gap” between the upper and lower Hubbard bands when exceeds the bandwidth . (The bandwidth at .) In general, these different insulating phases cross over to each other more or less smoothly, although the Slater insulator can be distinguished by the presence of long range spin correlations. Fig. 4 shows the full frequency dependence of the density of states at and three values of , all of which exhibit a gap in . (The non-zero residual values of for and will be driven to zero if is increased. See Fig. 2.) From Fig. 4 we infer that the phase diagram is insulating all along the vertical line in Fig. 1.
In contrast, Fig. 5, which shows the same three values of except at weaker coupling, , clearly exhibits metallic behavior for the intermediate value of the interlayer hopping. This is one indication of the outward extent of the metallic region from in the phase diagram of Fig. 1.
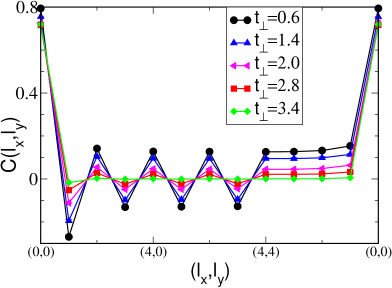
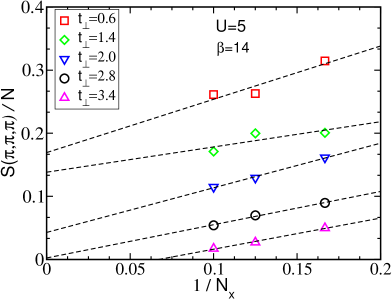
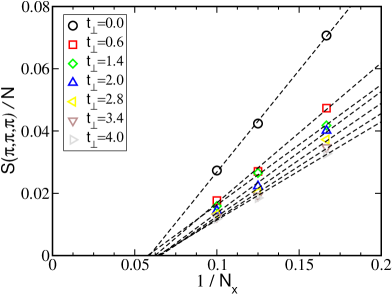
We turn now to the spin correlations. Fig. 6 shows the real space spin correlations for and different interlayer hoppings. drives the formation of interlayer singlets which interfere with the magnetic order. A finite size scaling analysis is shown in Fig. 7 where the structure factor is plotted as a function of the inverse linear system size. Spin wave theory predicts huse88 that the finite size corrections to should be linear in , with the intercept proportional to the square of the order parameter. We see that the order parameter is non-zero for and and is zero for and . Somewhere in the vicinity of , the long range magnetic order is destroyed. Fig. 8 shows a similar finite size scaling analysis for weaker coupling, . There is no long range magnetic order for any value of .
Multiple vertical (constant ) cuts through the phase diagram similar to those of Figs. 6-8 were used to generate the limit of the antiferromagnetically ordered regions of the phase diagram Fig. 1. This value is consistent with previous DQMC studies scalettar94 and cluster DMFT kancharla07 .
We conclude this section with a more quantitative comparison of Fig. 1 with the results obtained in cluster DMFT kancharla07 . At strong coupling, the AF insulator to paramagnetic (bond) insulator transition is found by both methods to have the same value . Likewise, in both approaches, the base of the metallic phase at extends from to , as indeed it must analytically from the non-interacting dispersion which has bonding and anti-bonding bands,
| (12) |
The extent of the metallic phase as increases from the non-interacting limit differs quantitatively in the two methods. The DQMC results reported here indicate an upper limit of , while within cluster DMFT the metallic region extends out to . The precise origin of this disagreement is not clear. The peak of the cluster DMFT metallic lobe follows the emerging AF-band insulator line rather narrowly, and it is possible DQMC cannot resolve this small region adequately. While the results of Figs. 2 and 4 seem unambiguously to rule out metallic behavior much beyond , they are on lattices of finite extent (=8x8). Cluster DMFT works in the thermodynamic limit and hence typically produces sharper transitions which can distinguish narrow regions of phase space. On the other hand, DQMC incorporates the full momentum dependence of the self-energy, in contrast to the 2x2 momentum grid used in cluster DMFT.
IV Superconductivity in the Doped System
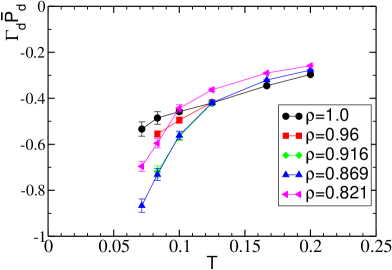
Fig. 9 shows a central result of our paper. The product of the -wave pairing vertex and the uncorrelated susceptibility, , is seen to turn sharply negative (attractive) as the temperature is lowered. As described in Eq. 11, in principle would signal a superconducting instability. For , . In comparison, the most negative reported white89 for the single band model is at half-filling, , and for doping to . It should be kept in mind, however, that the lowest accessible temperature in the latter case is . At the same and doping , as seen in Fig. 9, the bilayer system has a somewhat more negative . Thus the approach of to seen in the bilayer system is due both to a more attractive pairing vertex, but also due to the ability of the simulation to reach much colder temperatures.
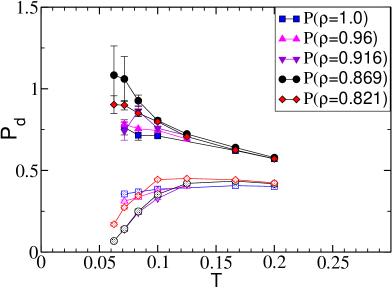
Although we find the vertex approaches -1, this criterion for an instability is incomplete. One also needs to require that the uncorrelated susceptibility remain finite at the transition point. Especially in the situation where there is competing order (e.g. antiferromagnetism and pairing) it is possible for the uncorrelated susceptibility of one type of order to be driven to small values by the other order, so that even though the vertex approaches -1, order in this channel is usurped. Fig. 10 addresses this issue for the bilayer model. Despite the fact that is getting close to , the correlated vertex grows relatively slowly as is decreased. The reason is clear from Fig. 10 in which it is seen that the uncorrelated susceptibility is rapidly dropping as is lowered. This is rather different from the doped single layer model, where grows as is lowered. (At half-filling in the single layer model declines slightly as is decreased, as found here also in the bilayer model.)
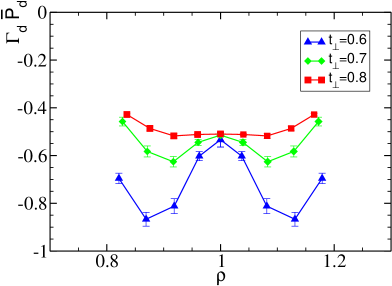
An interesting feature of Figs. 9 and 10 is that the -wave attraction is maximal at , whether measured via the vertex or the correlated susceptibility. This point is made more concretely in Fig. 11. The behavior of the -wave superconducting vertex bears an interesting resemblance to the superconducting “domes” of the cuprate materials in which the transition temperatures are maximized a finite distance away from “half-filling” (one hole per Cu). Indeed, even the values of the doping which maximizes and the width of the base of the dome are in reasonable quantitative agreement. It is to be emphasized that, within the same DQMC methodology, the single layer Hubbard model has a maximum pairing vertex at half-filling. Fig. 11 also indicates that, within the parameter range accessible, the degree of enhancement increases as decreases. Eventually we expect this trend to reverse, since at , the single layer model, there is a lesser tendency for pairing. (We cannot accumulate data for smaller values of because the sign problem prevents simulations at as low a temperature as for the data shown.)
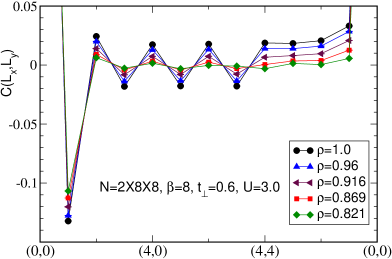
We turn now to the magnetic properties of the doped system and in particular their connection to those observed in the cuprate superconductors. Fig. 12 shows the real space spin-spin correlations for and at , , . These results have a quantitative similarity to the Ba2Ca3Cu4O8F2 and Ba2Ca2Cu4O6F2 materials in that the robust magnetic correlations present for and are dramatically suppressed for . A finite Neel temperature is present for the four layer compound Ba2Ca2Cu4O6F2 which has electron and hole dopings and absent for the three layer compound Ba2Ca2Cu4O6F2 which has hole doping in the central layer.
Why is the sign problem ameliorated in these bilayer simulations? In DQMC for the single layer Hamiltonian, the operator couples to the Hubbard Stratonovich field footnote shifted by the chemical potential . Meanwhile, couples to . At half-filling, , particle-hole symmetry is reflected in the fact that the up and down species couple to the quantities which are symmetric about zero. The up and down determinants can be shown to have the same sign, and hence their product is positive. For this symmetry and the associated connection between the signs of the two determinants is broken, and a sign problem results. (Note that for the attractive Hubbard Hamiltonian and both couple to and the two determinants are equal at all fillings.)
Consider now the bilayer system. We have a Hubbard-Stratonovich field for each layer. The operators couple to , while couple to , and couple to , and finally couple to , where we have explicitly set . What we observe is that, to the extent that the Hubbard-Stratonovich variables on the two layers are equal, and are symmetrically coupled about zero. It is possible that this tends to lead to a positive determinant product similar to the single layer case at half-filling. Of course, there is no constraint that , but we suspect that they are nevertheless sufficiently correlated to reduce the sign problem.
V Conclusions
In this paper we have used DQMC simulations to determine the phase diagram, in the plane, of the half-filled bilayer Hubbard model. Our phase diagram exhibits metallic, band insulating and Mott insulating phases in qualitative agreement with CDMFT resultskancharla07 . However, the entire metallic phase we find is paramagnetic with no antiferromagnetic metallic regions.
In addition, we have shown that the doped bilayer Hubbard Hamiltonian has an attractive -wave pairing vertex which approaches close to , signaling a superconducting transition. This value is much more singular than that observed in the single layer model, partly because it is more attractive when compared at the same inverse temperature, and partly because it is possible to simulate to values of which are two to three times larger than for a single plane. However, the uncorrelated gets small, so that the enhancement of the correlated is not very dramatic. On the other hand, and unlike what happens in the single layer Hubbard model, the enhancement here is maximum when the system is doped, in agreement with the phenomenology of cuprate superconductors.
Pairing in systems with separate electron and hole doped sheets has a long history in the context of exciton condensation balatsky04walsh06 , but our primary motivation here has been the recent report of cuprate-based systems Ba2Ca3Cu4O8F2 and Ba2Ca2Cu4O6F2 which have both types of dopings shimizu07 . Our results for the magnetic and pairing correlations bear interesting connections to those materials. While the bilayer simulations reported here contain the the essential feature of coupled electron and hole doped layers, it is natural to consider direct numerics of three and four layer compounds. Such studies will require an order of magnitude greater simulation time, and also have an at present unknown sign problem. In general the sign problem becomes worse with lattice size (and hence with number of layers), but it is tempting to speculate that, if the above picture of correlated determinant signs presented above is correct, similar correlations might provide protection for larger numbers of layers.
KB, FH, and GGB acknowledge financial support from a grant from the CNRS (France) PICS 18796, RTS from DOE-DE-FC0206ER25793. We acknowledge very useful help from M. Schram and K. Dawson. This research was supported in part by the National Science Foundation under Grant No. NSF PHY05-51164, and has been assigned KITP preprint number NSF-KITP-07-195.
References
- (1) D.J. Scalapino, “Handbook of High Temperature Superconductivity”, Chapter 13, J.R. Schrieffer, editor, Springer, (2006) and arXiv:cond-mat/0610710.
- (2) H.Q. Lin, J.E. Hirsch, and D.J. Scalapino, Phys. Rev. B37, 7359 (1988).
- (3) A. Parola, S. Sorella, S. Baroni, R. Car, M. Parrinello,, and E. Tosatti, Physica C162, 771 (1989).
- (4) J.E. Hirsch and H.Q. Lin, Phys. Rev. B37, 5070 (1988).
- (5) S.R. White, D.J. Scalapino, R.L. Sugar, E.Y. Loh, Jr., J.E. Gubernatis, and R.T. Scalettar, Phys. Rev. B40, 506 (1989).
- (6) E.Y. Loh, J.E. Gubernatis, R.T. Scalettar, S.R. White, D.J. Scalapino, and R.L. Sugar, Phys. Rev. B41, 9301 (1990).
- (7) S.R. White and D.J. Scalapino, Phys. Rev. Lett. 80, 1272 (1998).
- (8) M. Jarrell, Th. Maier, C. Huscroft, and S. Moukouri, Phys. Rev. B64, 195130 (2001).
- (9) Imada, http://xxx.lanl.gov/abs/0708.3416.
- (10) R.T. Scalettar, J.W. Cannon, D.J. Scalapino, and R.L. Sugar, Phys. Rev. B50, 13419 (1994); R.T. Scalettar, J. of Low Temp. Phys. 99, 499 (1995).
- (11) S. Shimizu, H. Mukud, Y. Kitaoka, A. Iyo, Y. Tanaka, Y. kodama, K. Tokiwa, and T. Watanabe, Phys. Rev. Lett. 98, 257002 (2007).
- (12) R. Blankenbecler, D.J. Scalapino, and R.L. Sugar, Phys. Rev. D24, 2278 (1981).
- (13) R.N. Silver, D.S. Sivia, and J.E. Gubernatis, Phys. Rev. B41, 2380 (1990).
- (14) N. Trivedi, R.T. Scalettar, and M. Randeria, Phys. Rev. B54, 3756 (1996).
- (15) S.R. White, D.J. Scalapino, R.L. Sugar, N.E. Bickers, and R.T. Scalettar, Phys. Rev. B39, 839 (1989).
- (16) S.S. Kancharla and S. Okamoto, Phys. Rev. B75, 193103 (2007).
- (17) D.A. Huse, Phys. Rev. B37, 2380 (1988).
- (18) Actually, it is likely the model exhibits long range order only at . Nevertheless, the correlations at decay very little with increasing separation. In a real material, even weak three dimensional coupling is likely to stabilize the magnetism.
- (19) Actually, the Hubbard-Stratonovich field also depends on imaginary time , a dependence we suppress in this discussion.
- (20) For two recent articles, see A.V. Balatsky, Y.N. Joglekar, and P.B. Littlewood, Phys. Rev. Lett. 93, 266801 (2004); and K.P. Walsh, A.T. Fiory, N.M. Ravindra, D.R. Harschman, and J.D. Dow, Phil. Mag. 86, 3581 (2006); and references cited therein.