2007 \SetConfTitleMemórias de la Reunión Regional Latino Americana de la UAI
The Star Formation Histories of galaxies: A tour through the STARLIGHT-SDSS database
Abstract
Retrieving the Star Formation History (SFH) of a galaxy out of its integrated spectrum is the central goal of stellar population synthesis. Recent advances in evolutionary synthesis models have given new breath to this old field of research. Modern spectral synthesis techniques incorporating these advances now allow the fitting of galaxy spectra on an Å-by-Å basis. These detailed fits are useful for a number of studies, like emission line, stellar kinematics, and specially galaxy evolution. Applications of this semi-empirical approach to mega data sets are teaching us a lot about the lives of galaxies. The STARLIGHT spectral synthesis code is one of the tools which allows one to harness this favorable combination of plentifulness of data and models. To illustrate this, we show how SFHs vary across classical emission line diagnostic diagrams. Systematic trends are present along both the star-forming and active-galaxy sequences. We also briefly describe experiments with new versions of evolutionary synthesis models. Last but not least, we announce the public availability of both STARLIGHT and a database of detailed spectral fits and related products for over half a million galaxies from the SDSS. This facility allows more physically inspired explorations of the parameter space than is possible in terms of raw observed properties, offering new ways to navigate through the realm of galaxies.
Recuperar la Historia de Formación Estelar (SFH) de una galaxia a partir de su espectro integrado es el objetivo central de la síntesis de población estelar. Recientes avances en modelos de síntesis evolutiva han dado un nuevo aliento a este viejo campo de investigación. Modernas técnicas de síntesis espectral incorporando estos avances hoy permiten el ajuste del espectro de una galaxia Å-por-Å. Estos ajustes detallados son útiles para un número de estudios, como líneas de emisión, cinemática estelar, y, por supuesto, evolución de galáxias. Aplicaciones de esta abordaje semi-empírica a mega bases de datos nos está enseñando mucho acerca de la vida de galaxias. El código de síntesis espectral STARLIGHT es una de las herramientas la cual permite explotar esa combinación favorable de datos y modelos. Como una ilustración, mostramos como la SFHs varían para galaxias en distintas regiones de un diagrama de diagnóstico clásico. Se detectan fuertes tendencias sistemáticas a lo largo de las secuencias de formación estelar y galaxias activas. Experimentos con nuevas versiones de modelos de síntesis son brevemente descritos. Por fin, anunciamos la disponibilidad pública tanto de STARLIGHT como una base de datos con ajustes espectrales detallados y productos relacionados para más de medio millón de galaxias del SDSS. Esta herramienta permite exploraciones físicamente inspiradas del espacio de parámetros, proporcionando nuevas maneras de navegar por el reino de galaxias.
H II regions \addkeywordISM: Jets and outflows \addkeywordStars: Pre-main sequence \addkeywordStars: Mass loss
0.1 Introduction
How do galaxies assemble their stars over time, i.e, how do they evolve? This broad question lies at the heart of a large number of astrophysical frontier-problems, from the internal physics of galaxies to cosmological issues. Theoreticians try to answer this question plugging in as much physics as they can in their models (see Abadi’s talk), while many observers tackle it using the expanding Universe as a time-machine, examining how galaxy properties change with redshift (e.g., Aretxaga’s talk). This contribution deals with what can be learnt from a third and independent method: Uncovering the fossil record of evolution from its imprints on galaxy spectra. This semi-empirical approach has become highly attractive in the past few years, given the avalanche of data from cosmologically shallow surveys, and the enormous progress in our ability to fit galaxy spectra on a pixel-by-pixel basis using state-of-the-art evolutionary synthesis models as those reviewed in Bruzual’s and Coelho’s contributions.
Taking full advantage of this favorable combination of abundance of data and models requires spectral synthesis tools to extract information about age (), metallicity () and the detailed star formation history (SFH) encoded in observed spectra. There are now several such tools around, differing in both technical and astrophysical aspects (eg, Mateu’s talk). Some account for extinction and/or kinematics, others don’t. Some impose simple - relations or use a fixed , while others treat and independently. Some model indices, others the full spectrum. Some fit the SFH in a non-parametric fashion, while others compare the data to a library of precomputed models. Some prefer to compress the input data, others the output parameters. The list goes on and on…We skip the impossible task of covering all this ground by referring the reader to two reviews by our group (astroph/071899 and 071902), dedicated to basic aspects of spectral synthesis and the recent literature in the field.
These few pages focus on results obtained with our STARLIGHT synthesis code. Rather than self-advertisement, this is done with the specific purpose of illustrating the sort of science doable with this code, specially when applied to mega data sets. The motivation for this is that both STARLIGHT and products of its application to all SDSS galaxies are now available for public use. In www.starlight.ufsc.br the reader will find the code itself, Å-by-Å fits for 573141 galaxies from the SDSS DR5 and a long and diversified list of derived properties (from stellar masses to emission line fluxes). This database is about to double with 694135 DR6 spectra fitted with new evolutionary synthesis ingredients.
We start with a quick introduction to STARLIGHT, its deliverables and our VO-like database (§0.2), including a first ever comparison of results obtained with DR5 data modeled with the standard Bruzual & Charlot (2003) models with DR6 data fitted with newer models. As an invitation to our database, we illustrate the power of our detailed spectral synthesis approach by showing how SFHs vary as a function of location on classical emission line diagnostic diagrams (§0.3).
0.2 The STARLIGHT/SEAGal Project
0.2.1 The code
STARLIGHT (Cid Fernandes et al. 2005) combines spectra from a user-defined base of individual populations in search of linear combinations which match an input observed spectrum. The fitted coefficients define an -dimensional population vector (light fractions at a reference ). For SFH studies it is useful to use a base of instantaneous bursts of different ’s and ’s, but anything else can be used. Kinematics is allowed for, as is reddening (according to any law). Papers by our Semi Empirical Analysis of Galaxies (SEAGal) collaboration discuss the code and the results of its application to 0.5M galaxies from the SDSS. For an in depth description of the code, its pros and cons and possible uses a detailed 45-pages long manual is available.
STARLIGHT itself outputs:
-
•
The full synthetic spectrum .
-
•
The light-fraction population vector .
-
•
A mass-fraction population vector (only meaningful for properly defined bases).
-
•
Stellar velocity dispersion () and shift ().
-
•
Stellar extinction ().
This is already enough for those interested in, say, stellar kinematics, or if all you need is a decent stellar template to subtract from your data to aid emission line work. In neither case you would care about nor . For galaxy evolution work, on the other hand, it is precisely the population vector which matters, since this is where the SFH information is. It can be handled in numerous ways to produce things like time dependent star formation rates, SFR(t).
0.2.2 The database: www.starlight.ufsc.br
In addition to the data listed above, our STARLIGHT-SDSS database contains a series of other products:
-
•
Emission line properties (fluxes, equivalent widths, widths, S/N) for many transitions, measured from the starlight-subtracted spectrum.
-
•
Stellar masses (), and mass-to-light ratios.
-
•
Summaries of the population vector, like mean stellar ages and metallicities.
-
•
Basic SDSS data, like coordinates, redshifts, magnitudes, sizes and images.
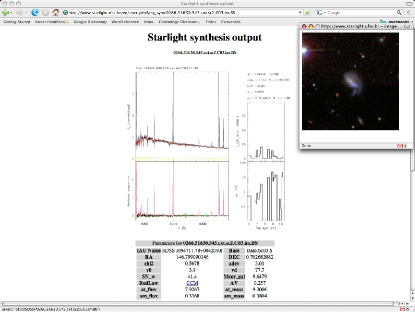
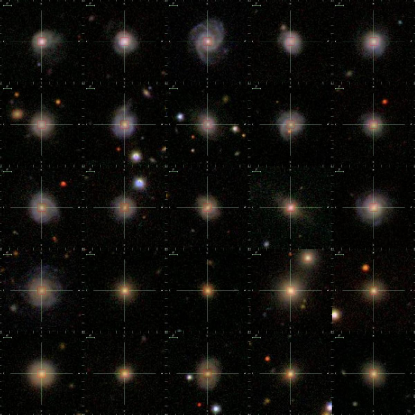
Fig. 1 shows a screen-shot of one object of a list produced with a SQL selection. The page contains the spectrum, the STARLIGHT fit and all that is known about the galaxy, as well as its SDSS thumbnail.111The whole interface was developed and is maintained by an undergrad student (W. Schoenell)! A particularly attractive feature is that one may search and select by any combination of physical and observed properties. This allows one to play all sorts of games. The bottom panel in Fig. 1 shows an example. We have selected galaxies within 0.05 dex of , and produced a mosaic of 25 images sorted according to the mean stellar age. The progression from late to early type morphologies is evident to the eye.
0.2.3 Elementary (but useful) warnings
It is never too much to emphasize the following obvious, but often overlooked, points: (1) The inversion from an observed spectrum to a set of parameters is far more complex and degenerate than one would hope. Yet, as long as one does not fall into the temptation of embracing over-detailed descriptions of SFHs, all modern synthesis methods seem to converge to the same overall result. Furthermore, averaging results over hundreds of galaxies greatly alleviates uncertainties in individual SFHs (Panter et al. 2007). (2) To go from an observed galaxy spectrum to a population vector and its associated SFH one must chose one among many possible bases. Evolutionary synthesis models themselves are undergoing constant revisions, approximately at the same rate of that of improvements in their two main ingredients: stellar tracks and spectral libraries—this very same volume contains 2 such updates! (3) Finally, observational data are never problem-free. We have chosen to fit anything spectroscopically classified as a galaxy in the SDSS! This includes quite a bit of garbage, which must be filtered out with appropriate quality flags.
0.2.4 New bases + new data = more work
There are news about points 2 and 3 in the above list. First, we point out that all published results by the SEAGal collaboration rely on the 2003 version of the Bruzual & Charlot models with the STELIB library and Padova 1994 tracks applied to over 0.5M SDSS DR5 spectra. But there is a lot more coming.
As discussed by G. Bruzual elsewhere in this volume, there are newer versions of these models, differing both in the treatment of late evolutionary phases and in the spectral libraries. We have carried out a series of experiments with some of these new models, and found that: (a) Not surprisingly, the new evolutionary tracks have negligible impact on our optical spectral synthesis (they only affect the IR). (b) Fits with the MILES library (Sánchez-Blázquez et al. 2006) provide substantial improvement with respect to those obtained with STELIB, particularly for old systems. Besides smaller spectral residuals, these new models correct some pathologies in the derived physical properties of passive/elliptical galaxies, like weird-looking distributions of sources in the - plane and (slightly) negative values of . Things are thus improving on the modelling front.
There are also news about the data: The SDSS reduction pipeline changed, and DR6 spectra are different in shape and amplitude from the DR5 ones.
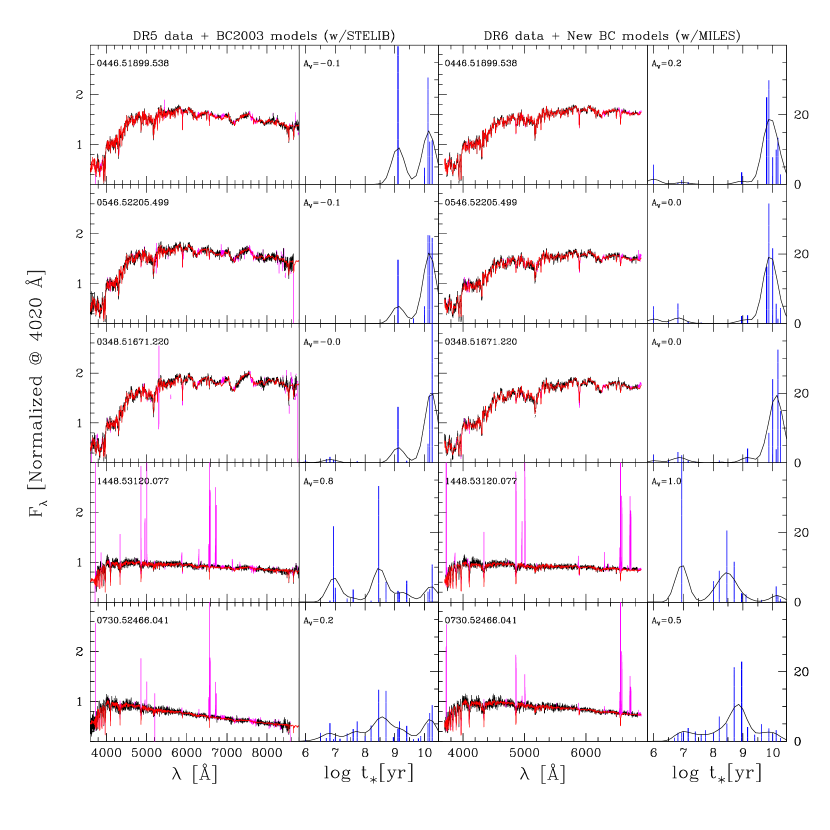
We have just finished fitting 694135 DR6 spectra with the new MILES-based models, and will soon incorporate these data to our database. Fig. 2 presents a preliminary comparison of old and new fits to three passive and two SF galaxies. Some of the changes mentioned above are visible in these examples. The similarities and differences revealed by practical tests like this provide useful feedback to model makers, and portray a summary of the degree of maturity in the field. While these new models represent a perceptible improvement, before jumping to conclusions one must realize that there are many others available, some of which address known deficiencies in standard models (like /Fe). Examining all possibilities and digesting the results will take time and patience. It will be particularly interesting to investigate the effects of different stellar evolution tracks, even if that requires extending the spectral domain beyond the optical (e.g., Eminian et al. 2008).
0.3 Star Formation Histories across the BPT diagram
Emission lines reflect the physical conditions of the ISM and the nature of the ionizing source. Since Baldwin, Phillips & Terlevich (1981), diagrams involving pairs of line ratios are used to diagnose galaxies as star-forming (SF) or active (Seyfert or LINER), and to derive properties like the nebular metallicity (), N/O ratio and ionization parameter. An interesting question to ask is: How do the SFHs of galaxies change across such diagnostic diagrams? Given that the ISM conditions are more a consequence than a cause of galaxy evolution, this question is kind of an exercise in reverse engineering.
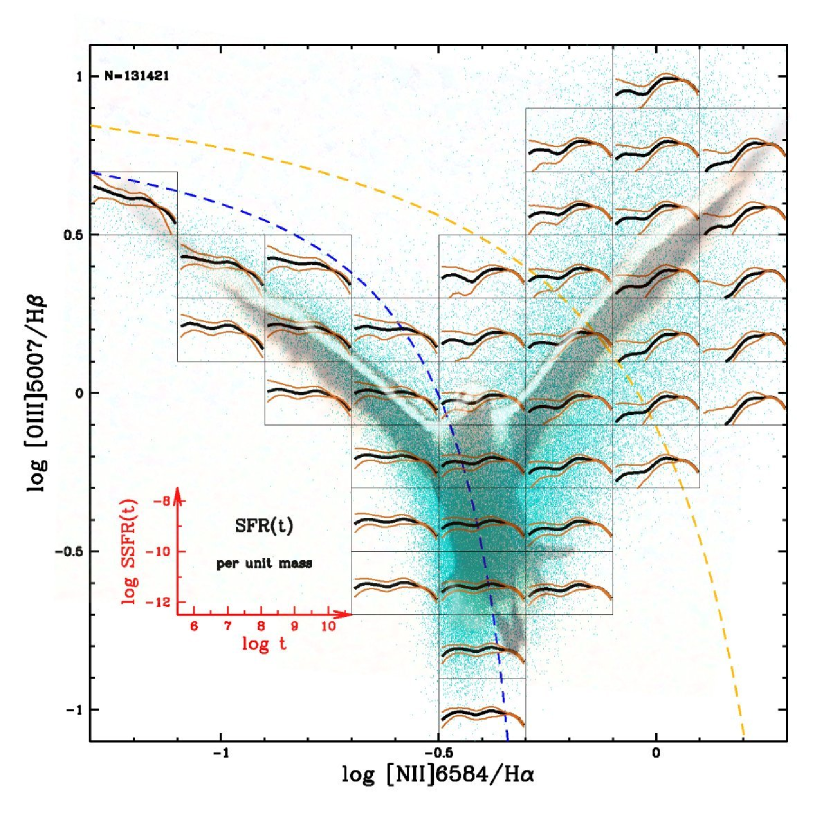
Fig. 3 shows the classical [O iii]5007/H vs. [N ii]6584/H BPT diagram. The background in this plot consists of emission line measurements for 131421 galaxies from our STARLIGHT-SDSS database). The SF and AGN sequences are clearly visible, branching out like the wings of a seagull. We have chopped this seagull into small boxes and computed the statistics of the -by- SFH within each box (like in Asari et al. 2007, but including AGN). The thick-black line shows the time evolution of the median Specific SFR (SSFR), whereas the thiner-brown lines are the 16 and 84 percentiles.
Systematic variations in the evolutionary pattern are seen all across the diagram. Along the left wing, for instance, all galaxies show current SF (as expected), but the balance between current and past SFR changes by over an order of magnitude. That is why galaxies at the top left, where low- galaxies live, look much younger than the metal-rich systems at the bottom of the sequence. Mass increases along this sequence (the - relation), so this pattern is ultimately a consequence of galaxy downsizing.
Strong trends are also evident in the AGN wing. The stellar population mixture becomes increasingly skewed toward older ages as one moves up the AGN wing, in good part due to aperture effects. Even concentrating only on the region far away from the body of the seagull (eg, beyond the Kewley line, where contamination by off nuclear SF regions is minimal), one sees trends: Seyfert 2s (upward in the plot) are systematically younger than LINERs. In most AGN the ongoing SF is but a fraction of what it has once been, and this fraction tends to zero as one walks the BPT diagram from the Seyfert to the LINER territories. Several other things change on the way too: and line luminosities go down, while , and /Fe increase.
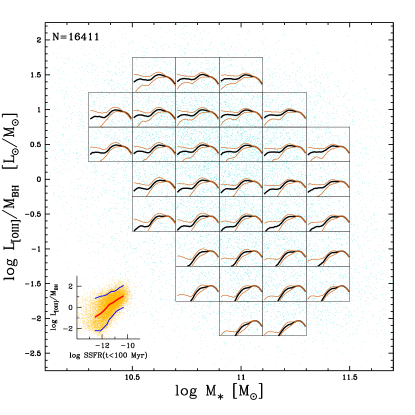
To have a closer look at this trend, Fig. 4 shows SFHs in the vs. plane, where is the indirectly computed black hole mass (from ). The y-axis discriminates between Seyferts and LINERs (Kewley et al. 2006), and is usually interpreted as a proxy for the Eddington ratio (Heckman et al. 2004). Only 16411 galaxies “pure AGN” are shown in this plot. Despite the relatively compressed scale (AGN live in massive galaxies), it is interesting to note that for a fixed the SFHs are essentially independent of galaxy mass. On the contrary, for any given the “Specific Black Hole Accretion Rate” (i.e., ) is obviously linked to the recent SFH: Black holes are growing more efficiently in galaxies which are forming stars more efficiently. This is shown more directly in the inset, which plots the relation between and the mean SSFR over the last 100 Myr.
A few years ago this would be called “the Starburst-AGN connection”. To find out whether this fits with negative AGN-feedback scenarios fashionable nowadays, read our next papers. Or else, do it yourself at www.starlight.ufsc.br!
References
- Asari et al. (2007) Asari, N. V. et al. 2007, MNRAS, 381, 263
- Baldwin et al. (1981) Baldwin, J. A., Phillips, M. M., & Terlevich, R. 1981, PASP, 93, 5
- Bruzual & Charlot (2003) Bruzual, G., & Charlot, S. 2003, MNRAS, 344, 1000
- Cid Fernandes et al. (2005) Cid Fernandes, R., Mateus, A., Sodré, L., Stasińska, G., & Gomes, J. M. 2005, MNRAS, 358, 363
- Eminian et al. (2008) Eminian, C., Kauffmann, G., Charlot, S., Wild, V., Bruzual, G., Rettura, A., & Loveday, J. 2008, MNRAS, 81
- Heckman et al. (2004) Heckman, T. M., Kauffmann, G., Brinchmann, J., Charlot, S., Tremonti, C., & White, S. D. M. 2004, ApJ, 613, 109
- Kewley et al. (2006) Kewley, L. J., Groves, B., Kauffmann, G., & Heckman, T. 2006, MNRAS, 372, 961
- Panter et al. (2007) Panter, B., Jimenez, R., Heavens, A. F., & Charlot, S. 2007, MNRAS, 378, 1550
- Sánchez-Blázquez et al. (2006) Sánchez-Blázquez, P., et al. 2006, MNRAS, 371, 703
- Stasińska et al. (2006) Stasińska, G., Cid Fernandes, R., Mateus, A., Sodré, L., & Asari, N. V. 2006, MNRAS, 371, 972