2INAF - IASF Milano, via E. Bassini 15, Milan, 20133 Italy
11email: polletta@iap.fr
Black hole growth and stellar assembly at high-z
Abstract
Context. Observations indicate a strong link between star formation and black hole (BH) growth, but some questions remain unanswered: whether both activities are coeval or whether one precedes the other, what their characteristic timescales are, and what kinds of physical processes are responsible for this interplay.
Aims. We examine stellar and BH masses (M∗ and MBH) in 2 active systems at the peak of their AGN or star formation activity to investigate how they are linked and whether AGN radiative or else radio power provides a feedback mechanism that regulates the stellar growth in these systems.
Methods. We analyze the infrared (IR) spectral energy distributions of radio, sub-millimeter and mid-IR selected AGNs at 1–3 and constrain their stellar and AGN luminosities using AGN and host-galaxy templates.
Results. We find evidence of increasing stellar light, thereby decreasing the AGN mid-IR power going from mid-IR selected AGNs, to radio galaxies, and to sub-millimeter AGNs. This trend can be explained by either decreasing Eddington ratios or increasing offsets from the local MBH–M∗ relation. All systems are characterized by high star formation rates regardless of their different AGN powers, thus neither AGN radiative power nor AGN-driven radio activity seems to influence the star formation rate in the selected AGNs. We discuss two possible evolutionary scenarios that might link these three AGN classes.
Key Words.:
Galaxies: active – Galaxies: evolution – Galaxies: high-redshift – quasars – Infrared: galaxies1 Introduction
A new paradigm has recently emerged in which galaxies and their black holes (BHs) grow in tandem, and BHs are responsible for regulating star formation (SF) through feedback processes and thus shaping many of the basic relationships between galaxy properties (e.g. Croton et al. 2006; Merloni & Heinz 2007; Balogh et al. 2001; Lin et al. 2003; Somerville 2004). Feedback processes are thought to be driven by AGNs, and they manifest themselves in outflowing winds or radio jets that can heat a significant fraction of the gas even, from the most massive dark-matter halos, and terminate the SF process in galaxies (Di Matteo et al. 2005; Croton et al. 2006).
Current evolutionary models predict that AGN-feedback takes place in obscured and extremely luminous AGNs (Hopkins et al. 2005) or in radio-loud AGNs (Croton 2006), especially at 2 where both BH accretion and SF activity peak (e.g. Giavalisco et al. 2004; Marconi et al. 2004). Although not in large numbers, these kinds of objects have been found in wide-area radio and infrared surveys, where the effects of obscuration are minimized and AGN signatures are clearly identified. Moreover, thanks to the advent of the Spitzer Space Telescope, it has become possible to study the multi-wavelength properties of these objects in detail (Ogle et al. 2006; Seymour et al. 2007; Sajina et al. 2007b; Polletta et al. 2008).
In this Letter, we compare the relative luminosity produced by stars and by AGN-heated dust in three classes of AGNs, high- radio galaxies (HzRGs hereinafter), sub-millimeter-detected AGNs (SMG/AGNs hereinafter), and IR-selected obscured QSOs (IsOQs hereinafter), to investigate whether these three classes represent members of the same population caught during different evolutionary stages, or whether they are the result of different histories and physical conditions.
2 Obscured AGNs at 2
HzRGs have been discovered due to to their large radio fluxes (10 mJy) in shallow wide surveys (e.g. NVSS, WENSS Condon et al. 1998; Rengelink et al. 1997). Since they are extremely rare, it is necessary to sample large volumes to find them. They are usually characterized by high excitation emission lines in the optical and strong mid-IR (MIR) emission, and their radio emission is dominated by non-thermal radiation from radio lobes. In the X-ray, they show both the contribution from a jet and an often absorbed component associated with the accretion disk (e.g. Seymour et al. 2007; Hardcastle et al. 2006).
IsOQs have been been discovered as bright (1 mJy) 24m sources in Spitzer surveys with faint optical counterparts (200; Houck et al. 2004; Yan et al. 2005). Their MIR SEDs are usually consistent with power-law or convex spectral shapes rapidly rising towards longer wavelengths, and they often display absorption due to silicates (Alonso-Herrero et al. 2006; Weedman et al. 2006; Polletta et al. 2006, 2008).
SMG/AGNs were first discovered in sub-millimeter surveys, and their AGN nature was revealed by their X-ray emission (Alexander et al. 2005b). X-ray observations indicate that these galaxies host moderately luminous and heavily absorbed AGNs. Their optical-IR emission is mainly dominated by the host-galaxy, and they are characterized by intense starburst activity (Borys et al. 2005; Alexander et al. 2005b, a).
For this work we selected 17 HzRGs from Seymour et al. (2007), 11 X-ray detected SMG/AGNs from Borys et al. (2005), and 21 IsOQs from Polletta et al. (2008). The three samples only include sources at 13. The median and redshift range of each sample are reported in Table 1. All luminosities were derived assuming H0 = 70, =0.3, and =0.7. Throughout the paper, the uncertainties associated to the median values correspond to the average deviation from the median.
2.1 Host stellar light and AGN accretion power
A common problem in AGN studies is to estimate the host-galaxy contribution to the bolometric luminosity and, especially, the stellar mass. Since the stellar emission peaks in the near-IR (NIR), typically at 1.6 m in the rest frame (or H-band), and the ratio between NIR luminosity and stellar mass (M∗) are characterized by little dispersion, the NIR luminosity is a proxy of the bulge mass or the luminosity of the host-galaxy. Note that the L(NIR)/M∗ depends on the SF history and age of the system, e.g. younger stellar populations can yield 30% lower stellar mass estimates than older stellar populations (e.g. Seymour et al. 2007). Since all selected objects are at similar redshifts and their AGN component does not dominate at NIR wavelengths, reasonable estimates of stellar emission and mass can be obtained from L(NIR). In IsOQs, the NIR stellar light is estimated after subtracting the AGN component. We used the NIR estimates from Polletta et al. (2008), where the IR SEDs are modeled with a combination of host and torus models. For the HzRGs, we used the estimates from Seymour et al. (2007) where the contribution from AGN-heated dust to the NIR is also removed. NIR luminosities were derived for the SMG/AGNs by fitting their SED (Borys et al. 2005) with galaxy templates. Stellar masses were derived from L(H) following the method in Seymour et al. (2007). The estimated NIR luminosities and corresponding stellar masses are reported in Figure 1.
The IR SEDs of HzRGs and IsOQs indicate that their MIR emission is dominated by AGN-heated dust. Since the MIR (i.e., at 5 m in the rest frame) is not significantly affected by dust extinction, and this is where the AGN-heated dust radiation peaks and where the emission from star forming galaxies shows a minimum, it can be considered a good proxy for AGN radiative power. For SMGs, the MIR luminosity is contaminated by the host-galaxy light, therefore it only provides an upper limit to the AGN power. MIR luminosities are available for the HzRGs from the literature (Seymour et al. 2007). For the IsOQs, they are estimated using the models in Polletta et al. (2008). For the SMG/AGNs, they are derived by fitting their SEDs, including 24 m data, with galaxy templates (see Polletta et al. 2007).
The stellar NIR luminosities of all selected sources are compared with the MIR luminosities in Figure 1.Note that the lack of IsOQs at L(MIR) L⊙ is due to the way these objects were selected (Polletta et al. 2008).
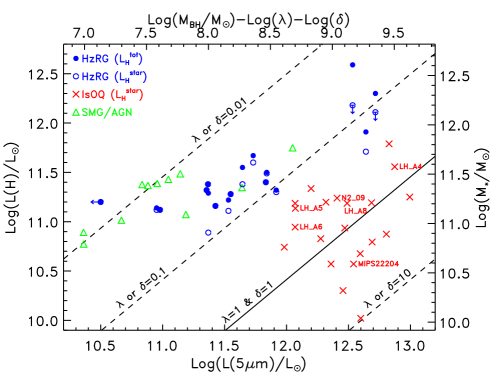
The selected AGNs are characterized by a broad range of NIR/MIR (stellar/AGN) luminosity ratios. Since the NIR luminosity is a proxy for stellar mass and the MIR luminosity a proxy for AGN power, the broad range of L(NIR)/L(MIR) (stellar/AGN) luminosity ratios indicate that the three classes of selected AGNs emit at different Eddington ratios or follow different MBH-M∗ relations. These two possible interpretations are explained below and illustrated in Figure 1. We consider the local correlation between the bulge mass and BH mass (Marconi & Hunt 2003) and a possible offset given by , i.e. Log(MBH) = 8.28+0.96(Log(M∗)10.9)+Log(), where MBH is the BH mass in M⊙, and M∗ the bulge mass in M⊙ derived from L(H). The BH mass can be derived from the MIR luminosity assuming an Eddington ratio (L/LEdd=) and a relationship between L(MIR) and the AGN bolometric luminosity, Log(L). The latter can be estimated using the following relation, Log(L) = Log(L(5m))+0.360.07, derived from the reprocessed thermal emission produced by the torus (Polletta et al. 2008). This relation might underestimate the AGN bolometric luminosity because it does not include the AGN absorbed radiation. For comparison, when using the unobscured AGN template from Elvis et al. (1994), which includes optical and far-IR components, Log(L) = Log(L(5m))+1.16.
Assuming the BH and stellar masses estimated as described above, we derived the expected NIR and MIR luminosities for different values of Eddington ratio () and of the offsets from the local MBH-M∗ relation () and report them in Figure 1. Note that all expected MIR luminosities would be higher by a factor 6.3 if the L–L(5m) relation from Elvis et al. (1994) was adopted. Note that these relations, as well the estimated masses, are characterized by large uncertainties. However, the uncertainties are smaller than the offsets observed among the three AGN samples, and all systematic uncertainties would shift all the values by equal amounts leaving the observed dispersion and offsets still present among the three AGN classes. Since our interpretation is based on such offsets rather than on absolute values, our results are not affected by these uncertainties.
The IsOQs show systematically higher L/LEdd ratios, consistent with being close to Eddington-limited, while HzRGs and SMG/AGNs are characterized by progressively lower Eddington ratios. Instead of different Eddington ratios, the different L(MIR)/L(H) luminosity ratios could be explained by different MBH–M∗ relations with different offsets from the local one. Assuming that all the selected AGNs are Eddington-limited would imply a relatively small offset (0.110) from the local MBH-M∗ relation in IsOQs and larger offsets in HzRGs and SMG/AGNs (0.010.5) and thus smaller BH masses than expected from the local relationship at parity of stellar mass. Indeed, Borys et al. (2005) find that SMG/AGNs are characterized by lower BH masses than expected from the local relationship assuming that they are Eddington-limited. Alternatively, they would lie on the MBH–M∗ relation if a lower Eddington ratio was assumed. In summary, the offset in L(H)–L(MIR) space between HzRGs and AGN/SMGs and the IsOQs can be attributed to a difference in L/LEdd ratios or to different offsets from the local MBH–M∗ relation.
In the next section, we derive the median SED of the three samples and model them with starburst and obscured AGN templates.
2.2 Obscured AGN infrared SEDs
In Figure 2, we plot the median SEDs of HzRGs, SMG/AGNs, and IsOQs after normalizing them at 5 m in the rest frame at the median MIR luminosity of each group. The median Log(L(5 m)/L⊙) is 12.470.23, 11.550.43, and 10.960.36 for IsOQs, HzRGs, and SMG/AGNs, respectively. The median and dispersion values are derived by regrouping the data points of the normalized SEDs in bins with a width of 0.12–0.2 in Log() or larger for less than 4 data points, or smaller for more than 18 data points. We also show the median template of an obscured QSO (Polletta et al. 2007), and the SED of the prototypical starburst (SB) galaxy M 82 (Silva et al. 1998). The SB template is normalized at the median stellar H-band luminosity of each group. The median Log(L(H)/L⊙) is 10.950.32, 11.320.24, and 11.370.21 for IsOQs, HzRGs, and SMG/AGNs, respectively. The QSO template is added after applying a certain degree of foreground extinction, 8, and normalized so that the sum of the QSO and the SB templates are consistent with the median SED of each group. We use the Galactic center extinction law by Chiar et al. (2006) extinction curve because it extends to the MIR and has been shown to reproduce the IR spectra of AGNs (Sajina et al. 2007a; Polletta et al. 2008). Note that the adopted range of extinction values, 8, corresponds to extreme dust opacities (up to hundreds of magnitudes) if a proper treatment of absorption and re-emission is considered as in radiative transfer models. Thus, the selected range represents both the extinction that could be produced by a dusty galaxy and an optically thick torus. The sum of the extincted QSO template and of the SB template is also shown in Figure 2.
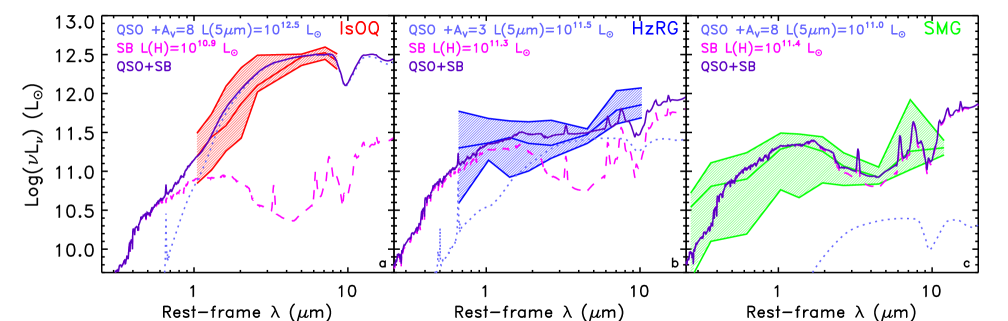
Figure 2 shows progressively higher stellar luminosities and weaker AGN radiative power in IsOQs, HzRGs, and SMG/AGNs. Motivated by recent models that predict feedback on SF and BH growth from AGN-driven radio activity (e.g. Croton et al. 2006), in the next section, we analyze whether the observed differences in stellar masses and AGN radiative power are related to the radio properties of the three AGN classes.
2.3 Radio properties
Radio fluxes are available for all HzRGs (Seymour et al. 2007) and SMG/AGNs (Borys et al. 2005), and for 6 IsOQs (Becker et al. 1995; Polletta et al. 2006; Sajina et al. 2007b). The radio luminosities and MIR/radio luminosity ratios of the 6 IsOQs are listed in Table 1, and their location shown in Figure 1. We also list median values and ranges for all 3 classes. For the HzRGs, we converted the radio luminosities at 3 GHz to 1.4 GHz assuming a power-law model with spectral index = 0.8 (Seymour et al. 2007), where . It is well-established that the radio emission in HzRGs is AGN-powered, while it is mainly due to SF activity in SMG/AGNs (Chapman et al. 2004). The two classes show very different radio fluxes, luminosities and L(MIR)/L(Radio) luminosity ratios. The HzRG L(MIR)/L(Radio) luminosity ratio is 10, and it is 104 in SMG/AGNs (see Table 1). Based on the ratio between the radio and the 24m luminosity (Donley et al. 2005), we find that one source (LH_A8) is radio-loud and 2 are radio intermediate (N2_09, and MIPS22204). For 3 of the 6 IsOQs with known radio fluxes, SFRs are also available from the measured far-IR luminosity, LH_A8, N2_09, and MIPS22204 (Polletta et al. 2008). In all 3 cases, the SFR derived from the radio luminosity (Condon 1992; Kennicutt 1998) is a factor of 10 or 100 higher than derived from the FIR luminosity. This difference indicates that the radio emission in some IsOQs might be mainly powered by the AGN. However, compared to HzRGs, IsOQs are less radio luminous, and they show higher MIR/radio luminosity ratios (see Table 1). The presence of AGN-driven intermediate radio activity in some IsOQs has also been found by a study on a sample of MIR selected sources that include some of the IsOQs in our sample and others at lower MIR luminosity (Sajina et al. 2007b). This study claims that some IsOQs are at the beginning of a radio-loud phase. In conclusion, we find a variety of radio properties and no significant correlation with the L(MIR)/L(NIR) ratio in the selected AGN samples.
2.4 Star formation rates
Recent evolutionary models also postulate an interplay between AGN activity and SF (e.g. Silk 2005). Interestingly, in spite of the difference in the stellar content, AGN power, and radio-activity in these systems, all SMG/AGNs, many HzRGs, and some IsOQs are characterized by high SFRs. The SFRs of 8 IsOQs, obtained using MIPS FIR (70, and 160 m) data, range from 600 to 3,000 M⊙ yr-1 (Polletta et al. 2008). Typical SFRs for SMG/AGNs range from 200 to 2,000 M⊙ yr-1 (Pope et al. 2006). HzRGs are also characterized by high SFRs, up to a few 1,000 M⊙ yr-1 (Reuland et al. 2004; Archibald et al. 2001). The similarity in SFRs can be interpreted as lack of evidence for radio activity or for AGN radiative power as regulators of SFR. This suggests either that AGN feedback does not take place as radio activity or AGN radiation, that its effects on the SFR are not observable yet, or that the feedback process does not act directly on the SFR. A similar result has recently been found by studying a sample of X-ray selected AGNs whose UV–NIR emission is dominated by stellar light (Alonso-Herrero et al. 2008). In this study, no evidence of either suppressed or elevated SF is found in galaxies with AGN activity compared to galaxies of similar stellar masses and redshifts, suggesting that AGN activity does not affect the SFR of their host-galaxies.
3 Discussion and conclusions
We analyzed the stellar/AGN luminosity ratio, the level of radio activity, and the SFR in three classes of AGNs at 2, IsOQs, HzRGs, and SMG/AGNs, to investigate the existence of a link between AGN-driven radio activity, the buildup of stellar mass, and BH growth. We find that these AGNs are characterized by a broad range of stellar/AGN (L(NIR)/L(MIR)) luminosity ratios. On average, SMG/AGNs and HzRGs have more massive hosts than the most luminous, obscured QSOs at similar redshifts. Such a broad range can be explained either by different Eddington ratios or by different MBH-M∗ relations.
Here, we have considered the possibility of an evolutionary link among these various AGNs, but we do not rule out the possibility that the various types of AGNs are the result of different evolutionary histories or physical states. Assuming that the stellar and BH mass can only grow, any link among these three classes of AGNs implies either that IsOQs will become less AGN-luminous and their hosts more massive, as observed in SMG/AGNs, or that SMG/AGNs will resemble IsOQs, as their AGN becomes more powerful (see e.g. Borys et al. 2005; Alexander et al. 2005a). This last hypothesis is not supported by the relatively low stellar masses measured in IsOQs. However, it is possible that our IsOQ sample is biased towards systems with particularly low-mass hosts, as they are selected on the basis of red optical-IR colors, we cannot rule out the latter scenario. On the other hand, the former scenario, evolution from IsOQs to SMG/AGNs, is quite plausible and supported by other observations. This scenario would imply that the bulk of stellar mass is still being assembled in IsOQs, while the bulge is at a more advanced stage in HzRGs and SMG/AGNs. HzRGs and SMG/AGNs might thus represent a later phase in the AGN evolution than are IsOQs. According to this scenario, fully grown BHs would already be in place in high- galaxies before the bulk of stellar mass was assembled. This scenario is also consistent with observations of unobscured QSOs at very high- (5) in which a fully grown BH and large reservoirs of molecular gas are present, but where spheroidal stars have not yet formed (Walter et al. 2004). Another supportive piece of evidence for this scenario is given by the younger stellar populations found in unobscured AGNs compared to radio galaxies (Kauffmann et al. 2008). However, this result has been obtained by studying low- samples where we can expect different processes to dominate and evolutionary sequences to take place. Better defined samples and more accurate stellar and BH masses are needed to distinguish the two possible scenarios or rule out any evolutionary link among the three selected AGN samples.
Finally, we want to underline the risks of assuming Eddington-limited AGN emission or the local MBH-M∗ relation in the study of AGN and galaxy evolution.
| Source name | L111The radio luminosities are from the deep VLA survey of the Lockman Hole (Polletta et al. 2006, Owen et al., in prep.) for LH_A4, LH_A5, LH_A6, and LH_A8, from the FIRST survey for N2_09, and from the VLA-FLS survey (Sajina et al. 2007b) for MIPS22204. The radio luminosities for the HzRGs and SMG/AGNs are from Seymour et al. (2007) and Pope et al. (2006), respectively. | Log | |
|---|---|---|---|
| (W Hz-1) | |||
| IsOQ/LH_A4 | 2.54 | 25.040.02 | 5.27 |
| IsOQ/LH_A5 | 1.94 | 24.540.02 | 4.97 |
| IsOQ/LH_A6 | 2.20 | 24.420.03 | 5.09 |
| IsOQ/LH_A8 | 2.42 | 26.710.02 | 3.22 |
| IsOQ/N2_09 | 1.98 | 25.690.03 | 4.15 |
| MIPS22204 | 2.08 | 25.680.02 | 4.30 |
| Median(IsOQ)222Includes only the 6 IsOQs with available radio data. The median redshift for the whole IsOQ sample is 2.230.31, and the redshift range is 1.29–2.96. | 2.140.19 | 25.680.68 | 4.970.61 |
| Range(IsOQ)b | 1.94–2.54 | 24.42–26.71 | 3.22–5.27 |
| Median(HzRG) | 1.900.53 | 27.890.48 | 1.110.37 |
| Range(HzRG) | 1.08–3.09 | 26.55–28.53 | 0.60–2.30 |
| Median(SMG/AGN) | 2.200.43 | 24.310.28 | 4.250.39 |
| Range(SMG/AGN) | 0.98–2.58 | 23.25–24.63 | 3.71–5.18 |
Acknowledgements.
We thank the referee for comments that improved the paper. We are grateful to C. De Breuck for providing HzRG data in electronic format and for comments, F. Owen for providing some of the radio data for the IsOQs and for comments, and S. Kassin for helpful discussions. MP acknowledges financial support from the Marie-Curie Fellowship grant MEIF-CT-2007-042111.References
- Alexander et al. (2005a) Alexander, D. M., Bauer, F. E., Chapman, S. C., et al. 2005a, ApJ, 632, 736
- Alexander et al. (2005b) Alexander, D. M., Smail, I., Bauer, F. E., et al. 2005b, Nature, 434, 738
- Alonso-Herrero et al. (2006) Alonso-Herrero, A., Pérez-González, P. G., Alexander, D. M., et al. 2006, ApJ, 640, 167
- Alonso-Herrero et al. (2008) Alonso-Herrero, A., Pérez-González, P. G., Rieke, G. H., et al. 2008, ApJ, accepted [astro-ph/0712.3121]
- Archibald et al. (2001) Archibald, E. N., Dunlop, J. S., Hughes, D. H., et al. 2001, MNRAS, 323, 417
- Balogh et al. (2001) Balogh, M. L., Pearce, F. R., Bower, R. G., & Kay, S. T. 2001, MNRAS, 326, 1228
- Becker et al. (1995) Becker, R. H., White, R. L., & Helfand, D. J. 1995, ApJ, 450, 559
- Borys et al. (2005) Borys, C., Smail, I., Chapman, S. C., et al. 2005, ApJ, 635, 853
- Chapman et al. (2004) Chapman, S. C., Smail, I., Windhorst, R., Muxlow, T., & Ivison, R. J. 2004, ApJ, 611, 732
- Chiar et al. (2006) Chiar, J. E., Adamson, A. J., Whittet, D. C. B., et al. 2006, ApJ, 651, 268
- Condon (1992) Condon, J. J. 1992, ARA&A, 30, 575
- Condon et al. (1998) Condon, J. J., Cotton, W. D., Greisen, E. W., et al. 1998, AJ, 115, 1693
- Croton (2006) Croton, D. J. 2006, MNRAS, 369, 1808
- Croton et al. (2006) Croton, D. J., Springel, V., White, S. D. M., et al. 2006, MNRAS, 365, 11
- Di Matteo et al. (2005) Di Matteo, T., Springel, V., & Hernquist, L. 2005, Nature, 433, 604
- Donley et al. (2005) Donley, J. L., Rieke, G. H., Rigby, J. R., & Pérez-González, P. G. 2005, ApJ, 634, 169
- Elvis et al. (1994) Elvis, M., Wilkes, B. J., McDowell, J. C., et al. 1994, ApJS, 95, 1
- Giavalisco et al. (2004) Giavalisco, M., Dickinson, M., Ferguson, H. C., et al. 2004, ApJ, 600, L103
- Hardcastle et al. (2006) Hardcastle, M. J., Evans, D. A., & Croston, J. H. 2006, MNRAS, 370, 1893
- Hopkins et al. (2005) Hopkins, P. F., Hernquist, L., Martini, P., et al. 2005, ApJ, 625, L71
- Houck et al. (2004) Houck, J. R., Roellig, T. L., van Cleve, J., et al. 2004, ApJS, 154, 18
- Kauffmann et al. (2008) Kauffmann, G., Heckman, T. M., & Best, P. N. 2008, MNRAS, submitted, [astro-ph/0709.2911]
- Kennicutt (1998) Kennicutt, Jr., R. C. 1998, ApJ, 498, 541
- Lin et al. (2003) Lin, Y.-T., Mohr, J. J., & Stanford, S. A. 2003, ApJ, 591, 749
- Marconi & Hunt (2003) Marconi, A. & Hunt, L. K. 2003, ApJ, 589, L21
- Marconi et al. (2004) Marconi, A., Risaliti, G., Gilli, R., et al. 2004, MNRAS, 351, 169
- Merloni & Heinz (2007) Merloni, A. & Heinz, S. 2007, MNRAS, 381, 589
- Ogle et al. (2006) Ogle, P., Whysong, D., & Antonucci, R. 2006, ApJ, 647, 161
- Polletta et al. (2007) Polletta, M., Tajer, M., Maraschi, L., et al. 2007, ApJ, 663, 81
- Polletta et al. (2008) Polletta, M., Weedman, D., Hoenig, S., et al. 2008, ApJ, 673, in press [astro-ph/0709.5548]
- Polletta et al. (2006) Polletta, M., Wilkes, B. J., Siana, B., et al. 2006, ApJ, 642, 673
- Pope et al. (2006) Pope, A., Scott, D., Dickinson, M., et al. 2006, MNRAS, 370, 1185
- Rengelink et al. (1997) Rengelink, R. B., Tang, Y., de Bruyn, A. G., et al. 1997, A&AS, 124, 259
- Reuland et al. (2004) Reuland, M., Röttgering, H., van Breugel, W., & De Breuck, C. 2004, MNRAS, 353, 377
- Sajina et al. (2007a) Sajina, A., Yan, L., Armus, L., et al. 2007a, ApJ, 664, 713
- Sajina et al. (2007b) Sajina, A., Yan, L., Lacy, M., & Huynh, M. 2007b, ApJ, 667, L17
- Seymour et al. (2007) Seymour, N., Stern, D., De Breuck, C., et al. 2007, ApJS, 171, 353
- Silk (2005) Silk, J. 2005, MNRAS, 364, 1337
- Silva et al. (1998) Silva, L., Granato, G. L., Bressan, A., & Danese, L. 1998, ApJ, 509, 103
- Somerville (2004) Somerville, R. S. 2004, in Coevolution of Black Holes and Galaxies, ed. L. C. Ho, 390
- Walter et al. (2004) Walter, F., Carilli, C., Bertoldi, F., et al. 2004, ApJ, 615, L17
- Weedman et al. (2006) Weedman, D., Polletta, M., Lonsdale, C. J., et al. 2006, ApJ, 653, 101
- Yan et al. (2005) Yan, L., Chary, R., Armus, L., et al. 2005, ApJ, 628, 604