MS, S and C Stars in the Infrared. Luminosities and Mass Loss Rates.
Abstract
In this note I present an outline of infrared (IR) photometric AGB properties, based on two samples of Galactic Long Period Variables (C- and S-type respectively). I show the various selection criteria used during the choice of the sources and describe the motivations of observing them at near- and mid-IR wavelengths. I discuss the problems encountered in estimating their luminosity and distance and motivate the methods I choose for this purpose. Properties of the luminosity functions and of the Hertzsprung-Russell (HR) diagrams obtained from the analysis are discussed. Finally, the choices made for estimating of the mass loss rates are described and preliminary results concerning them are shown.
Keywords:
Stars: AGB; Stars: Miras; Stars: Evolution; Stars: Luminosity; Stars: Mass Loss; Infrared:
97.20.Li; 97.30.Jm; 97.10.Cv; 97.10.Ri; 97.10.Me; 95.85.Hp1 Introduction
The Asymptotic Giant Branch (hereafter AGB) phase lies at the end of the active life for Low- and Intermediate-Mass Stars (mass between and ). In this stage their energy is released by two shells (burning H and He, respectively) that ignite alternatively. For more details about nucleosynthesis and the physical properties inside AGB stars see e.g. busso99 ; nollett03 ; wasserburg07 and references therein. Unfortunately, quantitative knowledge of crucial chemical and physical parameters of AGB sources is still poor; among the uncertain issues we emphasize particularly the mass loss rate and the estimate of stellar luminosity, which are hampered by the difficulties in measuring the distances for these dust-enshrouded objects.
We are currently performing an analysis of Galactic AGB stars of different chemical composition, looking for correlations between their basic parameters (bolometric luminosity, mass loss rate, photometric colors …). Our main aim is that of establishing observationally-based criteria permitting a more quantitative determination of mass loss rates and luminosities for the various types of AGB stars thus providing general rules that could help in the improvement of stellar codes.
Extensive samples of Galactic AGB stars (M, S-type, C-rich) have been collected. They must be large enough so that conclusions on them have a good statistical significance; they also need to have detailed and accurate Spectral Energy Distributions (SEDs) at near- and mid-IR wavelengths and, whenever possible, reliable measurements of mass loss rates and distances. Results of this research have been already published for carbon-rich stars (gua06 , hereafter Paper I), and are in press for S-type stars (guabus08 , hereafter Paper II).
In the following section (Section 2) we present the two samples analyzed in Paper I and Paper II, explaining in detail through which criteria they have been divided into the different sub-samples. In Section 3 we show the importance of performing observations of AGB stars at mid-IR wavelengths (at least up to 20 m). The methods adopted to estimate the luminosity and/or distance are described in Section 4. In Section 5 we discuss the results on luminosity functions and HR diagrams (in particular for S-type stars). In Section 6 we comment briefly on our choices to estimate mass loss rates and show the first results for S-type stars from our research. Finally, in Section 7 preliminary conclusions are derived.
2 Samples of AGB Stars
Two samples of AGB stars have been created to perform this analysis: one of carbon-rich sources (as discussed in Paper I) and the second of O-rich but s-element enhanced sources (S-type stars, as described in Paper II). Both samples have photometric observations available at mid-IR wavelengths (at least in the 8 m region). They are subsequently organized in sub-samples according to the quality and extension of the database available.
2.1 Carbon-rich Stars
AGB sources that have been considered in this sample are chemically carbon-rich. Moreover, they have at least one published estimate of the mass loss rate, done according to the criteria we consider most suitable for the purpose (see Section 6 for details).
We have divided the carbon stars into three sub-samples according to the available knowledge of their variability and distance:
- •
-
•
Sub-sample 2 (50 sources). Here the estimates of the distances derive from various methods (mainly from the application of the period-luminosity relations valid for C-rich stars). All the stars of this sub-sample are again of known variability types.
-
•
Sub-sample 3 (150 sources). These sources are the less studied of the whole sample. Their distances are computed through various methods, as found in the literature, the most commonly used being the one from groe2002 . They are all of ”unknown” variability types.
For a more extensive discussion of this sample of Galactic C-rich AGB stars the reader is referred to Paper I.
2.2 S-type Stars
In order to prepare the sample under analysis for the S-type Galactic stars, we started from the extended lists by steph1984 ; steph1990 , containing O-rich evolved red giants with known or suspected ”S star-like” chemical peculiarities. We selected a total of 600 sources for which measurements in the near-IR (from 2MASS) and in the mid-IR (from ISO, MSX or IRAS–LRS) are available. The chosen sources fall again into different categories, depending on the information we could collect on their IR colors, distance, variability type and period.
The S-type stars have therefore been organized in four sub-samples:
-
•
Sub-sample A (21 sources): stars with ISO-SWS observations at mid-IR wavelengths up to 45 m. They are fundamental for the calculation of bolometric corrections.
-
•
Sub-sample B (26 sources). These sources have mid-IR measurements from MSX and/or IRAS–LRS (not from ISO–SWS). Their distances are estimated astrometrically from Hipparcos measurements.
-
•
Sub-sample C (40 sources). This class contains only stars of Mira-type variability with reliable studies of their light-curves and therefore, good estimates of their period. Photometric observations in the mid-IR have been performed by MSX or IRAS–LRS. Distances are estimated through period-luminosity relations valid for O-rich stars (see Section 4).
-
•
Sub-sample D (500 sources). This class includes all the other sources. They have ”good” photometric observations at mid-IR wavelengths (at least 8.8 m) but we could not find estimates of the distance.
The four sub-samples are divided in further sub-categories according to:
-
1.
the spectral type (usually S, MS, (M)(S)111(M)(S) indicates an uncertain classification between the two classes above, SC, plus unknown sources and anomalous cases);
-
2.
the variability type (Mira, Semiregular, Irregular; unknown sources exist also in this case).
A detailed analysis of this large sample of S-type stars is presented in Paper II.
3 The importance of IR for AGB stars
Evolution during the AGB phase has many ”much-debated” topics: their study could be greatly helped by photometric observations at IR wavelengths.
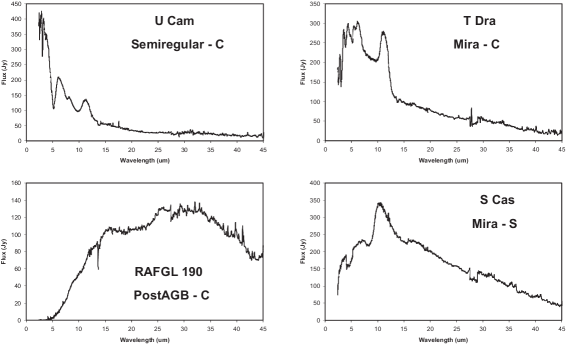
In particular, an extended wavelength coverage is fundamental in the exam of the SEDs of AGB stars. Indeed, Fig. 1 shows that evolved AGB stars (Mira variables and post-AGBs) emit large part of their flux at mid-IR wavelengths. This fact is particularly evident for C-rich sources, to the point that mid-IR observations are necessary to obtain good estimates of bolometric luminosity, that otherwise would be significantly underestimated.
AGB stars are characterized by strong variability at optical wavelengths. Variability of the flux at IR wavelengths is less relevant if compared with the optical region, because in IR the contribution from the dynamical photosphere is less relevant. However, IR variability is not negligible. Indeed, the few Mira sources that have been observed several times by ISO with the SWS spectrometer show remarkable fluctuations in the mid-IR region. By contrast, SR variables do not show any appreciable variation of the flux (see busso7 and its figures for more details). There is not yet an agreement on the origin and properties of this phenomenon: it needs to be examined in more detail in the mid-IR to understand its nature.
4 Luminosity and Distance
The SEDs from ISO-SWS available for the two samples of AGBs plus the near-IR photometric points (from 2MASS) can be integrated in order to infer a reliable (apparent) bolometric magnitude, making use of the relations of fundamental photometry (Glass, glass ). If we consider the S-type sample, the sources of the sub-sample A give us the tools for computing the bolometric corrections, which turn out to be tightly correlated with near-to-mid infrared colors and can be used for deriving accurate bolometric magnitudes for the stars of sub-sample B, where the ISO-SWS measurements are not available (see Paper II for details). The same approach was adopted in Paper I in analyzing C star luminosities.
With the procedure described above, we can compute the bolometric magnitude whenever a source has observations in at least one of the relevant IR colors.
S-type stars that belong to the sub-sample C offer the possibility of an independent way for estimating luminosities. In fact, their Mira variability, of known period, allows for the application of period-luminosity relations, yielding directly the absolute magnitudes.
Concerning period-luminosity relations, for Galactic C-rich Miras they have been computed by Whitelock et al. (see white2006 and references therein) and summarized in the relation:
| (1) |
where is the variability period of the Mira and is its absolute luminosity. Instead, searching a similar period-luminosity relation for the O-rich Miras (and also S-type stars) is definitely more difficult. In the literature there is no affordable, unique estimate of this relation. We choose (mainly for the sake of homogeneity) to follow the indications from Feast and Whitelock (see feast2004 and references therein for a general review on this topic). Obviously the P-L relation for O-rich Miras (and S-type stars) will be different from the one obtained for C-rich Miras. Our choice fell on two different P-L relations obtained using period correlations either to the absolute bolometric luminosity (white94 , Eq. 2) or to the absolute K-band luminosity (feast2004 , Eq. 3):
| (2) |
| (3) |
We made use of both methods, because they have both advantages and disadvantages. In principle Eq. 2 (from white94 ) would be probably the best relation available, as it involves directly. However, its last version is quite ”old” (1994, white94 ). Instead Eq. 3 (from feast2004 ) has been more recently updated and extensively examined feast2004 but gives us ”only” an estimate of the absolute magnitude in the K–band. We adopted both relations to calculate two independent estimates of distance:
-
•
First case – using Eq. 2. Here we find an estimate of the apparent bolometric magnitude through the bolometric corrections obtained in Paper II, then we compare it with the absolute bolometric magnitude from Eq. 2 to estimate the distance of the S Mira.
-
•
Second case – using Eq. 3. Here we apply a similar procedure comparing the apparent K–magnitude from 2MASS with the absolute K–magnitude from Eq. 3 to obtain another estimate of the S Mira’s distance.
Finally, we make an average between the two distance estimates and with the final result we calculate the absolute magnitude of the star applying the ”final” distance to the apparent bolometric magnitude obtained form our bolometric corrections. See Paper II for a more complete discussion of this topic.
We are trying to improve our knowledge on the variability properties of Mira and Semiregular AGB stars. One of the analyses that we are performing is centered on the re-observation of Maffei’s stars with Small–IRAIT, in order to confirm the periods and light–curves obtained by Maffei and Tosti (the catalogue is available online at http://astro.fisica.unipg.it/atlasmaffei/main.htm). See the contribution from Briguglio in this conference for more details brigu .
5 Luminosity Functions and HR Diagrams
Here we present few results obtained using the bolometric magnitudes computed through the methods presented in the previous section. We do not discuss in detail the luminosity function for Carbon stars because it has been already presented in Paper I. Here we remark only that, according to our data, Galactic C-rich AGB stars show luminosities in the range . This is in agreement with the theoretical predictions from the FRANEC model (see stran and the contribution from Cristallo, this conference). We don’t find any problem of underluminous C-rich stars, contrary to suggestions in the past (costafrogel , see also Paper I)
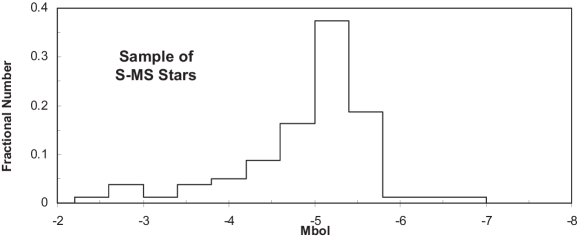
In Fig. 2 the luminosity function for the S-type stars from sub-samples A–B–C is shown. The spread in the luminosities for these 80 sources is again in agreement with the FRANEC models. The luminosities are in the range while the main peak is between -4.9 and -5.2: Galactic S stars seem to be on average only slightly less luminous of the C-rich ones. At this stage we cannot say whether this apparent difference is statistically significant: in fact, the two Luminosity Functions are overlapping. It is clear that attributing the spectral distinction among the classes MS–S–SC–C to a simple evolutionary sequence, is not sufficient.
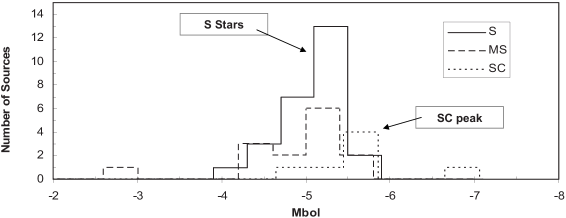
We divide the sample used for the luminosity function of Fig. 2 in three sub-groups according to the different spectral types (S–MS–SC). In this way we obtain three luminosity functions that are shown in Fig. 3. The S stars present a peak in their distribution in the range , the SC stars occupy the high luminosity tail of the distribution with a peak at magnitudes around -5.6. Instead, the MS sample is overlapping both the S and SC sub-groups without a well-defined peak.
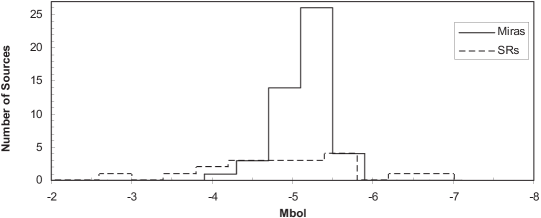
Figure 4 shows other luminosity functions. However in this case the sample of S-type stars has been divided according to the variability type of the sources (Mira or Semiregular). The Mira’s Luminosity Function presents a well defined peak and cover mainly the range between -4.8 and -5.5. On the other hand, the distribution of Semiregulars is more or less uniform over all the range of luminosities.
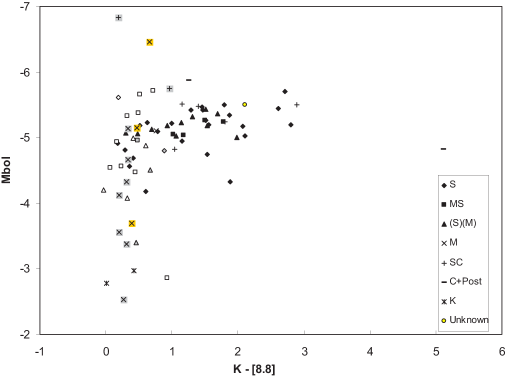
Finally, we present in Fig. 5 a preliminary result on the S-star HR diagram, adopting a near-to-mid-IR color as the abscissa. We refer to Paper II for a more complete discussion. Here we emphasize a few main features after dividing the points according to the spectral classification and the variability types. We note that semiregular S stars are essentially unreddened, while the Miras do show some reddening. However, if we compare S stars with the Carbon-rich sample (see Paper I), C stars are in general more deeply enshrouded by dust.
6 Mass Loss
As a last topic of this contribution we present a rough analysis of mass loss rates from AGB stars including a preliminary result for the S-type stars. For C-stars see Paper I.
Longstanding efforts have been devoted to describe the mass loss mechanisms, either with phenomenological models or with sophisticated hydrodynamical approaches salpeter ; knappmorris ; winters03 ; wachter02 . Despite this, our quantitative knowledge of AGB winds is still poor. Our choice has been that of using mass loss rates available form the literature. We considered only those computed through observations at radio-wavelengths of the CO lines: this type of approach is known to give an estimate of the ”average” rate of the AGB source’s stellar wind, integrated over a long time. We upgraded the estimates of the mass loss rate adopting updated measurements of the distance or, in the case of the S-type sample (see Paper II) giving directly our estimate of the distance through the use of the Period-Luminosity relations (see also Section 4).
The approaches to obtain mass loss estimates through the observations of CO lines that are available in the literature are several. In particular we adopt:
- 1.
- 2.
-
3.
Third Choice: the method used by Groenewegen et al. (groe1998 for S stars, groe2002 for C-rich stars). Here a constant size for the CO envelope is adopted for all the sources. However, this method is more reliable for stars with an optically thick CO emission. Due to this fact this method can sometime underestimate the wind efficiency by factors 3–4 (as said by schoier ).
The analysis performed on the carbon-rich sample is shown in Paper I.
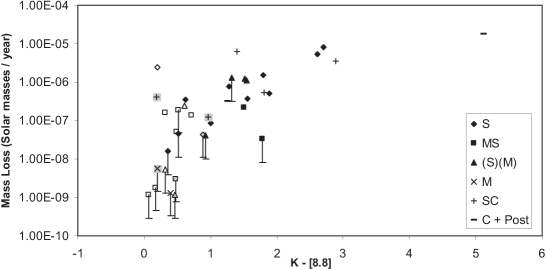
Figure 6 displays a preliminary result obtained plotting the mass loss rates against a near-to-mid-IR color (the same one already used as abscissa of Fig. 5) in the case of the sample of S-type stars. The sources show a behaviour similar to the one already analyzed in the C-rich sample (see Paper I); here we remark a few main properties: 1) Miras have stronger mass loss rates and are redder if compared with Semiregulars and Irregulars; 2) a relation of the same type as found for C stars exists for S-stars suggesting the association of strong mass loss with strong IR excess for AGB stars of any type, as expected is the wind is driven by radiation pressure on dust grains; 3) this relation, if real, is however very scattered for both samples; 4) van Loon et al. vanloon2005 have suggested that the mass loss rate should be expressed as a function of both the bolometric luminosity and the stellar effective temperature (photometric color); 5) we remind that mass loss processes in AGB stars are surely not ”simple”: the large variations of the mass loss rates, due to different causes, that occur during the AGB phase certainly contribute largely to the scattering that we see in Fig. 6. Finally, we remark that there is no clear distinction in the mass loss rates of S-type and C-rich stars, but carbon stars become much redder by a large factor (see Paper I and Paper II).
7 Conclusions
We have analysed two sample of Galactic AGB stars: the first is made of carbon rich sources and the second one of S-type stars. We looked for methods to obtain reliable estimates of luminosities and distances (bolometric corrections and Period–luminosity relations). The problem of the large IR excess typical of evolved AGBs has been shown together with its implications in the estimates of the stellar luminosity.
C- and S-stars Luminosity Functions are in the ranges -4.5/-6 and -4.2/-5.7 respectively (in agreement with expectations from the FRANEC model). The Luminosity Functions of the two samples are overlapping (with S stars being slightly less luminous). It is clear that attributing the spectral distinction among the classes MS–S–SC–C to a simple evolutionary sequence, is not sufficient.
SC stars occupy the high luminosity tail of the S-type stars distribution. It is highly uncertain if this is due to evolutionary properties. Semiregular S stars are essentially unreddened and S stars in general are less reddened than C stars.
There is no clear distinction between S and C classes in what concerns the relation of mass loss rates to near-to-mid-IR colors, but C stars become much redder. High-reddened C stars (evolved Miras and post-AGBs) possibly lose more mass than S stars but the scatter and the uncertainties of the rates are large.
References
- (1) M. Busso, R. Gallino, and G.J. Wasserburg, ARA&A 37, 239 (1999)
- (2) K.M. Nollett, M. Busso, and G.J. Wasserburg, ApJ 582, 1036 (2003)
- (3) M. Busso, G.J. Wasserburg, K.M. Nollett, and A. Calandra ApJ 671, 802 (2007)
- (4) R. Guandalini, M. Busso, S. Ciprini, G. Silvestro, and P. Persi A&A 445, 1069 (2006) [Paper I]
- (5) R. Guandalini and M. Busso, A&A in press (2008) [Paper II]
- (6) J. Bergeat, A. Knapik, and B. Rutily, A&A 390, 967 (2002)
- (7) J. Bergeat and L. Chevallier, A&A 429, 235 (2006)
- (8) M.A.T. Groenewegen, M. Sevenster, H.W.W. Spoon, and I. Pérez, A&A 390, 511 (2002)
- (9) C.B. Stephenson, ”A General Catalogue of Galactic S-Stars - ED.2”, Publ. of the Warner & Swasey Observatory 3, 1 (1984)
- (10) C.B. Stephenson, AJ 100, 569 (1990)
- (11) M. Busso, R. Guandalini, P. Persi, L. Corcione, and M. Ferrari-Toniolo, AJ 133, 2310 (2007)
- (12) I.S. Glass, ”Handbook of Infrared Astronomy”, Cambridge University Press (1999)
- (13) P.A. Whitelock, M.W. Feast, F. Marang, and M.A.T. Groenewegen, MNRAS 369, 751 (2006)
- (14) M. Feast, ASP Conference Proceedings 310, 304 (2004)
- (15) P. Whitelock, et al., MNRAS 267, 711 (1994)
- (16) R. Briguglio, this conference (2008)
- (17) O. Straniero, I. Domínguez, S. Cristallo, and R. Gallino, PASA 20, 389 (2003)
- (18) E. Costa and J.A. Frogel, AJ 112, 2607 (1996)
- (19) E.E. Salpeter, ApJ 193, 585 (1974)
- (20) G.R. Knapp and M. Morris, ApJ 292, 640 (1985)
- (21) J.M. Winters, T. Le Bertre, K.S. Jeong, L. -Å. Nyman and, N. Epchtein, A&A 409, 715 (2003)
- (22) A. Wachter, K.-P. Schröder, J.M. Winters, T.U. Arndt, and E. Sedlmayr, A&A 384, 452 (2002)
- (23) F.L. Schöier and H. Olofsson, A&A 368, 969 (2001)
- (24) H. Olofsson, D. González Delgado, F. Kerschbaum, and F.L. Schöier, A&A 391, 1053 (2002)
- (25) S. Ramstedt, F.L. Schöier, H. Olofsson, and A.A. Lundgren, A&A 454, L103 (2006)
- (26) C. Loup, T. Forveille, A. Omont, and J.F. Paul, A&AS 99, 291 (1993)
- (27) M.A.T. Groenewegen and T. de Jong, A&A 337, 797 (1998)
- (28) J.Th. van Loon, M.-R.L. Cioni, A.A. Zijlstra, and C. Loup, A&A 438, 273 (2005)