Avalanches of Activation and Spikes in Neuronal Complex Networks
Abstract
As shown recently (arXiv:0801.3056), several types of neuronal complex networks involving non-linear integration-and-fire dynamics exhibit an abrupt activation along their transient regime. Interestingly, such an avalanche of activation has also been found to depend strongly on the topology of the networks: while the Erdős-Rény, Barabási-Albert, path-regular and path-transformed BA models exhibit well-defined avalanches; Watts-Strogatz and geographical structures present instead a gradual dispersion of activation amongst their nodes. The current work investigates such phenomena by considering a mean-field equivalent model of a network which is strongly founded on the concepts of concentric neighborhoods and degrees. It is shown that the hierarchical number of nodes and hierarchical degrees define the intensity and timing of the avalanches. This approach also allowed the identification of the beginning activation times during the transient dynamics, which is particularly important for community identification (arXiv:0801.4269, arXiv:0801.4684). The main concepts and results in this work are illustrated with respect to theoretical and real-world (C. elegans) networks. Several results are reported, including the identification of secondary avalanches, the validation of the equivalent model, the identification of the possible universality of the avalanches for most networks (depending only on the network size), as well as the identification of the fact that different avalanches can be obtained by locating the activation source at different neurons of the C. elegans network.
pacs:
87.18.Sn, 05.40Fb, 89.70.Hj, 89.75.Hc, 89.75.Kd‘I have also thought of a model city from which I deduce all the others.’ (Invisible Cities, I. Calvino)
I Introduction
Investigations addressing the relationship between structure and dynamics have become increasingly important in several scientific areas, from neuroscience (e.g. Ascoli (1999); da F. Costa (2005)) to complex networks (e.g. Newman (2003); Boccaletti et al. (2006)), and more recently to both these areas (e.g. Stauffer et al. (2003); da F. Costa and Stauffer (2003); da F. Costa (2005); Kim (2004); Memmesheimer and Timme (2006); Osipov et al. (2007); Hasegawa (2004, 2005); Park and Kim (2006)). While a great deal of attention has been recently focused on investigations or relationships between linear synchronization and network topology (e.g. Boccaletti et al. (2006); Hong et al. (2004); Lee (2005); Zhou et al. (2006); Boccaletti et al. (2007); Nishiwaka and Motter (2006); Sorrentino et al. (2007); Almendral and Guilera (2007)), relatively lesser attention has been directed towards studying the structure-dynamics paradigm by considering non-linear and/or transient regimes. In a recent series of articles da F. Costa (2008a, b, c), the transient dynamics of complex neuronal networks composed of simple integrate-and-fire neurons has been shown to yield a series of remarkable effects, including avalanches of activation da F. Costa (2008a) and activation confinement inside topological communities da F. Costa (2008b, c).
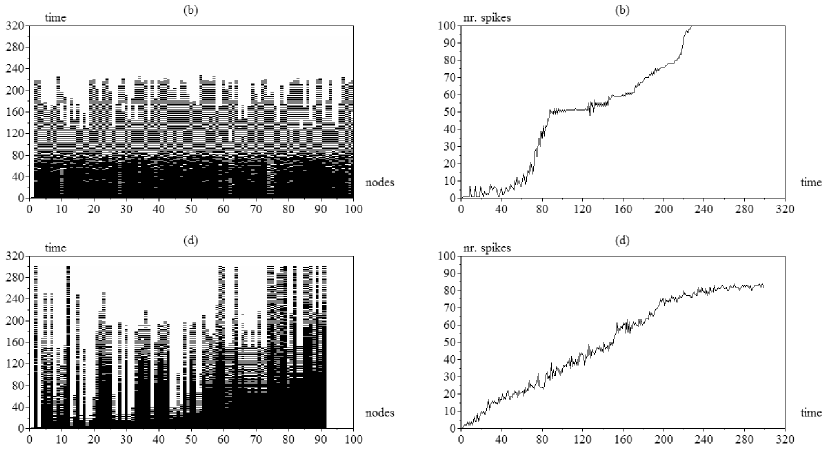
As external activation is fed into the network through a selected node, which acts as a source, it spreads through the network in a way which is highly dependent on the network topology. While Watts-Strogatz (WS) and geographical (GG) networks are characterized by more progressive, gradual dispersion of the activation from the source to the other nodes, Erdős-Rényi (ER), Barabási-Albert (BA), path-regular 111This type of network exhibits a particularly regular structure (almost identical degree for each node), being composed of paths proceeding through all network nodes, without repetition da F. Costa (2007a). (PN) and path-transformed BA networks (PA) structures yield an abrupt onset of activation after some initial time steps, after which the whole network becomes intensely activated da F. Costa (2008a). Figure 1 illustrates this phenomenon with respect to the total number of spikes along time obtained for the transient activation period (300 initial steps) in a PN (Fig. 1a-b) and a GG (Fig. 1c-d) with similar sizes and average degrees. Observe the presence of a secondary avalanche taking place at later times for the PN case (Fig. 1a-b).
In addition, the times for each neuron to receive the first non-zero activation, through synapses, were found to be particularly related to the community organization of networks da F. Costa (2008b). These findings have several implications for biological and computational neuroscience and community identification, including the fundamental role that the integration-and-fire dynamics have for confinement of activation within neuronal modules, avoiding widespread activation of whole neuronal areas. The important point here concerns the simultaneous localization of neuronal activity along time and space implied by the non-linearities. However, these results represent particularly interesting subjects also for more basic investigations.
The present work reports a combined theoretical and experimental analysis of the activation dynamics in complex networks of varying types by considering two fundamental concepts. First, the concentric (or hierarchical 222Though the name hierarchical was initially (e.g. da F. Costa (2004); da F. Costa and Andrade (2007); da F. Costa and Silva (2006); da F. Costa and da Rocha (2005)) used to express the successive neighborhoods around each node of a complex network, the term concentric was later also adopted in order to distinguish from hierarchical networks (e.g.Ravasz and Barabási (2003)). Both these terms are used in this work.) neighborhoods around the source node are identified and characterized in terms of the respective number of nodes, hierarchical degree and intra-ring degree da F. Costa (2004); da F. Costa and Andrade (2007); da F. Costa and Silva (2006); da F. Costa and da Rocha (2005). Such a concentric representation of the original network is fundamental for the study of complex neuronal network dynamics because the activation in such non-linear systems progress precisely along the concentric neighborhoods. The concentric representation of the original network is then used to derive an equivalent mean-field model of the original network, namely a chain complex neuronal network. It is shown analytically that the avalanches of activation along the transient regime of the integrate-and-fire neuronal networks is an immediate consequence of the number of nodes at each concentric level.
This article starts by briefly reviewing the main complex neuronal network concepts, the adopted 7 theoretical models of complex networks, as well as the concentric representation of networks and respective hierarchical measurements. It proceeds by developing the mean-field equivalent model and by showing the intrinsic relationships between the hierarchical structure of networks and the properties of the avalanches. This approach also allowed important results regarding the characterization of the beginning activation times, which have been found to be intrinsically related to community structure da F. Costa (2008b, c).
II Basic Concepts
A undirected complex network with nodes can be represented in terms of its respective adjacency matrix , such that the presence of an edge between nodes and is represented as , with being otherwise imposed. The immediate neighbors of a node are those nodes which share an edge with , i.e. are at distance 1 from . The degree of a node , henceforth represented as , is equal to the number of its immediate neighbors. In a directed network, the in-degree of a node is defined as being equal to the number of incoming edges, while the out-degree corresponds to the number of outgoing edges. Two nodes are said to be adjacent if they share an edge. Two edges are adjacent if they share a node. A walk is any linear sequence of adjacent edges. A path is a walk which never repeats any node or edge. The length of a walk (or path) corresponds to its respective number of edges.
The h-neighborhood of a node is the set of nodes which are at shortest path distance of edges from node . Such successive neighborhoods define the concentric (or hierarchical) levels of the network with respect to the reference node . The number of nodes in such a neighborhood is henceforth represented as . Each of such nodes is an h-neighbor of . The hierarchical degree da F. Costa (2004) of a node , henceforth expressed as , is the number of edges between its neighbors and its neighbors. The h-th intra-ring degree da F. Costa (2004); da F. Costa and Andrade (2007); da F. Costa and Silva (2006); da F. Costa and da Rocha (2005) of a node , denoted here as , is the number of edges among the nodes of the neighbors of .
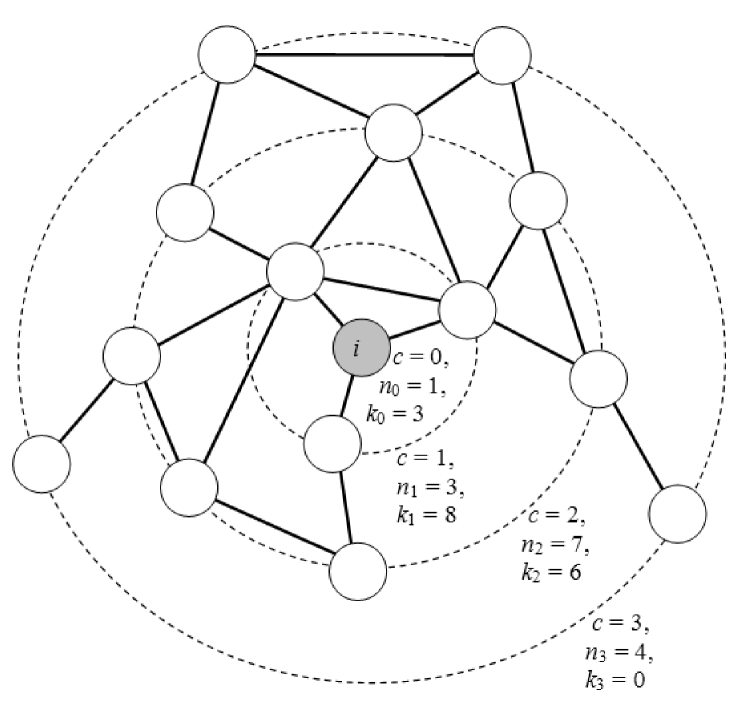
Figure 2 illustrates the concentric organization of a simple network with respect to the reference node . Observe that different concentric organizations will be obtained for the other nodes. The organization obtained for the reference node contains 3 concentric levels (also called rings) defined by 3 successive neighborhoods, respectively with , , , and nodes. The hierarchical degree of node at the level is identical to its traditional degree. However, now we have additional information about the connectivity around the reference node provided by its hierarchical degrees ; and and k-th intra-ring degrees ; ; ; and .
We consider 7 theoretical models of complex networks corresponding to the Erdős-Rény (ER), Barabási-Albert (BA), Watts-Strogatz (WS), geographical (GG), path-regular (PN), path-transformed BA (PA) as well as version of the PN model, henceforth abbreviated as , where all nodes have identical degrees. The ER networks are obtained by implementing edges between pairs of nodes with fixed probability. The BA network starts with nodes and additional nodes are attached with edges each, which are attached to the previous nodes with probability proportional to their respective degrees ( Albert and Barabási (2002)). The WS structures are obtained by by rewiring of the edges in a linear regular lattice with suitable degree. The PN and PA models belong to the family of knitted networks da F. Costa (2007a). The path-regular networks (PN) are constructed by performing paths through all nodes in the network, without repetition. The path-transformed BA model (PA) is obtained through the star-path transformation da F. Costa (2007b) of a BA network with the same number of nodes and similar average degree. The PI mode is introduced in this article as a version of the PN model where all nodes have identical degrees. This is obtained through the two following modifications of the PN algorithm: (a) one path can not go through an edge visited by a previous path; and (b) the initial and final nodes of each path are connected. This new model is particularly suitable for illustrating the developments reported in this article. All used networks have similar number of nodes and edges, and only the nodes corresponding to the largest connected component are taken into account. However, because of the relatively large average node degrees adopted henceforth, most nodes are generally included in the largest components.
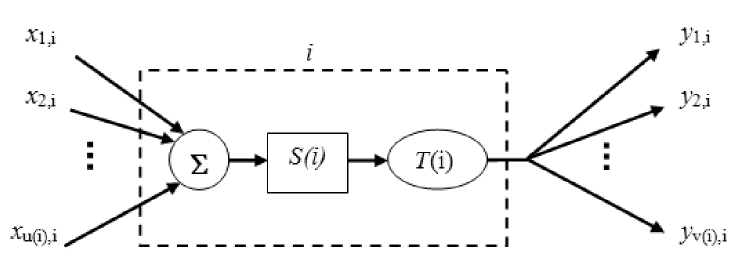
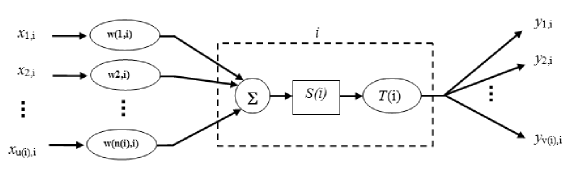
A complex neuronal network is a neuronal network whose connectivity is given by a complex neuronal network. Each neuron is represented as a node, and each synapse as an edge. Integrate-and-fire neurons, shown in Figure 3, are adopted in this work. Each of these neurons is composed of three elements: (i) an integrator, (ii) a memory (containing its current activation state); and (iii) a non-linear transfer function (a hard-limiter is adopted henceforth). A spike is produced whenever the activation state equals or exceeds the respective threshold . In this work, all states and spikes are updated synchronously at every time step . Once a fire takes place, the internally accumulated activation is distributed equally amongst the outgoing axons. Though such a distribution is not biologically realistic, it can be emulated by considering varying synaptic weights. The distribution of the activation implies in the conservation da F. Costa (2008a, b, c) of the total stimuli conveyed by the source node.
Though all the 7 models of theoretical networks adopted in this work are, in principle, undirected, they can immediately used to obtain directed complex neuronal networks by splitting each undirected edge into two respective directed edges. Now, for each cell the incoming edges represent the synapses and the outgoing edges the axons. Consequently, the in- and out-degrees are equal for every cell. The activation of such networks is henceforth obtained by placing a source of constant activation (intensity 1) at a specific nodes and monitoring the respective activation and spiking patterns along time.
III Extreme Configurations
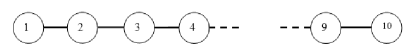
In this section, we investigate the activation spread in two extreme types of complex neuronal networks, namely the hub and a chain dual structures da F. Costa (2007b) shown in Figures 4 and 5. Such examples are aimed at familiarizing the reader with the adopted concepts and representation while illustrating how the activation disseminates in two extreme, but particularly important, situations.
(a)
(b) (c)
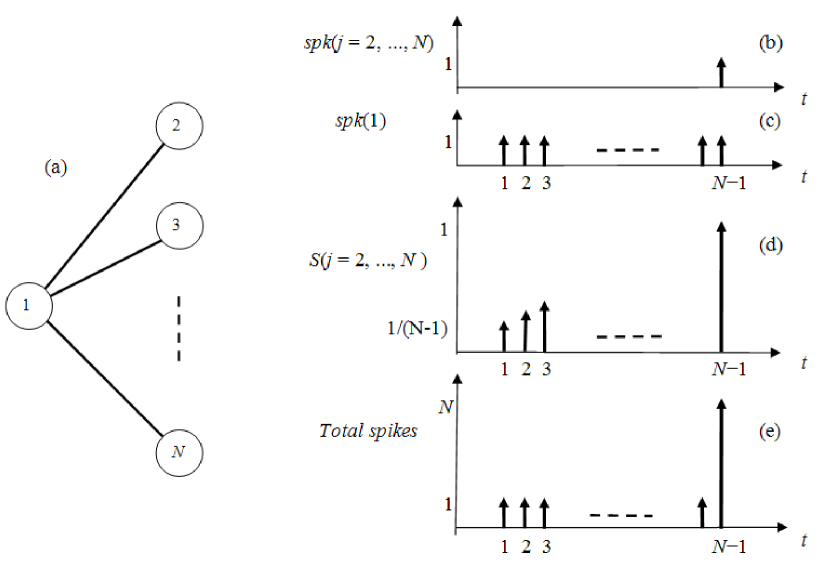
Let us start by analysing the situation depicted in Figure 4. Here, the network incorporates 10 nodes, one of each (node 1) is adopted as the source. Observe that node 1 is the hub of this simple network. All neurons have the same threshold . After activation of the source (kept constant and equal to 1) at , neuron 1 starts firing at every time step , as shown in Fig 4(c). Such spikings activate the neurons attached to neuron by an amount of at every step, implying linear accumulation of the activation along time inside each of the neurons 2 to (Fig. 4(d). At time , such accumulated activations will reach the threshold , implying the simultaneous spiking of all neurons from 2 to . Because neuron 1 spikes continuously, we have a total of spikes at time . This simple example illustrates the basic effect underlying the avalanches of activation in the complex neuronal networks. However, such avalanches are by no means exclusively related to the firing of hubs. First, most of the networks exhibiting activation avalanches, including the BA model, incorporate nodes with varying degrees. Second, avalanches are found in completely degree-regular networks such as the PI model, being also pronounced for highly degree-regular networks such as ER and PN. As shown in this work, the avalanches are ultimately a consequence of hubs of hierarchical degree along the concentric organization of the network with respect to the source node.
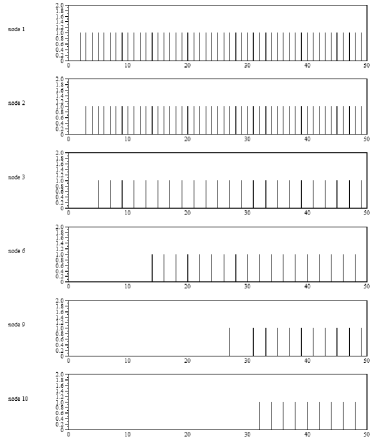
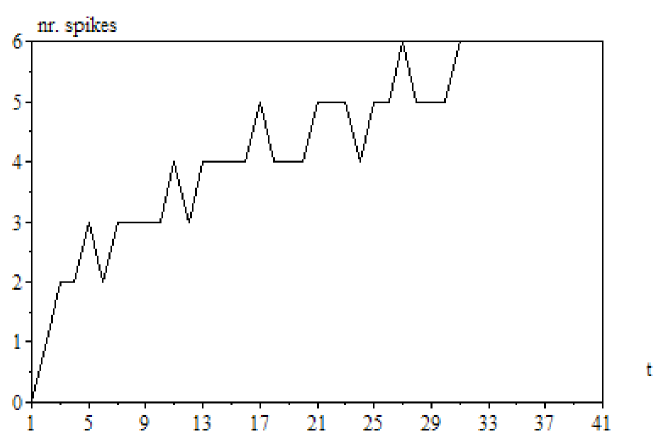
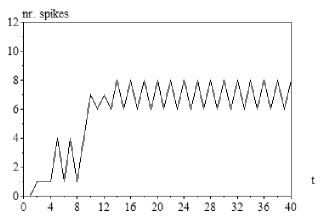
The network illustrated in Figure 5(a) is the dual da F. Costa (2007b) of a hub, i.e. it is completely organized as a chain Boas et al. (2007) of nodes. Despite the simplicity of this network, the activation dynamics is relatively involved because of the backward activation which takes place at each firing of cells 2 to N. The activations and spikings along time for neurons 1, 2, 3, 6, 9 and 10 are shown in Figure 5(b) and (c), respectively. All activations in this figure exhibit what is henceforth called saw oscillations, i.e. alternate high and low values, separated by one time step. The high values of the saw oscillations are henceforth called peaks. The peaks obtained for each node tend to undergo, after a brief transient period, an almost linear increase with time with varying slopes. By comparing the several diagrams in Figure 5, it becomes clear that the activation is propagated gradual and progressively to the neurons at the right-hand side of the chain network, with the initial neurons concentrating activation because of the backward flow of activation. Figure 6 shows the total number of spikes generated along time by the chain network in Figure 5. The smooth and gradual distribution of the activation of the chain networks can be clearly appreciated from these results.
The saw oscillation can be better understood by considering the following coupled difference equations involving 5 consecutive nodes to centered at a node along the chain (except at the two extremities)
where is the accumulated state of node and is the function specifying the time when neuron fires. Observe that these functions are not easily obtained for most cases. Whenever one of such functions is activated, corresponding to the respective spiking, the internal state of the respective neuron is flushed out, being distributed equally among its left and right neighbors, and subsequently cleared.
Let us assume that the saw oscillation is verified for the current instant, i.e. we have a high value (above threshold) at neuron , a low value (below threshold) at neuron , and to on alternately. Because neurons , and have internal states larger than the threshold , they spike, and their activations are shared between their neighbors. Because the latter were at a low activation, they do not send any substantial input to any of the nodes , and , which therefore become lowly activated. However, the high activations previously contained in these three neurons are now transferred to neurons and , which become highly activated. An opposite exchange is verified for the subsequent step, and so on, corroborating the stability of the attractor implying the chain oscillations.
In spite of the relatively complex shapes of the activations along time, quite regular spiking patterns are obtained, as shown in Figure 6(c).
IV Concentric Characterization of the Topology of the Network Models
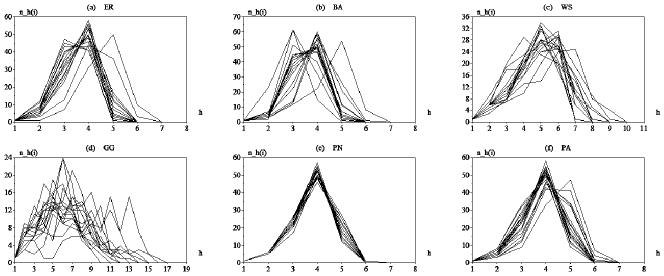
This section presents the concentric characterization of the 7 types of complex networks considered in this work. First, we estimate experimentally the distribution of the hierarchical number of nodes , hierarchical degree , and intra-ring degrees by averaging among every node . Each of the 7 theoretical models of complex networks considered in this work had their hierarchical measurements (hierarchical number of nodes, hierarchical degrees, and intra-ring degrees) obtained computationally for each node of representative samples of each of the topological types. Because systematic comparisons of hierarchical measurements of diverse complex networks models have been reported previously (e.g. da F. Costa (2004); da F. Costa and Andrade (2007); da F. Costa and Silva (2006); da F. Costa and da Rocha (2005)), this section is aimed only at illustrating the overall hierarchical structures of the considered network models.
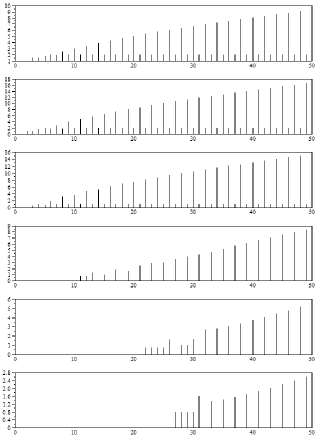
Figure 7 shows the hierarchical number of nodes obtained for 20 nodes randomly chosen from each of the networks of different types. In all cases, the hierarchical node degree starts with value one (the initial node, at ) and increases until reaching one or more (in the case of the GG structure) peaks, decreasing subsequently to zero (the end of the network). Interestingly, the peaks for most models tend to occur near the middle hierarchical level.
However, the specific details of the obtained signatures are directly related to the topology of each type of network. The most regular distribution of hierarchical number of nodes was obtained for the PN model which, after the PI structure, is the most structurally regular model among the types of networks considered presently. Homogeneous signatures were obtained also for the ER and PA models. The GG structure (Fig. 7d) implies not only the largest diversity of signatures, but also the longest signatures (compare the axes ranges in each plot in Figure 7). The second longest signatures were obtained for the WS network (Fig. 7c). Because the sum of the hierarchical number of nodes needs to be constant and equal to the total number of nodes , the two cases leading to the longest signatures also imply the lowest values in the axes.
The hierarchical degrees obtained for each of the types of networks are shown in Figure 8. Recall that the hierarchical degree of a node at concentric level corresponds to the number of edges between the and neighbors of . Again, the hierarchical degrees tend to increase to a peak, decreasing thereafter, with the exception of the GG structure (Fig. 8d). The PN yielded the most similar signatures, reflecting its enhanced structural regularity. The longest and lowest signatures were again obtained for the GG and WS models. Observe that the peak of the hierarchical degrees tend to occur one level before that where the maximum number of nodes are obtained.
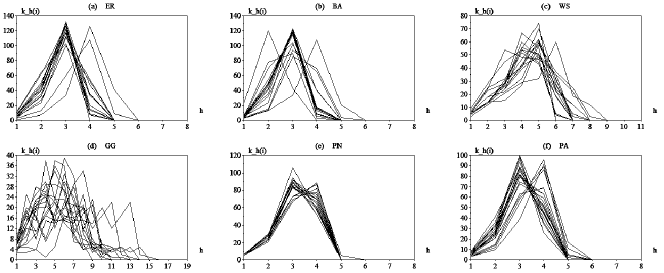
Figure 9 shows the hierarchical intra-ring degrees obtained for each network type. These signatures exhibit properties similar to those discussed above.
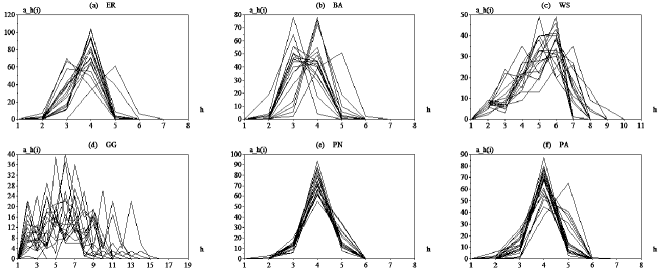
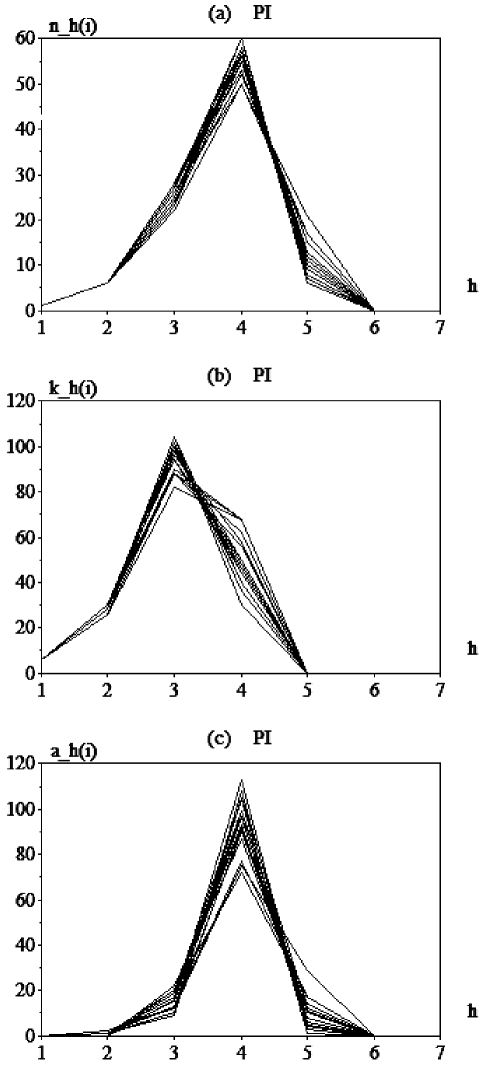
Figure 10 shows the hierarchical number of nodes (a), hierarchical degrees (b) and intra-ring degrees (c) obtained for the highly regular PI network. As expected, they yielded the most uniform sets of hierarchical signatures.
V The Equivalent Model: Connecting the Hierarchical Structure and Transient Dynamics
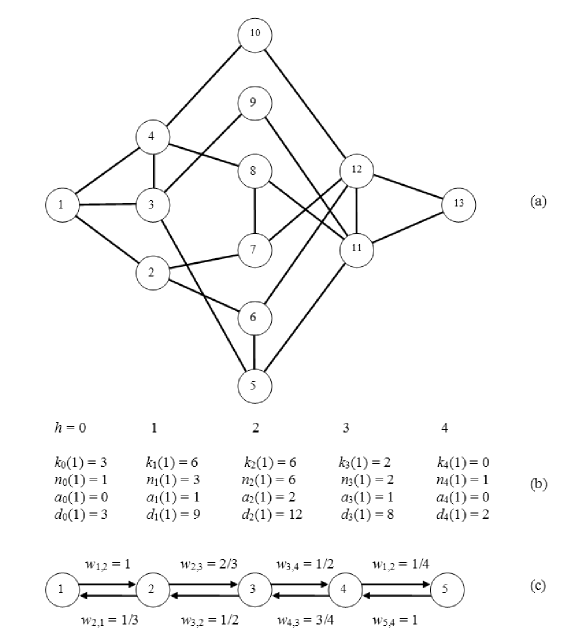
The hierarchical (or concentric) organization of complex networks with respect to a reference node provides not only additional information about the network connectivity at successive larger topological scales around the reference node (a multiscale approach), but is also intrinsically related to the dynamics of distribution through the network of activation received from the reference node. In order to discuss this important fact in more detail, let us consider the simple network in Figure 11, containing 13 nodes. Node 1 was taken as the reference node, and the 5 hierarchical neighborhoods identified, being shown as columns in Figure 11. The hierarchical number of nodes, hierarchical degrees and intra-ring degrees of node 1 are shown below the network. Also shown are the total inter-ring degrees of each neighborhood, obtained by adding its respective hierarchical degree and the hierarchical degree at the previous level, i.e. . It is interesting to observe that, though small, this network captures the hierarchical organization typically found in complex networks, namely the peak of the hierarchical measurements, occurring near the intermediate concentric level.
Let us now suppose that self-avoiding random walks start continuously at the reference node 1. The total number of different paths which can be followed by the walks (a measurement related to the diversity of random walks da F. Costa (2008d); Latora and Baranger (1999); Gardenes and Latora (2007)) can be estimated by multiplying the hierarchical degrees at each level, except for the very last one. The estimation would be exact were not for the intra-ring edges, which allow the moving agents to return to previous levels. In addition, the average time it takes to activate nodes in a given concentric level is readily given as being very close to . Therefore, the concentric organization of a network with respect to the reference node can yield important information not only about the total number of different walks, but also about the time at which nodes receive their first non-zero activation. In the specific case of self-avoiding random walks (or even traditional random walks), the activation of the nodes proceeds gradually, without any abrupt increases or decreases along time.
Let us now consider how the network in Figure 11 behaves with respect to the integrate-and-fire non-linear dynamics adopted in the current work. The source of activation is placed at node 1, and the activation is propagated every time any of the neurons fires. Because the activation being sent from node 1 to nodes 2, 3 and 4 is equally distributed among the 3 respective axons, i.e. edges , and , it takes three steps for the neurons in level 1 to fire. However, when they fire they do so simultaneously, generating a small surge of number of spikes. As each of these three neurons fires, they sends equal shares of activation to all neurons to which they are connected. For instance, after firing, neuron 2 distributes its activation among neurons 1, 6 and 7. Because all neurons in the concentric level 1 send connections to more neurons in the next level, those neurons receive only a small share of the activations sent by the neurons in level 1.
An opposite effect is observed when the neurons at level 2 fire. Now, because the neurons at level 3 receive three axons each from neurons in the previous level, a substantial amount of activation is received by each of them. With few exceptions related to intra-ring edges and degree non-homogeneities, the neurons in the next level will consequently fire at the next time step because of the intense activation received from the previous level. Therefore, once the neurons in the level with highest hierarchical number of neurons spike, they tend to imply intense activation to both the previous and following levels. Now, considering that the neurons at the previous levels are already well-activated as a consequence of being closer to the source, and because the neurons in the following layers will receive intense activation from the spiking neurons, the spiking of the neurons in the concentric level with the highest hierarchical number of nodes tends to imply the spiking of most (often all) the other neurons in the network within a one or a few time steps. This corresponds to how the avalanches of spikings are produced in typical complex neuronal networks.
It should be observed that the regularity of connections of all neurons in Figure 11 was deliberately chosen for the sake of a more didactic presentation. Non-homogeneities of connections between nodes (e.g. a neuron in level send more connections to distinct neurons in the next level than other neurons at level ) imply in non-simultaneous spiking of the neurons at a given level. However, because several of the 7 considered network types are characterized by strong degree regularity (the main exception is the BA case), they degree homogeneity is not a particularly restrictive assumption. Another simplification adopted so far concerns the effect of intra-ring connections in slightly delaying the activation of the adjacent levels to a level , by implying a fraction of the activation liberated by the spiking neurons at level to remain at that same level. Intra-ring connections can also imply in small lost of simultaneity in the spiking of the neurons at the next level. Though all the developments reported in the remainder of this article can be complement to take into account non-homogeneous degree distributions and intra-ring connections, such extensions are left for future works.
Because of the relative uniformity of the degree distributions in most of the 7 considered complex network models, it is possible to reduce the hierarchical organization of a complex, with reference to a given node, into a chain network (see Fig. 11c), yielding a mean-field equivalent model of the relationship between the hierarchical structure and the non-linear activation dynamics in complex networks. The basic idea is to consider the activation and spiking of all neurons in each concentric level to be subsumed by a single equivalent node. Therefore, an equivalent chain network such as that in Figure 11 is obtained from the original network. Now, the connections between these equivalent nodes need to be weighted in order to account to the typically asymmetric distribution of activation between the nodes at the previous and next concentric levels. These weights are properly defined as
where . In the particular case of the neurons at the extremities of the chain, we have
Figure 12 shows the adopted integrate-and-fire neuronal model modified to incorporate weights.
In order to reflect the division of the activation received at a level among all its constituent neurons, it is necessary to set the thresholds of the neurons in the chain equivalent neuronal network as being equal to the respective hierarchical number of nodes, i.e. . This last modification completes the definition of the mean-field equivalent model of the non-linear distribution of activation through reasonably degree-regular complex neuronal networks.
Once the equivalent model of a given complex network and activation source has been obtained from the respective concentric properties, the following important estimations about the activation/spiking dynamics can be obtained:
bf Avalanche hierarchy: The concentric level at which the avalanche initiates can be estimated as the level which has the largest number of neurons.
Beginning of Activation Times: The time it takes to a level to spike can be estimated by adding the number of nodes from level 0 to the current level.
Avalanche times: The time at which the first avalanche will occur can be estimated by adding the number of nodes from level to the level containing the largest number of nodes (inclusive).
Intensity of avalanches: The intensity of the avalanche at the time it occurs can be estimated as the number of nodes in the critical level.
The evolution of the avalanches: Though the maximum variation of the total number of spikes is approximately given as above, varying degrees and intra-ring connections will imply in a dispersion of the spiking, affecting the intensity and width of the avalanches. Such additional features can be estimated by taking into account the number of nodes at concentric levels which are adjacent to the critical level (i.e. that containing the largest number of nodes).
In the following, the potential of the equivalent model for predicting the properties of the avalanches is illustrated with respect to the simple network in Figure 11 and then with respect to each of the 7 topological types of networks adopted in this article.
VI Illustrative Examples
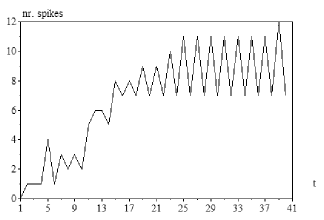
Figure 13 shows the total number of spikes along time obtained for the complete original network (a) as well as by considering the respective equivalent model in Figure reffig:equiv(c). Identical curves are obtained in case the intra-ring connections are removed from the network. However, the fact that these connections are not considered in the equivalent model implies in the predicted slight delays and spread of the activations. Nevertheless, the overall dynamics leading to the spiking avalanche was properly captured and reproduced by the model up to the small differences implied by the elimination of the intra-ring connections.
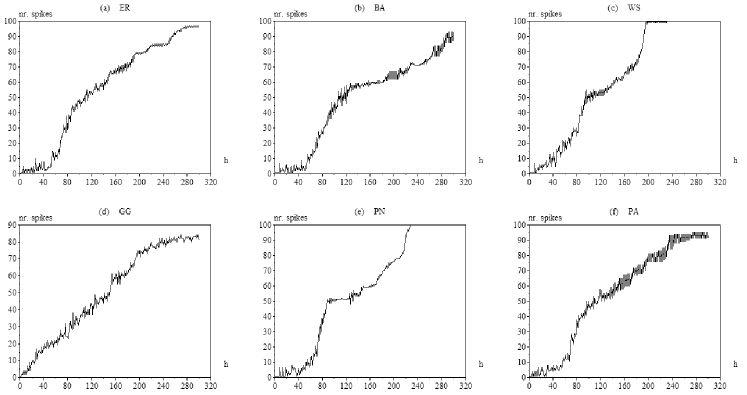
(a) (b)
Figure 14 shows the total number of spikes in terms of the time steps, as obtained by considering the whole ER, BA, WS, GG, PN and PA complex network models adopted in the present work with the activation source placed at node 50. The most remarkable feature of such results, which soon catches our attention while looking at Figure 14, is that most networks, except the GG but including the BA, yielded very similar patterns of total spiking along time. Moreover, all networks (except GG) show avalanches, which occur at similar times near 80 steps. Similar results have been obtained for most of the other nodes, but are not shown here for the sake of space. These results suggest that avalanches, as well as their onset time, seem to be an almost universal feature of complex neuronal networks. The only parameters which are likely to affect the avalanche parameters are the sizes and average degrees of the networks. Because of its potential importance, we investigate this issue further in the next section. Also of particular interest in Figure 14 are the occurrence of a second avalanche in the WS and PN cases.
The hierarchical measurements of the structures considered above — namely the hierarchical number of nodes, hierarchical degree — were obtained and used to define the respective equivalent models. Figure 15 depicts the total number of spikes along time obtained for the equivalent models with respect to the situations shown in Figure 14. Strikingly, all plots — except possibly for the GG case — show a clear transition of spiking intensity near time step 80. As expected, the WS and GG networks yielded more gradual transitions. However, in all cases the network was completely activated after nearly 80 time steps, undergoing saw oscillations. Interestingly, the amplitude of such oscillations varied considerably for each of the situations in Figure 15, being more intense for the two knitted models (i.e. PN and PA). In addition, the height of the oscillating plateaux tended to follow the intensity of the avalanches in Figure 14, being close to 50 for all models, except for the PA model, which yielded a slightly lower avalanche transition of nearly 40 units.
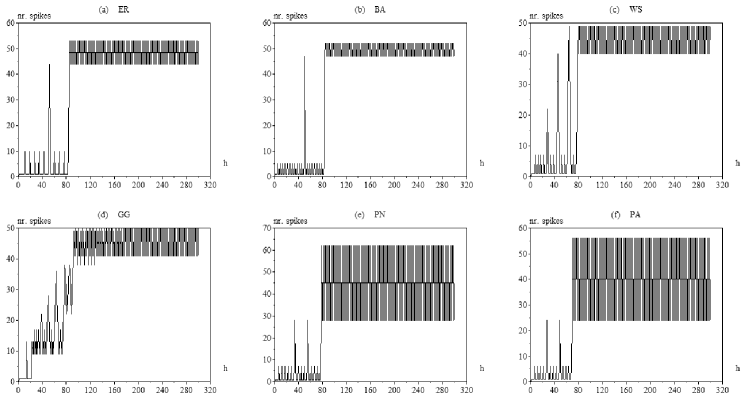
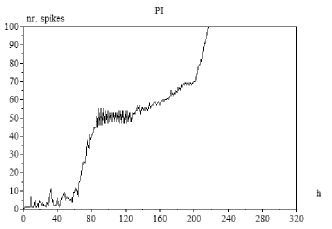
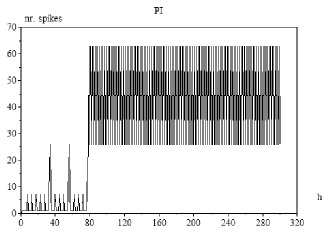
Figure 16 shows the results obtained for the highly regular PI model by using the whole original network (a) and the respective equivalent model (b). A pronounced avalanche is obtained, followed by a relatively long plateau of stabilization of the overall spiking rate. A secondary avalanche can be identified at approximately 210 steps. Again, the equivalent model was capable of identifying the timing and intensity of the first avalanche.
(a) (b)
By being in complete agreement, as far as the main avalanche properties are concerned, with the results obtained by considering the whole original network (Fig. 14), these results support the fact that the intrinsic dynamics of avalanches, as well as their respective times and intensities, are intrinsically captured in the particularly simple respective equivalent models. However, the simple chain model failed to detect the secondary avalanches obtained for the WS and PN models. Remarkably, the intrinsic dynamics of the first avalanches seem to be completely determined by the respective topological measurements of hierarchical number of nodes and hierarchical degrees. This implies that the main avalanches, as well as their features, can be reasonably predicted from the respective hierarchical measurements.
VII How universal are avalanches?
The remarkable results obtained in the previous section, especially the similar onset times for the avalanches obtained for all models except GG, motivate future investigations. In this section, we consider the highly regular PI model in order to identify the equivalent model parameters (i.e. hierarchical number of nodes and hierarchical signatures) for a whole range of network sizes and average degrees (recall that all nodes in a PI network have the same degree).
Figure 17 shows the positions and intensities predicted for the avalanches in PI complex neuronal networks in terms of their sizes and average node degree . These results were obtained by considering the whole networks (not the equivalent models) and averaging over all nodes of the PI networks. Interestingly, both the positions and the intensities do not depend on the average degree. This is compatible with the fact that only the ratios between the hierarchical degrees are taken into account in the equivalent model. The positions of the avalanches along time (Fig. 17a) increase monotonically, but not linearly, with . The positions also undergo an abrupt increase near . The intensities of avalanches (Fig. 17b) exhibit a similar behavior, also independent of the average degree, but exhibit a less abrupt increase near .
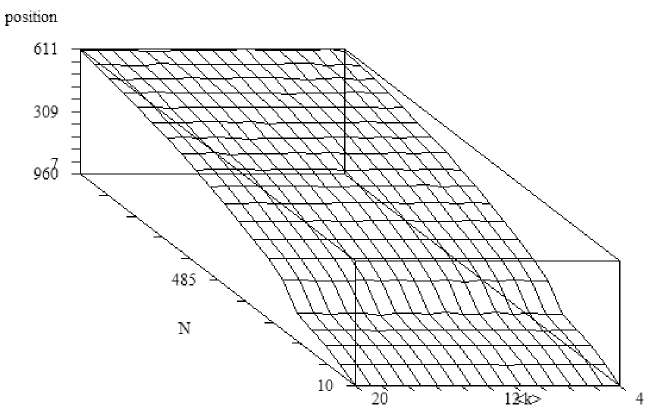
(a)
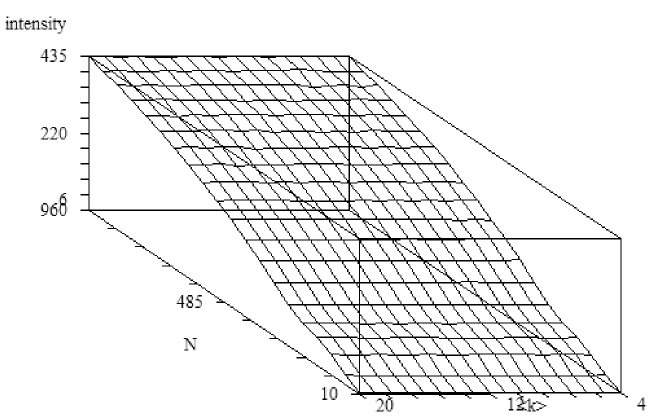
(b)
VIII A Real-World Example: C. elegans Network
Having proceeded all the way from the discussion of the avalanches in integrate-and-fire complex neuronal networks to the respective characterization in terms of the chain equivalent model, it is now time to illustrate the potential of these concepts and approaches with respect to a real-world network, namely the C. elegans network Watts and Strogatz (1998). The largest component considered in this article contained 246 nodes (the original matrix was thresholded at 4).
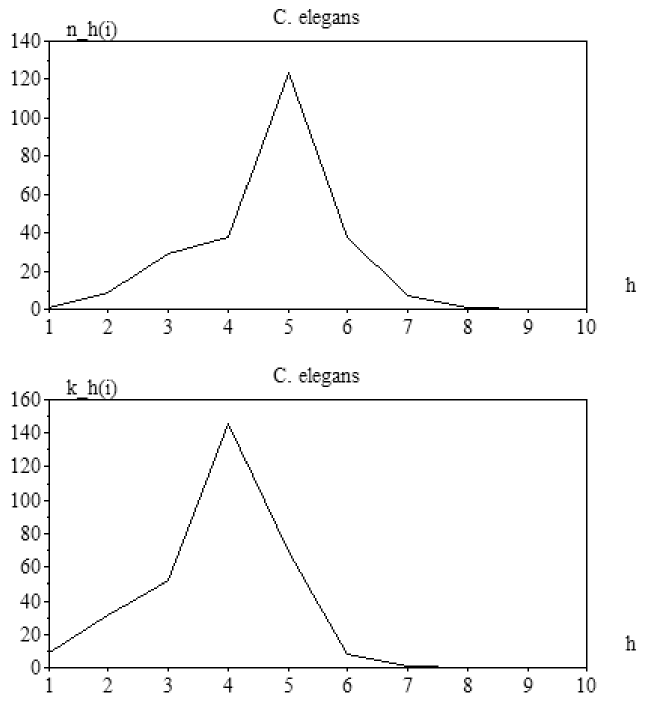
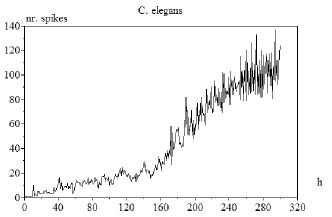
Figure 18 shows the hierarchical number of nodes and hierarchical degrees obtained for the C. elegans network with reference to node 50. The maximum number of nodes per concentric level is obtained for level 5. So, the avalanche time is predicted as the sum of the nodes at this and the previous levels, therefore corresponding to 200 steps. The intensity of the avalanche is estimated as being equal to the maximum number of nodes per concentric level, i.e. 123. Figure 19(a) shows the total number of spikes along time obtained considering the whole original structure (a) and by using the equivalent model (b) defined by the respective hierarchical measurements. The avalanche is observed very close to the predicted time, exhibiting intensity also very similar to the respectively predicted value.
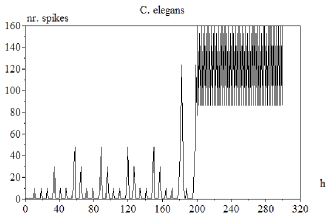
(a) (b)
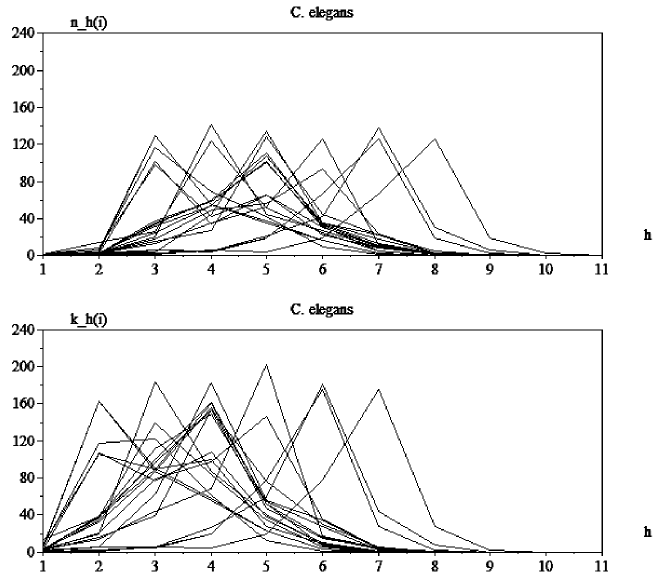
Because of the close relationship between the concentric organization and the transient integrate-and-fire dynamics, it is possible to predict with accuracy the avalanche features from the hierarchical number of nodes and hierarchical degrees of other nodes from the C. elegans network, without the need to perform the simulation of the respective dynamics. Figure 20 shows the hierarchical number of nodes and hierarchical degrees obtained for 50 other nodes of the C. elegans neuronal network. It is clear from such results that the placement of the activation at other nodes will clearly lead to different avalanche intensities and positions along time. This has been experimentally verified but is not reported here for the sake of space.
IX Concluding Remarks
The integration of neuronal and complex networks provides an especially exciting prospect for investigating the relationship between structure and dynamics in complex systems. Recently reported results considering transient non-linear dynamics in integrate-and-fire complex neuronal networks have yielded a series of remarkable results, including the identification of avalanches of activation and spikings occurring along time for several network topologies da F. Costa (2008a) and the transient confinement of activation/spiking within the topological modules (communities) of networks da F. Costa (2008b, c). The present work had as its main objective to investigate the former of these effects.
After presenting the basic concepts, a series of developments were reported with respect to the study of the first spiking avalanche in complex neuronal networks. The main contributions of the current article are summarized as follows:
Introduction of the highly PI network model: A new network model, characterized by identical node degrees as well as other types of structural regularities, has been introduced. The PI model, which is a version of the path-regular knitted network da F. Costa (2007b), is obtained by implementing paths involving all network nodes, without repetition of nodes or edges. The PI model is particularly relevant for the type of investigations developed in this article because it yields regular degrees at all concentric levels. Were not for the intra-ring links, the PI model would lead to completely simultaneous spikings at each concentric level.
Study of spiking dynamics for two extreme dual situations: The phenomenon of the spiking avalanches has been investigated and characterized with respect to two extreme situations, namely a network involving a hub (star connectivity) and a chain network. Completely different activations and spiking patterns are implied by each of these two cases, corroborating the dual nature of star and path connectivity da F. Costa (2007b). More specifically, while the hub network yields a maximally intense and simultaneous avalanche of spikes and activation, the chain network implies gradual and smooth propagation of the activation and spiking throughout the network.
Identification of the saw oscillations: The unfolding of the activation in integrate-and-fire complex neuronal networks tends to exhibit oscilations. This effect has been discussed and characterized with respect to the chain networks. In particular, it has been shown that such an alternating dynamics corresponds to a stable attractor of the dynamics.
Identification of secondary avalanches: A secondary avalanche of spikings has been identified for some network models, especially the WS and PN models. Though not investigated in more detail in the present work, and not being captured by the equivalent model, such phenomena correspond to another interesting feature of the integrate-and-fire neuronal complex networks.
Brief review of hierarchical measurements of complex networks: While traditional measurements such as the degree and clustering coefficient provide valuable information about only the most immediate neighborhood around each node, the hierarchical (or concentric) measurements allow a comprehensive characterization of the connectivity surrounding each node in terms of multiple topological scales. The concentric organization of networks, as well as the measurements of number of nodes by level and the hierarchical degree, have been reviewed in an introductory and didactic fashion. They have been illustrated with respect to each of the 7 theoretical models of complex networks adopted in this work. The signatures obtained for the hierarchical number of nodes, hierarchical degrees, and intra-ring degrees are remarkably similar for all models except the geographical and Watts-Strogatz structures. Such a topological feature suggests that any dynamics relying strongly on the concentric structures of the networks will tend to exhibit similar properties in most of the considered networks.
The importance of hierarchical measurements for dynamics: Because the neuronal activation is assumed to emanate from a single node, the concentric organization of the network defined by this node provides a natural way to look at the relationship between the topology and spread of activation through the network. Indeed, because of the integration of neuronal activation along time (facilitation) required for reaching the firing threshold, each of the concentric levels acts as a barrier, confining the neuronal activation at the previous levels until the activation becomes critical, implying the almost simultaneous firing of the neurons in the lastly activated level. Therefore, the main avalanche during the transient activation of a complex neuronal network is determined by the concentric level containing the largest number of nodes. Because the integrate-and-fire dynamics in complex neuronal networks tend to be strongly defined by the concentric structure around the source node, several of the features of the avalanches can be estimated from such topological information. It should be observed that such a formulation can be readily extended to consider more than one node acting as sources, as allowed by the generalized approach where subgraphs are treated as equivalent nodes da F. Costa and da Rocha (2005).
Proposal of a chain equivalent model: The close relationship between the topological concentric features of the networks and the respective spread of activation and spiking motivated the proposal of a simple equivalent model, namely a chain network whose each node corresponds to one of the concentric levels of the original network and the weights are defined by the proportion of activations sent to the previous and next levels. Though such a proportion has been determined in terms of the hierarchical degrees at the previous and next levels, because of the assumed degree regularity, it can also be obtained from the number of nodes at the previous, current and next levels. In order to account for the different number of nodes at each of the levels of the original network, the previously adopted integrate-and-fire neuron model was augmented to incorporate synaptic weights. By reducing the incoming activation by the right proportion, determined in terms of the ratio between the hierarchical degree (or number of nodes between layers), the synaptic weights mimic the large inertia for activation implied by the different number of nodes at each level. Though very simple, typically involving only a handful of nodes, the equivalent model was shown to capture the intrinsic topological features defining important features of the avalanches. More specifically, their intensity can be reasonably estimated as corresponding to the number of nodes at the concentric level with the largest number of nodes. The time when the main avalanche occurs can also be predicted by adding the number of nodes from the first level to the level containing the largest number of nodes. The equivalent model was shown to predict these parameters with reasonable accuracy for all 7 models as well as for the C. elegans network, except the geographical model (which do not yield avalanches). Remarkably, the equivalent model seems to be useful even for Barabási-Albert networks, which are characterized by highly skewed degree distributions. However, the equivalent model does not take into account either intense degree non-uniformities or the intra-ring connections. In practice, such features tend to undermine the simultaneous activation of the neurons in each concentric level, making the avalanches less definite.
Identification of universal features of avalanches: Because most of the considered networks, including the C. elegans structure, exhibit similar concentric organizations with respect to most of their nodes, and because the integrate-and-fire dynamics is strongly defined by the concentric properties of the network with respect to the source node, it followed that most of the considered models exhibit similar non-linear transient dynamics. The reported systematic investigation of the intensity and position of the avalanches in the PI model considering several network sizes and average degrees showed that these properties are completely independent of the average degree, but strongly affected by the network size. More specifically, both the intensity and position of the main avalanche increases monotonically, but sub-linearly with the network size. Because of the fact that most of the considered complex networks tend to exhibit similar concentric organization, such results obtained for the PI model are very likely immediately extensible to most models, except the Watts-Strogatz and geographical structures. This is an important result, suggesting some level of universality among networks with the same number of nodes. It is possible that such a universality is related to the stochastic nature of the considered theoretical models. It would be particularly interesting to investigate if such a universality is verified for real-world networks as well as other theoretical models.
Investigation of avalanches in the C. elegans neuronal network: The consideration of this important real-world network allowed additional insights about the avalanches as well as further corroborated the potential of the equivalent model for predicting important non-linear dynamical features with basis on the topological concentric properties. It has been further corroborated preliminary results da F. Costa (2008a), by considering the source of activation at node 50, that this network also undergoes an avalanche of spiking at nearly the time step 200. Similar results were obtained for other nodes, though markedly distinct avalanche features were obtained for some specific nodes. This result is particularly striking because, among the 7 considered theoretical models, only the GG and WS models were characterized by different concentric signatures produced by different nodes. This would suggest the C. elegans network to be similar to either of those models. However, those models did not exhibit the avalanches verified for the C. elegans network. Consequently, it seems that this network exhibits some specific topological structure which is not captured by any of the 7 considered theoretical models. Such a heterogeneity of dynamics implied by different nodes suggests investigations aimed at quantifying the influence of each node on the overall transient dynamics.
Relating network structure and dynamics: Ultimately, this work has lied at the heart of the structure-dynamics paradigm, addressing transient non-linear dynamics in integrate-and-fire complex neuronal systems. More specifically, it has focused the specific phenomenon of the activation/spiking avalanches previously identified for complex neuronal networks da F. Costa (2008a). Because of the intrinsic way in which the integrate-and-fire non-linearity acts on the dynamics while depending on the topology, the avalanches were ultimately found to be strongly defined by the hierarchical (or concentric) organization of complex neuronal networks, allowing the development of an extremely simple chain equivalent model as well as the prediction of the main avalanche features from the concentric measurements.
The results and concepts reported in this work have paved the way to several future developments, some of which are discussed below:
Additional Experiments: While the results reported in this work were computationally limited, it would be important to extend the reported investigations to include larger networks as well as a larger number of samples for each configuration to be experimentally simulated and characterized.
Extension to other types of dynamics: The close relationship between the concentric topology and dynamics identified in this work suggests that other types of dynamics — including traditional diffusion, self-avoiding random walks, as well as integrate-and-fire with activation decays da F. Costa (2008c), may also be strongly related to the hierarchical organization of complex networks.
Real-world networks: The interesting results obtained for the C. elegans network motivate the investigation of other real-world networks related to non-linear dynamics. Several cases would be particularly interesting to be examined, including communications, production, transportation and computing networks. Of special interest would be biological networks, where the production of specific molecules and structures depend on the integration of received subparts.
Identification of nodes leading to particular types of avalanches: The verified fact that different nodes in some networks (e.g. WS, GG and C. elegans) can produce distinct avalanches motivates further research aimed at the quantification and identification of nodes in a given network which are capable of producing the most intense avalanche, or the earliest and latest avalanches. By taking into account the respective effects of each node on the dynamics, such an investigation could provide insights about the role of these nodes in the respective real-world systems.
Incorporation of intra-ring edges and consideration of skewed degree distributions: For simplicity’s sake, the equivalent model reported in this work did not take into account the intra-ring connections or non-uniformities of degree. It would be interesting to develop augmented models incorporating these features and to verify whether they would be able to capture secondary avalanches and lead to more precise estimations.
Extension to integrate-and-fire complex neuronal networks with limitation of the activation transfers: In this work we assumed that once a spike occurs, the internal accumulated activation is integrally shared between the outgoing axons. However, in biological neuronal networks, the axon activation is known to be limited to similar spike amplitudes. Preliminary investigations indicated that most of the phenomena, concepts and results reported in this work extend immediately to integrate-and-fire models involving outward activation limitation. Nevertheless, small differences have been verified, such as the fact that in this type of limited activation structures the avalanches tend to occur as large peaks, not as the sigmoid transitions illustrated in this work. Therefore, it would be interesting to repeat the investigation procedure reported here in order to characterize in more detail the relationship between topology and dynamics in complex neuronal networks with outward activation limitation.
The equivalent model and topological communities: In addition to advancing the understanding of the avalanches, the concepts and results reported in the current work also paved the way to future investigations of another remarkable effect of the non-linear integrate-and-fire complex neuronal networks, namely the transient confinement of activation within the topological communities. Indeed, it would be relatively easy to extend the adopted formulations to incorporate groups of more intensely connected nodes at each of the concentric levels. By doing so, it is possible to define equivalent models which involve several branches initiating at the source.
Superedge analysis of the synchronization of the activations: It would be particularly interesting to apply the concept of superedges, recently suggested da F. Costa (2008e) as a particularly systematic and comprehensive way to investigate the relationship between topology and dynamics in complex systems, in order to obtain additional insights about the avalanches phenomenon. At the same time, the superedges approach can be complemented by the concentric approaches currently adopted. The superedges approach would be particularly important for quantifying the loss of spiking simultaneity implied by non-uniform degree and intra-ring connections.
Implications for neuroscience, real-world networks, and complex networks research: The reported concepts and results have several potential implications for neuroscience and complex networks research. In the former case, it would be interesting to seek for avalanches in the activation of biological neuronal systems and relate such effects to the respective network topology. Interestingly, because of the prediction potential of the equivalent model and its simplicity, it becomes possible to perform such investigations even when the specific details of the biological networks are known. In other words, avalanches of neuronal activity can be related to the network architecture by considering estimations of the number of nodes in each neuronal concentric level. Similar investigations can also be performed with respect to a number of real-world networks involving non-linear dynamics, especially other biological networks such as gene expression and protein interaction. The implications for complex network research are also numerous. First, we have shown that the intrinsic topological features of networks can have fundamental effects on the transient activation of non-linear complex systems, motivating further related works. Second, it has been shown relatively complex phenomena such as avalanches in the transient activation of non-linear integrate-and-fire complex neuronal networks, can be effectively modeled by simple equivalent networks. In addition, it would be interesting to seek for other near universal properties of the avalanches. Finally, it has been shown that the concentric organization of complex networks, which has been relatively overlooked in the literature, can hold the key for explaining important dynamical properties of complex neuronal networks.
Acknowledgements.
Luciano da F. Costa thanks CNPq (308231/03-1) and FAPESP (05/00587-5) for sponsorship.References
- Ascoli (1999) G. A. Ascoli, Anat. Rec. 256, 195 (1999).
- da F. Costa (2005) L. da F. Costa (2005), arXiv:q-bio/0503041.
- Newman (2003) M. E. J. Newman, SIAM Rev. 45, 167 (2003).
- Boccaletti et al. (2006) S. Boccaletti, V. Latora, Y. Moreno, M. Chavez, and D. Hwang, Phys. Rep. 424, 175 (2006).
- Stauffer et al. (2003) D. Stauffer, L. Aharony, L. da F. Costa, and J. Adler, Eur. Phys. J. B 32, 395 (2003).
- da F. Costa and Stauffer (2003) L. da F. Costa and D. Stauffer, Physica A 330, 37 (2003).
- Kim (2004) B. J. Kim, Phys. Rev. E 69, 045101 (2004).
- Memmesheimer and Timme (2006) R. M. Memmesheimer and M. Timme, Physica D 224, 182 (2006).
- Osipov et al. (2007) G. V. Osipov, J. Kurths, and C. Zhou, Synchronization in Oscillatory Networks (Springer, 2007).
- Hasegawa (2004) H. Hasegawa, Phys. Rev. E 70, 066107 (2004).
- Hasegawa (2005) H. Hasegawa, Phys. Rev. E 72, 056139 (2005).
- Park and Kim (2006) S. M. Park and B. J. Kim, Phys. Rev. E 74, 026114 (2006).
- Hong et al. (2004) H. Hong, B. J. Kim, M. Y. Choi, and H. Park, Phys. Rev. E 69, 067105 (2004).
- Lee (2005) D. S. Lee, Phys. Rev. E 72, 026208 (2005).
- Zhou et al. (2006) C. Zhou, A. E. Motter, and J. Kurths, Phys. Rev. Letts. 96, 034101 (2006).
- Boccaletti et al. (2007) S. Boccaletti, M. Ivachenko, V. Latora, A. Pluchino, and A. Rapisarda, Phys. Rev. E 75, 045102 (2007).
- Nishiwaka and Motter (2006) T. Nishiwaka and A. E. Motter, Phys. D 224, 77 (2006).
- Sorrentino et al. (2007) F. Sorrentino, M. di Bernardo, F. Garofalo, and G. Chen, Phys. Rev. E 75, 046103 (2007).
- Almendral and Guilera (2007) J. A. Almendral and A. D. Guilera (2007), arXiv:0705.3216.
- da F. Costa (2008a) L. da F. Costa (2008a), arXiv:0801.3056.
- da F. Costa (2008b) L. da F. Costa (2008b), arXiv:0801.4269.
- da F. Costa (2008c) L. da F. Costa (2008c), arXiv:0801.4684.
- da F. Costa (2004) L. da F. Costa, Phys. Rev. Lett. 93, 098702 (2004).
- da F. Costa and Silva (2006) L. da F. Costa and F. N. Silva, Journal of Statistical Physics 125, 845 (2006).
- da F. Costa and da Rocha (2005) L. da F. Costa and L. E. C. da Rocha, The Eur. Phys. J. B 50, 237 (2005).
- da F. Costa and Andrade (2007) L. da F. Costa and R. F. S. Andrade, New J. Phys. 9, 311 (2007).
- Albert and Barabási (2002) R. Albert and A. L. Barabási, Rev. Mod. Phys. 74, 47 (2002).
- da F. Costa (2007a) L. da F. Costa (2007a), arXiv:0711.2736.
- da F. Costa (2007b) L. da F. Costa (2007b), arXiv:0711.1271.
- Boas et al. (2007) P. R. V. Boas, F. A. Rodrigues, G. Travieso, and L. da F. Costa (2007), arXiv:0706.2365.
- da F. Costa (2008d) L. da F. Costa (2008d), arXiv:0801.0380.
- Gardenes and Latora (2007) J. G. Gardenes and V. Latora (2007), arXiv:0712.0278.
- Latora and Baranger (1999) V. Latora and M. Baranger, Physical Review Letters 82, 520 (1999).
- Watts and Strogatz (1998) D. J. Watts and S. H. Strogatz, Nature 393, 409 (1998).
- da F. Costa (2008e) L. da F. Costa (2008e), arXiv:0801.4068.
- Ravasz and Barabási (2003) E. Ravasz and A. L. Barabási, Phys. Rev. E 67, 026112 (2003).