PSR J07373039: Interacting Pulsars in X-rays11affiliation: Based on observations obtained with XMM-Newton, an ESA science mission with instruments and contributions directly funded by ESA Member States and NASA
Abstract
We present the results of a 230 ks long X-ray observation of the relativistic double-pulsar system PSR J07373039 obtained with the XMM-Newton satellite in 2006 October. We confirm the detection in X-rays of pulsed emission from PSR J07373039A (PSR A), mostly ascribed to a soft non thermal power law component () with a 0.2–3 keV luminosity of erg s-1 (assuming a distance of 500 pc). For the first time, pulsed X-ray emission from PSR J07373039B (PSR B) is also detected in part of the orbit. This emission, consistent with thermal radiation with temperature eV and a bolometric luminosity of erg s-1, is likely powered by heating of PSR B’s surface caused by PSR A’s wind. A hotter (130 eV) and fainter ( erg s-1) thermal component, probably originating from back-falling particles heating polar caps of either PSR A or PSR B is also required by the data. No signs of X-ray emission from a bow shock between PSR A’s wind and the interstellar medium or PSR B’s magnetosphere are present. The upper limit on the luminosity of such a shock component ( erg s-1) constrains the wind magnetization parameter of PSR A to values greater than 1.
Subject headings:
binaries: general — pulsars: general — pulsars: individual (PSR J07373039A, PSR J07373039B) — stars: neutron — X-rays: stars1. Introduction
The short-period, double–radio pulsar system PSR J07373039 (Burgay et al., 2003; Lyne et al., 2004), besides being of paramount interest as a probe for theories of strong field gravity (Kramer et al., 2006), represents a unique laboratory for studies in several fields, ranging from the equation of state of super-dense matter to magneto-hydrodynamics. The system is observed nearly edge-on and consists of a fast, recycled radio pulsar (PSR J07373039A [PSR A], period ms) orbiting its slower companion (PSR J07373039B [PSR B], s) with an orbital period of only 2.4 hr. Radio observations of the two pulsars permit one to derive a wealth of information which is not available for other neutron stars. These obviously include the neutron star masses and all the other geometrical and dynamical parameters of the system, but also information on the structure and physical properties of the two magnetospheres. The double-pulsar is rich in observational phenomena, including a short radio eclipse of A by B and orbital modulation of the radio flux of B due to the influence of A (Lyne et al., 2004). The individual pulses from B show drifting features due to the impact of the low-frequency electromagnetic wave in the relativistic wind from A (McLaughlin et al., 2004b), while the eclipse of A is modulated at half the rotational period of B (McLaughlin et al., 2004c). High-energy observations are an important complement to these studies, in particular for what concerns the physics of the magnetospheric emission and dissipative shocks in the close environment of the two neutron stars.
X-rays could be pulsed magnetospheric or thermal emission from pulsar A, as seen for several other recycled pulsars (Zavlin et al., 2002), but they could also originate in the colliding winds of A and B (Lyutikov, 2004). Because of the interaction of the relativistic wind of the fast spinning pulsar A ( erg s-1) with the magnetosphere of its much less energetic companion ( erg s-1), the formation of a bow shock, likely emitting at high energies, is expected. The predicted fluxes are roughly comparable to those observed for magnetospheric and/or surface emission from the pulsars. A termination shock between the two pulsars can probe the properties of a pulsar’s relativistic wind at a smaller distance from the central engine than ever studied before. In addition, detection of an orbital phase dependence in the X-ray emission might be expected (Lyutikov, 2004; Arons & Tavani, 1993). Such variability could constrain the geometry of the emission site, thus providing new insights into the wind physics close to the pulsar. Alternatively, most of the high-energy emission could arise from the shock generated when one or both the pulsar winds interact with the interstellar medium (Granot & Mészáros, 2004).
The first X-ray observation of PSR J07373039, a short (10 ks) Chandra pointing (McLaughlin et al., 2004a) yielded only 80 photons. The low X-ray luminosity (L erg s-1, where we indicate with the distance in units of kpc) corresponds roughly to the entire spin-down luminosity of the slow pulsar B and to only a small fraction of that of pulsar A. The Chandra data of this pioneer observation could only poorly constrain the source spectrum, which appeared quite soft, and cannot provide significant evidence for variability, due to the small statistics and time resolution being insufficient to look for the spin periods of the two pulsars.
A longer public observation (50 ks), carried out in 2004 March through the XMM-Newton Director’s Discretionary Time program, yielded an improvement in statistics by a factor 10 with respect to the first look of Chandra. These data confirmed the softness of the spectrum, which could be fit either by a power law with photon index and absorption cm-2 or by a blackbody with temperature of 0.15 keV and a lower interstellar absorption (Pellizzoni et al., 2004). These authors could also have performed the first X-ray timing analysis for PSR J07373039, but no periodic or aperiodic variations were found, with upper limits of 60% on the pulsed fractions of both pulsars and of 40% for modulations in the orbital period (all limits are at the 99% confidence level and for sinusoidal light curves). Campana et al. (2004) reported a joint spectral analysis of the XMM-Newton (only the MOS) and Chandra data, reaching similar conclusions on the source spectrum.
A further Chandra observation (90 ks) with the High-Resolution Camera showed X-ray pulses at the period of PSR A (Chatterjee et al., 2007), with a double-peaked profile, similar to that observed in radio, and a pulsed fraction of 70%. Although purely non thermal emission is consistent with the data, the X-ray pulse morphology of PSR A, in combination with previously reported spectral properties of the X-ray emission, suggests the existence of both non thermal magnetospheric emission and a broad sinusoidal thermal emission component from the neutron star surface. No pulsations were detected from pulsar B, nor evidence for orbital modulation. Here we report the results of a 230 ks long X-ray observation of PSR J07373039 obtained within the frame of XMM-Newton “Large Programs” in 2006 October.
2. X-ray observation and Data Reduction
Our observation of PSR J07373039 was carried out in two consecutive XMM-Newton orbits. The first part of the observation started on 2006, October 26 at 00:28:15 UT and lasted 119.8 ks, the second one started on October 28 at 00:28:37 UT and lasted 114.5 ks. In total, the observation allowed the coverage of 26 revolutions of the binary system ( s). The pn camera (Strüder et al., 2001) was operated in Small Window mode (imaging across a field of view with a 5.67 ms time resolution) with the medium optical filter. The MOS cameras (Turner et al., 2001) were also set in the Small Window mode (yielding a field of view in the central CCD, with a time resolution of 0.3 s) with the medium filter. The data were processed using standard pipeline tasks (emproc and epproc) of the XMM-Newton Science Analysis Software version 7.1.0.
In view of the faintness of PSR J07373039 in soft X-rays, particular care in selecting source photons and reducing background contamination is crucial. We used only photons with pattern 0–12 for the MOS cameras, while for the pn we used pattern 0–4 for energies above 0.4 keV and pattern 0 for the keV energy range. Such an event selection allows one to reduce by a factor 3.5 the background count rate in the 0.15–0.4 keV energy range in the pn camera, while leaving almost unchanged the source count rate.
We evaluated the optimal selection of source events by maximizing the source signal-to-noise ratio in the 0.15–10 keV range, as a function of:
Source extraction region.—We considered different extraction radii in the 10–30 range; the background was extracted in each case from two rectangular regions located at the same distance from the readout node as the source region.
Threshold for high particle background screening.—The observations are
affected by a few short soft proton flares. We extracted a light curve in the
0.15–10 keV range with a 10 s time bin from the whole field of view for each
camera. Following the prescription by De Luca & Molendi (2004), we identified the
quiescent average count rate and considered different thresholds in the
2– range from this average rate.
The optimal choice turned out to be a source extraction radius of for the pn and the MOS 1 cameras and of for the MOS 2 camera (which has a higher low-energy background) and a threshold at from the quiescent rate to screen from high particle background episodes. The resulting source and background count statistics are shown in Table 1.
| Total | Background | Exposure | ||
|---|---|---|---|---|
| Orbit | Detector | Countsaafootnotemark: | fractionbbfootnotemark: (%) | timeccfootnotemark: (ks) |
| 1260………. | pn | 2483 | 24.5 | 80.7 |
| 1260………. | MOS 1 | 652 | 21.7 | 111.5 |
| 1260………. | MOS 2 | 750 | 26.1 | 112.3 |
| 1261………. | pn | 2222 | 23.6 | 74.9 |
| 1261………. | MOS 1 | 587 | 19.7 | 102.9 |
| 1261………. | MOS 2 | 697 | 29.5 | 103.9 |
3. Timing Analysis
3.1. Pulsations from PSR J07373039A
For the search of pulsations at the spin period of pulsar A we could only use the pn data (4700 counts), owing to the inadequate time resolution of the MOS data. The times of arrival were converted to the solar system barycenter and corrected for the orbital motion and relativistic effects of the binary system according to Blandford & Teukolsky (1976). This was done with a program we wrote ad hoc and tested using an XMM-Newton observation of the binary millisecond pulsar XTE J1751305 (Miller et al., 2003). As a further cross-check, we also compared the rotational phases obtained by our program with those resulting from the Tempo timing analysis software.111See http://www.atnf.csiro.au/research/pulsar/tempo. The maximum discrepancy between timing corrections from our program and Tempo is at most a few microseconds.
In our search for pulsations we employed the test (Buccheri et al., 1983), where we indicate with the number of harmonics. We examined a wide frequency range centered on the value predicted at the epoch (MJD 54 034) of our XMM-Newton observation by the radio measurements of Kramer et al. (2006). The most significant statistics occurred for at ms (1 errors in the last digit are quoted in parentheses). The corresponding value is 378.91, which even when taking into account the searched periods, has a virtually null probability of chance occurrence. Our best-fit period is consistent with the value ms expected from the radio ephemeris of Kramer et al. (2006).
The background-subtracted and exposure-corrected light curve of pulsar A in the 0.15–4 keV energy range is shown in the top panel of Figure 1 (due to the soft pulsar spectrum, the signal-to-noise ratio above 4 keV is very small). Error bars are calculated according to the expression , where , and are respectively the total counts, background counts, and exposure in the bin , and is the ratio between the source and background extraction area (). We checked that the pulsations are significantly detected down to the lowest energy bins covered by the pn instrument; in fact, the Pearson statistics for a 10 bin light curve in the 0.15–0.2 keV range gives a reduced (hereafter ) of 3.85, corresponding to a 4 detection.

The pulse profile is double peaked and deeply modulated, with a pulsed fraction of in the energy range 0.15–4 keV. To calculate the pulsed flux, we considered all the counts above the minimum of the light curve, using the expression and its associated error , where are the total counts, is the number of bins in the light curve and are the counts of the minimum. The expression used by Chatterjee et al. (2007) does not account for the pulsed flux associated with secondary peaks; nevertheless their pulsed fraction value is in agreement with our result within 1. Both methods are “bin dependent,” but reasonable different choices of the number of bins (i.e. ) do not significantly affect the results. Note that the pulsed fraction upper limit of 60% obtained in the short 2004 XMM-Newton observation referred to a sinusoidal profile (Pellizzoni et al., 2004), and therefore it is not inconsistent with the present result.
A simple hardness ratio analysis, based on the soft (: 0.15–0.3 keV) and hard (: 0.8–3 keV) energy ranges,222The hardness ratio is defined as , where for each phase bin and are the background-subtracted count rates in the hard and soft ranges. indicates a softer spectrum in correspondence to the minimum in the folded light curve (see bottom panel of Figure 1). To investigate the energy dependence of the pulsed fraction in more detail and as a cross-check of complementary phase-resolved spectral studies discussed below, we produced the folded light curves for four different energy ranges (0.15–0.3 keV, 0.3–0.5 keV, 0.5–0.8 keV, and 0.8–3 keV) providing 800–900 source counts each (Figure 2). The corresponding pulsed fractions, plotted in Figure 3, increase from 50% to 90% from lower to higher energies. These values have a probability smaller than 1% of deriving from an energy-independent distribution.


We searched for possible flux and pulse profile variations due to the pulsars’ mutual interaction as a function of the orbital phase. For example, if there is a bow shock structure as that described in Lyutikov (2005), associated with an unpulsed variable component (see § 5), we would expect variations in the total flux correlated with changes in the pulsed fraction. In Figure 4 (top) we report the pulsed fraction and total flux obtained from the folded 0.15–3 keV light curves integrated in four orbital phase intervals. The pulsed fraction varies in the 50%–80% range with the minimum corresponding to the superior conjunction of A (when A is occulted by B; dotted line). However, the values are consistent at the 5.5% level with a uniform distribution and there is no corresponding change in the total flux. A similar analysis dividing the orbit in eight parts (Figure 4, bottom) gave only marginal evidence of a 15% variability (null hypothesis probability null hypothesis probability = 1.5%) in the pn flux.


To calculate upper limits on orbital flux modulation, we considered the fraction of the counts above the minimum of the light curve with error evaluation similar to those described in this subsection. For time scales of 15 min (10 bins) the 1 upper limits on variability (pn+MOS data) is of 11.5% for the 0.15–4 keV range and 20%–30% for the selected bands mentioned above. Longer time-scales of 0.5–1 hr imply upper limits 10 on all energy selections. The search for orbital and aperiodic variability, even when selecting the time intervals corresponding to the minimum in the PSR A folded light curve, does not improve the above upper limits.
3.2. Pulsations from PSR J07373039B
We searched for pulsations from PSR B using the same method and radio ephemeris reference as for PSR A (Kramer et al., 2006), but in this case, owing to the longer pulse period, we could also use the lower time resolution MOS data. The expected pulsar period at the epoch of our observation is s, with an uncertainty orders of magnitude smaller than the intrinsic pulse search resolution of our data set, s. Thus, if the rotational parameters of the neutron star are stable (as suggested by radio ephemeris), a single-trial pulse search at is appropriate. However, since we cannot in principle exclude that (unlikely) glitches and/or significant timing noise occurred in the time between the radio and X-rays observations, we also performed a search in a range of periods around . In any case, no significant pulsations were detected in the whole energy range nor in our canonical bands (0.15–0.3 keV, 0.3–0.5 keV, 0.5–0.8 keV, and 0.8–3 keV) providing 1200–1400 source counts each. The upper limit on the pulsed flux fraction is of 40%.
Since the radio flux of PSR B is strongly modulated as a function of the orbital phase and is nearly disappearing for most of the orbit (Lyne et al., 2004; Burgay et al., 2005), we also performed an orbital phase-dependent pulse search. We folded the counts at for four orbital phase intervals around the pulsars’ conjunctions (0.16–0.41] and [0.66–0.91]) and quadratures (0.41–0.66] and [0.91–1.16]). As a reference, consider that orbital phase 0.28 corresponds to the superior conjunction of A. A positive detection of the PSR B pulsations in the pn data set is obtained for the phase interval corresponding to the ascending quadrature of B (0.41–0.66]). The Pearson statistics for the pulse histogram with 20 bins (250 mean source counts per bin) in the 0.15–3 keV band provides a of 2.4 (19 degrees of freedom [dof]) corresponding to a probability of only 0.06% that the profile is drawn from a uniform distribution (). A further analysis with the test supports the detection; with the number of harmonics being varied from 1 to 5, we found a statistically significant signal for (, 4.2) and 5 (, 3.8). No significant detections are obtained for the other orbital phase intervals (, 19 dof).
We tried to better constrain the orbital phase interval corresponding to a positive detection of PSR B by shifting and/or shortening the orbital phase intervals of the period search. However we did not find more significant detections, and considering the low-statistics pulsed data, we cannot derive tighter constraints.
As mentioned above, the stability of the timing parameters of this neutron star is likely, but not guaranteed. Thus, in principle, a strict single-trial search at the predicted value might not be the optimal strategy. Furthermore, a blind search in period is an important cross-check to claim a robust pulsed detection. We therefore also searched for other peaks in the distributions around . We did not find more significant detections apart from values close (within the pulse search resolution) to (Figure 5). The best-fit pulse period is s providing a probability of only (, 4.9) that we are sampling a uniform distribution.

The resulting pn light curves for the four phase intervals considered are shown in Figure 6. The pulse profile appears highly structured and with a pulsed flux fraction of % in the energy range 0.15–3 keV.

The detection of PSR B in MOS data is only marginal, and the analysis of merged MOS and pn data does not provide better detection significance (even when selecting counts which are in the lowest emission bins of the pulse profile of PSR A), probably because the 0.3 s time resolution of the MOS dilutes the sharp peaks of the light curve. Furthermore, the poor effective area of the MOS at low energies (i.e. negligible in the 0.15–0.3 keV band) is not efficient for pulse searches in sources with very soft spectra. In fact, although PSR B is also marginally detected at keV (, 19 dof), most of the flux contributions to the main peaks of its light curve come from the low-energy band.
In the hypothesis that PSR B is emitting X-rays only in the orbital phases in which we can firmly claim pulse detection, an orbital flux variability with magnitude comparable with the pulsed flux fraction should be present. In fact, there is marginal evidence that the pn total flux peaks around when B’s pulses appear (Figure 4). It is worth noting that the sum of the pulsed emission of the two pulsars roughly accounts for the whole X-ray flux, not allowing for a significant amount of emission from other sources (e.g. shock emission from the pulsars’ mutual interactions).
4. Spectral analysis
Source and background spectra were extracted from the pn and MOS data using the regions and soft protons filtering criteria described in § 2. For what concerns the pn pattern selection, we used only single events (pattern 0) for the whole energy range in order to reduce the background in the lowest energy channels. We checked that fully consistent results were obtained including double events (pattern 0–4).
Each spectrum was fitted with the XSPEC version 11.3.2 software package using four models, all modified by photoelectric absorption (phabs model with cross section from Balucinska-Church & McCammon 1992 and abundances from Anders & Grevesse 1989): power law (PL), blackbody (BB), two blackbodies (BBC+BBH), and power law plus blackbody (PL+BB). The best-fit parameters for the pn spectrum and for a simultaneous fit of the pn, MOS 1, and MOS 2 spectra are reported in Table 2.
| bbfootnotemark: | bbfootnotemark: | (dof) | |||||||
|---|---|---|---|---|---|---|---|---|---|
| Instrument | Model | () | PL norm.aafootnotemark: | (eV) | (m) | (eV) | (km) | ||
| pn……………………. | PL | 4.6 | 9.40.6 | 1.38 (50) | |||||
| BB | 0 | 142 | 149 | 3.29 (50) | |||||
| BBH+BBC | 280 | 23 | 110 | 0.23 | 1.14 (48) | ||||
| PL+BB | 6.6 | 160 | 60 | 1.20 (48) | |||||
| pn+MOS…………. | PL | 5.0 | 3.4 | 9.6 | 1.16 (98) | ||||
| BB | 0 | 147 | 138 | 3.05 (98) | |||||
| BBH+BBC | 290 | 20 | 114 | 0.21 | 1.00 (96) | ||||
| PL+BB | 3.01.1 | 6.51.0 | 20 | 8030 | 0.92 (96) |
In contrast with the previous short Chandra and XMM-Newton observations (McLaughlin et al., 2004a; Pellizzoni et al., 2004; Campana et al., 2004), single-component models fail to properly fit the data. A blackbody model is completely ruled out and only a very steep power law provides a barely acceptable fit (null hypothesis probability %). Either a double-blackbody or a power law plus blackbody model are instead an adequate fit (null hypothesis probability 50%). In the two-component models, the derived column density is also in better agreement with the value estimated from the radio pulsars’ dispersion measure ( cm-2, assuming 1 H for each electron; Campana et al. 2004). The power law photon index in the PL+BB model is still very soft. A hard power law with photon index , as expected for a shock emission, does not provide an acceptable fit. The observed flux in the 0.2–3 keV energy range is erg cm-2 s-1, corresponding to an unabsorbed luminosity L erg s-1 for the PL+BB model. The radio dispersion measure distance of 500 pc is based on a model for the interstellar electron density (Cordes & Lazio, 2002), and the parallactic distance ranges from 0.2 to 1 kpc (Kramer et al., 2006), implying uncertainties of a factor 4 in luminosity estimates.
The good timing resolution coupled to the simultaneous spectral capability of the pn data, together with the relatively large number of detected source photons, allowed us to perform for the first time a phase-resolved spectral analysis for PSR A. Three spectra were extracted by selecting the pn events (with pattern equal to 0) in the three phase intervals shown in Figure 1, corresponding to the off-pulse (phase A), the interpulse (phase B), and the main pulsation peak (phase C). The results of the fit of these three spectra with the four models used for the phase-averaged spectrum are shown in Table 3.
| Model | Phase | PL norm.aafootnotemark: | bbfootnotemark: | bbfootnotemark: | (dof) | ||||
|---|---|---|---|---|---|---|---|---|---|
| interval | () | (eV) | (m) | (eV) | (km) | ||||
| PL…………………….. | A | 2.9 | 1.37 (9) | ||||||
| B | 3.3 | 8.6 | 0.99 (23) | ||||||
| C | 13.4 | 1.11 (42) | |||||||
| BB…………………….. | A | 0 | 118 | 149 | 2.57 (9) | ||||
| B | 0 | 141 | 138 | 2.16 (23) | |||||
| C | 0 | 146 | 167 | 2.67 (42) | |||||
| BBH+BBC…………. | A | 13040 | 29 | 35.8 | 0.94 (7) | ||||
| B | 370 | 11 | 120 | 0.18 | 0.86 (21) | ||||
| C | 260 | 34 | 100 | 0.30 | 1.00 (40) | ||||
| PL+BB………………. | A | 0.02 | 120 | 1.14 (7) | |||||
| B | 2.0 | 5.3 | 120 | 0.140.09 | 0.88 (21) | ||||
| C | 9.7 | 190 | 50 | 0.95 (40) |
A single-blackbody model does not provide an acceptable fit for any of the three spectra. We also note that, while the best-fit parameters of the main peak (phase C) and interpulse (phase B) are very similar to those of the phase-averaged spectrum, the fits of the off-pulse spectrum (phase A) with the two-component models converge to rather different values for some parameters. In particular, in the double-blackbody model, one of the two blackbodies has a temperature 10 times smaller (and a correspondingly larger emitting area) than in the other two phase intervals. Moreover, in the PL+BB model the power law component is steeper, and in both cases, the column density is significantly larger.
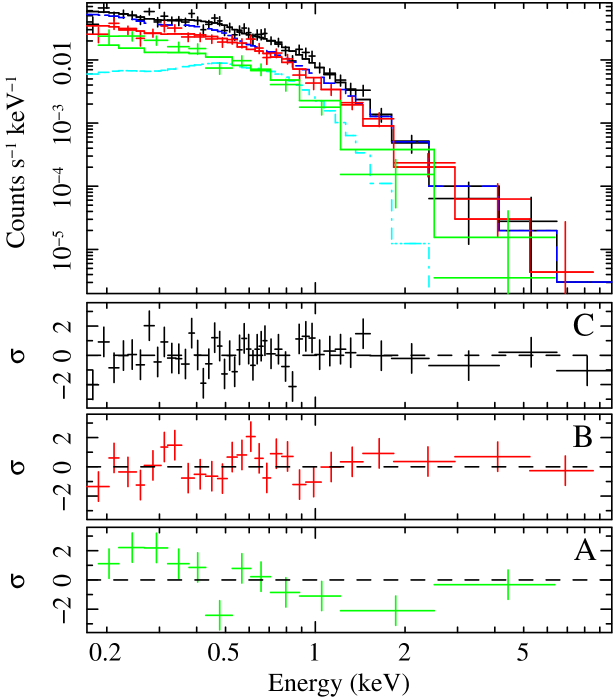
To better check if the source spectrum is actually changing with the phase of PSR A, we simultaneously fitted the three phase-resolved spectra with the same blackbody plus power law model with all the parameters linked together, except for an overall normalization factor. A globally acceptable fit is obtained, but if we compute separately the for each, fixing all the parameters to the best-fit values of the simultaneous fit, we note that the fit of the off-pulse spectrum is unacceptable (see Table 4). The corresponding residuals (see Figure 7) show a soft excess in the off-pulse spectrum, confirming the softening in the pulse minimum already displayed in the hardness ratio (see Figure 1).
| Fixed | Variable | Phase | PL | bbfootnotemark: | bbfootnotemark: | ||||||
|---|---|---|---|---|---|---|---|---|---|---|---|
| component | component | interval | () | norm.aafootnotemark: | (eV) | (m) | (eV) | (km) | (dof) | (dof) | |
| A | 3.0 | 45 | 2.15 (12) | ||||||||
| PL+BBccfootnotemark: | B | 5.91.5 | 150 | 60 | 0.84 (26) | 1.15 (76) | |||||
| C | 9.8 | 80 | 0.89 (45) | ||||||||
| A | 2.2 | 0.71 (12) | |||||||||
| BBH+BBC | PL | B | 6.9 | 3.3 | 6.0 | 110 | 32 | 15 | 0.96 (26) | 1.00 (74) | |
| C | 12.8 | 0.91 (45) | |||||||||
| A | 45 | 1.70 (12) | |||||||||
| PL+BBC | BBH | B | 1.6 | 2.2 | 2.3 | 16614 | 70 | 84 | 0.26 | 0.94 (26) | 1.37 (74) |
| C | 110 | 1.25 (45) |
We also tested the possibility that separate physical processes, producing different spectral components, were responsible for the pulsed and unpulsed emission. A first hypothesis, already proposed by Chatterjee et al. (2007), where a blackbody accounts for the unpulsed emission and a power law for the pulsation is immediately discarded by the fact that the off-pulse spectrum cannot be well fitted by a single-blackbody model (see Table 3).
The off-pulse spectrum is instead well fitted by two-blackbodies. Therefore we tried to fit the phase-resolved spectra with a three-component model composed of two constant blackbodies and a power law with stable photon index and variable normalization. The resulting fit is very good and its parameters are shown in Table 4.
Since a good fit of the off-pulse spectrum is also obtained using a PL+BB model (see Table 3), we also tested a model where the unpulsed spectrum was composed by a blackbody plus a power law and a second blackbody was responsible for the pulsed emission. In this model, the two blackbodies might come from the surface of the two pulsars and the power law from a shock. However, the resulting fit, also reported in Table 4, is not acceptable.
5. Discussion
Our deep XMM-Newton observation of the double-pulsar PSR J07373039 reveals a complex X-ray phenomenology that cannot be simply ascribed to PSR A alone, although it is clear that the only significant power plant of the system (apart from its strong gravitational potential) is the spin-down energy release of this pulsar.
We confirmed deeply modulated pulsed X-ray emission from PSR A and we also detected for the first time X-ray pulsations from PSR B. The rotational energy loss of PSR B is by far insufficient to produce the observed X-ray luminosity. It can also be excluded that the observed PSR B’s X-rays derive from residual internal heat of this 50 million years old pulsar. Therefore, this detection gives strong evidence for the mutual interactions of the two pulsars also at high energies. Although, as discussed below, there is no direct evidence of a termination shock between their winds and magnetospheres, we interpret the PSR B emission, visible only at the orbital phases in which the PSR A beam intercepts PSR B, as ultimately powered by PSR A.
We found that double-component models are required to account for the spectral phenomenology of the double-pulsar X-ray emission. A double-blackbody (BBC, eV and BBH, eV) provides a good fit, while a PL+BB model with a blackbody temperature of eV and a soft photon index of 3.2 is even better.
It is interesting to compare the relative contribution of each spectral component to the total flux with the pulsed fraction of PSR A in order to test whether the pulsed flux could be ascribed to a specific thermal or non thermal component (or to a particular combination of them). For the case of the PL+BB model, the power law component contributes to 76% of the pn counts in the 0.15–4 keV band, a value in perfect agreement with the pulsed fraction of PSR A ()% in the same energy range. However, the tentative association of most of the non thermal flux in the PL+BB model with the pulsed flux is ruled out by observing that, in this hypothesis, the steep power law should strongly contribute to the pulsed flux especially at low energies, but this is not the case; the power law contributes 86% of the counts in the 0.15–0.3 keV band, a value much higher than the corresponding pulsed flux (50%) as shown by the stars plotted in Figure 3. A similar argument applies for the case of the double-blackbody model (see triangles plotted in Figure 3). These results are confirmed by the phase-resolved spectra of PSR A showing that the off-pulse spectrum cannot be well fitted by a single-component model.
More generally, none of the double-component best-fit models are compatible with the plot in Figure 3, even with the assumption that the pulsed flux results from a combination of both spectral components. In fact, the total flux of the softer spectral component (either the power law or the colder blackbody) is 3–4 times higher than that of the harder component. Therefore, it is impossible to invert the trend in Figure 3 even when assuming that the harder component is fully pulsed. For example, in the case of the PL+BB model, assuming that the pulsed flux is due to the full blackbody component plus a part of the power law component, it is impossible to obtain a pulsed fraction that is increasing with energy. Therefore, the entire X-ray flux of the double-pulsar system cannot be interpreted as a simple combination of a non thermal and single-temperature thermal emission from PSR A or PSR B. Therefore, on the basis of these considerations and of the spectral results of § 4 we are led to consider models based on three spectral components.
The inclusion of an additional cooler blackbody BBC (possibly related to PSR B) in the PL+BB model can account for the small pulsed fraction at low energy. Three-component models where blackbody emission (BBH) is responsible for most of the pulsed emission from PSR A do not provide an acceptable spectral fit (see Table 4) and fail to match pulsed flux fractions in Figure 3. Assuming instead that most of the pulsed PSR A flux is due to the power law, it is possible to reproduce the trend seen in Figure 3 (squares). This is also the best three-component scenario compatible with the phase-resolved spectrum of PSR A (see § 4, Table 4). It is worth noting that the phase-resolved spectrum of PSR A does not reveal any variation apart from a significant softening in the off-pulse phases, in agreement with the proposed three-component model.
The best three-component model fitting phase-resolved spectrum of PSR A and pulsed fluxes of both pulsars is thus composed of a power law with photon index and 0.2–3 keV luminosity erg s-1, a cooler (30 eV) blackbody with bolometric luminosity erg s-1, and a hotter blackbody (130 eV) with luminosity erg s-1. The emission from PSR A is mostly non thermal, its luminosity being equal to plus the possible additional smaller contribution of ; in the 0.2–3 keV energy range.
Because of the softness of the spectrum, the efficiency of the conversion of rotational energy loss into X-ray luminosity is strongly sensitive to the energy range considered. The PSR A luminosity in the 0.1–10 keV range matches , the value typically found for recycled radio pulsars that are detected at X-ray energies (Becker & Trümper, 1999). As expected from a mostly magnetospheric emission, pulse peaks are still relatively steep and far from thermal broad sinusoidal pulsations seen in other recycled pulsars with comparable spin parameters (Zavlin et al., 2002). Non-thermal deeply modulated components are instead seen in the pulsed flux of the most energetic recycled pulsars (e.g. PSR B182124). The peculiar nature of PSR A is also stressed by the fact that no other recycled pulsar with such a steep non thermal emission component is known.
The observed equivalent emitting radius of BBH is one order of magnitude smaller than the polar cap radius of PSR A (1 km), but modeling with a non-uniform temperature of the heated region (Zavlin et al., 2002) or invoking a partially filled polar cap (Harding & Muslimov, 2002) could solve this discrepancy. Thus, we can interpret BBH as due to the heating of A’s polar cap from back-flowing particles in its magnetosphere. The light curve of PSR A shows a bridge between the two peaks 2–3 times higher than the off-pulse flux, leading to the idea that both non thermal pulses emerge from a wide, center-filled thermal emission cone from the magnetic pole possibly associated to BBH.
5.1. The nature of PSR B X-ray emission
We detected PSR B during part of the orbit, around the ascending node. Its 0.2–3 keV flux estimated from the pulsed light curve is erg cm-2 s-1 and corresponds to ()% of the total flux in the orbital phase interval 0.44–0.61. The corresponding luminosity of erg s-1 represents 20% of the spin-down energy loss, a value much higher than observed in all the other normal pulsars (Possenti et al., 2002).
The PSR B emission is likely associated to the cooler blackbody emission BBC ( eV), with the possible addition of the weaker and hotter component BBH (if the latter is not associated to PSR A). In this case, the bolometric luminosity of PSR B can be calculated as erg s-1 assuming it is emitted during one-fourth of the orbit ( and are orbital phase-averaged luminosities). This luminosity is surprisingly much higher than the X-ray emission from PSR A (assuming erg s-1). Obviously, X-ray emission from PSR B can only be powered by an external source, i.e. the spin-down energy from PSR A. In this hypothesis, 2% of the rotational energy loss of PSR A is converted into thermal radiation from PSR B.
Zhang & Loeb (2004) explain the strong brightening of pulsed radio flux from PSR B in two portions of the orbit as episodes during which pairs from PSR A’s wind flow into the open field line region of pulsar B and emit curvature radiation at radio frequencies within an altitude of cm. Once pairs from A’s wind leak into B’s magnetosphere, they will stream all the way down, heating the surface of B, giving rise to thermal radiation. According to this model, the predicted X-ray luminosity is erg s-1, and the typical temperature of the polar cap of PSR B is keV, where is the fraction of all pairs from A’s bow shock injected into B’s open field line region and is the unknown solid angle of A’s wind.
The X-ray luminosity predicted by the model is in good agreement with our results if we assume that PSR A’s wind is anisotropic (i.e. sr), as heuristically suggested by the variable illumination inducing radio and X-ray emission of PSR B. Within the above anisotropy assumption, the required efficiency is (poorly) constrained to 50% to match the observed PSR B luminosity.
However, according to this model, PSR B’s surface would be heated to a temperature (500 eV) higher than the observed values of BBC and BBH. This discrepancy could be due to the fact that most of the predicted luminosity (BBC) comes from a region larger than the polar cap and consistent with the whole neutron star’s surface. The hotter component is consistent in size with the polar cap and could be responsible for the observed pulsations.
In radio, the shape and the intensity of the pulse profile of PSR B vary with orbital longitude, with two bright phases centered around longitudes (with respect to the ascending node) of 210 (bright phase 1 [bp1], orbital phase 0.11) and 280 (bright phase 2 [bp2], orbital phase 0.31) at the epoch of first observations (Lyne et al., 2004). Because of the geodetic precession of pulsars’ spins and periastron advance, these bright phases are shifting to greater longitudes at a rate of a few deg yr-1 (Burgay et al., 2005). At the epoch of our XMM-Newton observation, the centroid of the radio bright phase bp2 is expected at 300 of longitude (orbital phase 0.36). The brightening of PSR B in X-rays appears in the orbital phase interval adjacent to (following) bp2 and peaks around the ascending node. When PSR A’s wind intercepts PSR B’s magnetosphere, it powers radio emission and it starts heating B’s surface. The X-ray emission from B lasts for min each orbit (detection significance fades outside this range) constraining the thermal inertial time of the neutron star in good agreement with theoretical expectations for external heating of a pulsar surface (Eichler & Cheng, 1989).
5.2. Constraints on X-ray emission from a bow shock between PSR A’s wind and PSR B’s magnetosphere
The short occultation of A by B seen in the radio band (Lyne et al., 2004; McLaughlin et al., 2004c, b) could imply the presence of a dense magnetosheath enfolding the magnetosphere of PSR B, although all the absorption could occur from within the PSR B’s magnetosphere alone (Lyutikov & Thompson, 2005). In the magnetosheath model, the relativistic wind from A collides with B’s magnetic field at an equilibrium distance from B comparable or smaller than the radius of its light cylinder (Arons et al., 2005; Lyutikov, 2004). Thus, in contrast with termination shocks seen in pulsar wind nebulae (PWNe) typically at distances light cylinder radii, a termination shock between PSR A and PSR B could probe the properties of a pulsar’s relativistic wind at a smaller distance from the central engine than ever studied before. PWNe are usually strongly radiative at high energies with typical efficiencies to . Therefore, some trace of a peculiar PWN originating from PSR B’s magnetic pressure confining the wind outflow from A should be in principle found as a non thermal component in our data.
An important issue concerning such a bow shock/magnetosheath model is that one might expect a flux modulation as a function of the orbital phase owing to the changing view of the shock front. In particular, the shocked wind is expected to flow away from the head of the bow shock in a direction roughly parallel to the shock (Lyutikov, 2004; Granot & Mészáros, 2004). This might imply relativistic beaming of the radiation emitted by the shocked plasma, resulting in a 50 modulation of the observed emission as a function of the orbital phase with possible peaks at 90 from conjunctions.
The upper limits we obtained on the flux variations as a function of the orbital phase allow us to exclude any significant orbital modulation 15% in X-rays (§ 3.1). Assuming that most of the unpulsed flux of the system (10%–50% of the total flux depending on the selected energy range) could be ascribed to the bow shock, flux variations should have been detected. In fact, the range of allowed spectral slopes of non thermal components in our spectral fits is not compatible with the “canonical” shock value , although a soft post-shock spectrum could be explained with the presence of an unusual low-energy relativistic electron population, as required in the magnetosheath model to provide A and B’s eclipses by synchrotron absorption (Arons et al., 2005; Lyutikov, 2004). Nevertheless, the off-pulse spectrum of PSR A is not even compatible with a simple non thermal emission, and PSR B would fill most of it at least for the part of the orbit in which it is detected. Therefore there is not much room left for a shock emission component in our data. An upper limit (90% confidence level) of erg s-1 (0.2–3 keV) corresponding to an efficiency of can be obtained by evaluating the maximum allowed luminosity of an unpulsed power law component with photon index 2 in the off-pulse spectrum of PSR A.
Such a low output in shock emission compared to typical PWN’s is not surprising looking at the small solid angle over which the wind from A is intercepted by B and considering that the termination shock of the wind is much closer than in known nebulae and that it could show a different phenomenology.
Assuming that the wind energy is radiated isotropically from PSR A and that it is intercepted by a sphere centered on PSR B with radius equal to its light cylinder , the resulting shock emission efficiency is , where is pulsars’ separation, is the fraction of power intercepted by the shock feeding into the accelerated electrons (it is a function of the unknown magnetization parameter ), and is a normalization factor to fit observed “standard” PWNe X-ray efficiencies, where . Kennel & Coroniti (1984a, b) provide an extensive discussion of the shock power function that is proportional to for (high- shocks have poor efficiency) and is 1 for . Figure 8 shows the resulting curve as a function of the magnetization parameter accounting for uncertainties (hatched area) associated with the actual size of the region intercepting the shock (it could be a factor 5 smaller than according to pressure balance) and errors on due to the observed span in PWNe efficiencies. For low values of the magnetization parameter, the shock could theoretically account for a significant fraction of the X-ray luminosity, but this is not the case; the observed upper limit (dot-dashed line) constrains the magnetization parameter to values 1 and, thus, much higher than those estimated for Crab-like PWNe. Such an high magnetization parameter is apparently inconsistent with the value of 0.03 predicted by the magnetosheath model (Arons et al., 2005), and it seems to confirm most of the modern wind models (Contopoulos & Kazanas, 2002; Lyubarsky & Kirk, 2001) predicting .

Granot & Mészáros (2004) proposed a model in which the emission from the interaction of the two pulsars is lower than that expected from the interaction of pulsar A’s wind alone with the interstellar medium. Thus, PSR A could provide a “standard” PWN () at distances of cm from the pulsar surface. In this model, little or no modulation with the orbital periods and is expected, but even in this case it is difficult to account for the steepness of the unpulsed spectrum. Furthermore, the predicted luminosity of this model in the energy range (0.2–10 keV) is erg s-1, much higher than our upper limit on the shock component discussed above.
6. Conclusions
The analysis of the 5600 source photons obtained from our 230 ks long XMM-Newton observation confirmed the pulsed detection in X-ray of the PSR A emission providing 80% of the total absorbed flux from the system. For the first time, X-ray emission from PSR B is also detected with good confidence (200–300 pulsed counts) around the ascending node of the orbit.
A three-component spectral model can satisfactorily fit phase-resolved spectra and the energy dependence of the PSR A pulsed fraction. The best-fit model is composed of a soft power law responsible for most of the pulsed emission from PSR A (accounting for only 15% of the total unabsorbed luminosity at keV), a cooler (30 eV) blackbody likely associated to PSR B, and a hotter and fainter thermal component originating from back falling particles heating polar caps of either PSR A or PSR B ( m). Note that the cooler blackbody accounts for most of the bolometric luminosity, even if its contribution in the XMM-Newton energy range is small.
PSR A shows peculiar properties with respect to other known recycled pulsars (e.g. the softest non thermal spectrum), possibly due to the particular evolutionary history of a double-neutron star system. The phenomenology of PSR B is completely different from that of any other pulsar and the only viable possibility to explain its X-ray emission seems that it is powered by PSR A’s wind heating B’s surface. Our observation is in good agreement with theoretical predictions by models also explaining B’s radio flares (Zhang & Loeb, 2004), although a more complex thermal emission scenario (colder and non uniform temperature) should be invoked.
There are no signs (e.g. orbital flux modulation, a significant non thermal component in PSR A’s off-pulse) of the presence of X-ray emission from a bow shock between PSR A’s wind and PSR B’s magnetosphere (Lyutikov, 2004; Arons et al., 2005) invoked to explain the occultation of the radio emission of PSR A at the inferior conjunction of PSR B. The upper limit on the flux of such a shock component constrains the wind magnetization parameter of PSR A to values 1, much higher than that predicted by the magnetosheath radio occultation of PSR A. The absorption causing A’s occultation is likely to occur within B’s magnetosphere which retains enough plasma to produce an eclipse (Lyutikov & Thompson, 2005).
Further X-ray observations of PSR J07373039 with XMM-Newton and Chandra with reasonable exposure times (1 Ms) would not significantly improve PSR B detection or better constrain the pulsar’s spectra. At gamma-ray energies, the absence of the strong thermal components seen in X-rays could instead allow one to reveal non thermal emission from the pulsars’ interactions and better constrain the magnetospheric emission from PSR A. The empirical relation between gamma-ray luminosity and for known gamma-ray pulsars (i.e, , Thompson, 2004; Zhang & Harding, 2000) yields erg s-1, a value compatible with the luminosity of the possibly related EGRET source 3EG J07473412 (Hartman et al., 1999) assuming the same distance. The gamma-ray pulsed emission of PSR A could be detected by the AGILE (Tavani et al., 2006) and GLAST333See http://glast.gsfc.nasa.gov/. missions.
Apart from PSR J07373039, the only other known X-ray-emitting double-neutron star binary (DNSB) is PSR J1537+1155 (Kargaltsev et al., 2006). The X-ray spectra of PSR J1537+1155 and PSR J07373039 are similar, and their X-ray luminosities are about the same fraction of the respective spin-down energies. We note that, if the other DNSBs also have a similar efficiency, no other known object of this class can be detected by the currently available X-ray telescopes. Unlike PSR J07373039, in PSR J1537+1155 the distribution of photon arrival times over the binary orbital phase shows a deficit of X-ray emission around apastron, supporting the idea that most of the emission is caused by interaction of the relativistic wind from the pulsar with its neutron star companion. The difference between the two DNSBs can be explained by the smaller eccentricity of PSR J07373039 or different alignments between the equatorial plane of the millisecond pulsar and the orbital plane of the binary (Kargaltsev et al., 2006). Despite PSR J1537+1155 being weaker than PSR J07373039, it may offer better diagnostics to discriminate emission produced by the shocked wind from “standard” pulsar magnetospheric and surface emission, and thus, it is one of the most interesting systems suitable for further X-ray investigations of the inner pulsar magnetospheres and wind parameters in compact systems.
References
- Anders & Grevesse (1989) Anders, E. & Grevesse, N. 1989, Geochim. Cosmochim. Acta, 53, 197
- Arons et al. (2005) Arons, J., Backer, D. C., Spitkovsky, A., & Kaspi, V. M. 2005, in ASP Conf. Ser. 328, Binary Radio Pulsars, ed. F. A. Rasio & I. H. Stairs, 95
- Arons & Tavani (1993) Arons, J. & Tavani, M. 1993, ApJ, 403, 249
- Balucinska-Church & McCammon (1992) Balucinska-Church, M. & McCammon, D. 1992, ApJ, 400, 699
- Becker & Trümper (1999) Becker, W. & Trümper, J. 1999, A&A, 341, 803
- Blandford & Teukolsky (1976) Blandford, R. & Teukolsky, S. A. 1976, ApJ, 205, 580
- Buccheri et al. (1983) Buccheri, R., Bennett, K., Bignami, G. F., et al. 1983, A&A, 128, 245
- Burgay et al. (2003) Burgay, M., D’Amico, N., Possenti, A., et al. 2003, Nature, 426, 531
- Burgay et al. (2005) Burgay, M., Possenti, A., Manchester, R. N., et al. 2005, ApJ, 624, L113
- Campana et al. (2004) Campana, S., Possenti, A., & Burgay, M. 2004, ApJ, 613, L53
- Chatterjee et al. (2007) Chatterjee, S., Gaensler, B. M., Melatos, A., Brisken, W. F., & Stappers, B. W. 2007, ApJ, 670, 1301
- Contopoulos & Kazanas (2002) Contopoulos, I. & Kazanas, D. 2002, ApJ, 566, 336
- Cordes & Lazio (2002) Cordes, J. M. & Lazio, T. J. W. 2002, preprint (astro-ph/0207156)
- De Luca & Molendi (2004) De Luca, A. & Molendi, S. 2004, A&A, 419, 837
- Eichler & Cheng (1989) Eichler, D. & Cheng, A. F. 1989, ApJ, 336, 360
- Granot & Mészáros (2004) Granot, J. & Mészáros, P. 2004, ApJ, 609, L17
- Harding & Muslimov (2002) Harding, A. K. & Muslimov, A. G. 2002, ApJ, 568, 862
- Hartman et al. (1999) Hartman, R. C., Bertsch, D. L., Bloom, et al. 1999, ApJS, 123, 79
- Kargaltsev et al. (2006) Kargaltsev, O., Pavlov, G. G., & Garmire, G. P. 2006, ApJ, 646, 1139
- Kennel & Coroniti (1984a) Kennel, C. F. & Coroniti, F. V. 1984a, ApJ, 283, 694
- Kennel & Coroniti (1984b) —. 1984b, ApJ, 283, 710
- Kramer et al. (2006) Kramer, M., Stairs, I. H., Manchester, R. N., et al. 2006, Science, 314, 97
- Lyne et al. (2004) Lyne, A. G., Burgay, M., Kramer, M., et al. 2004, Science, 303, 1153
- Lyubarsky & Kirk (2001) Lyubarsky, Y. & Kirk, J. G. 2001, ApJ, 547, 437
- Lyutikov (2004) Lyutikov, M. 2004, MNRAS, 353, 1095
- Lyutikov (2005) —. 2005, MNRAS, 362, 1078
- Lyutikov & Thompson (2005) Lyutikov, M. & Thompson, C. 2005, ApJ, 634, 1223
- McLaughlin et al. (2004a) McLaughlin, M. A., Camilo, F., Burgay, M., et al. 2004a, ApJ, 605, L41
- McLaughlin et al. (2004b) McLaughlin, M. A., Kramer, M., Lyne, A. G., et al. 2004b, ApJ, 613, L57
- McLaughlin et al. (2004c) McLaughlin, M. A., Lyne, A. G., Lorimer, D. R., et al. 2004c, ApJ, 616, L131
- Miller et al. (2003) Miller, J. M., Wijnands, R., Méndez, M., et al. 2003, ApJ, 583, L99
- Pellizzoni et al. (2004) Pellizzoni, A., De Luca, A., Mereghetti, S., Tiengo, A., Mattana, F., Caraveo, P., Tavani, M., & Bignami, G. F. 2004, ApJ, 612, L49
- Possenti et al. (2002) Possenti, A., Cerutti, R., Colpi, M., & Mereghetti, S. 2002, A&A, 387, 993
- Strüder et al. (2001) Strüder, L., Briel, U., Dennerl, K., et al. 2001, A&A, 365, L18
- Tavani et al. (2006) Tavani, M., et al. 2006, Proc. SPIE, 6266, 2
- Thompson (2004) Thompson, D. J. 2004, in Astrophysics and Space Science Library, Vol. 304, Cosmic Gamma-Ray Sources, ed. K. S. Cheng & G. E. Romero, 149
- Turner et al. (2001) Turner, M. J. L., Abbey, A., Arnaud, M., et al. 2001, A&A, 365, L27
- Zavlin et al. (2002) Zavlin, V. E., Pavlov, G. G., Sanwal, D., Manchester, R. N., Trümper, J., Halpern, J. P., & Becker, W. 2002, ApJ, 569, 894
- Zhang & Harding (2000) Zhang, B. & Harding, A. K. 2000, ApJ, 532, 1150
- Zhang & Loeb (2004) Zhang, B. & Loeb, A. 2004, ApJ, 614, L53