Enhanced thermal stability and spin-lattice relaxation rate of N@C60 inside carbon nanotubes
Abstract
We studied the temperature stability of the endohedral fullerene molecule, N@C60, inside single-wall carbon nanotubes using electron spin resonance spectroscopy. We found that the nitrogen escapes at higher temperatures in the encapsulated material as compared to its pristine, crystalline form. The temperature dependent spin-lattice relaxation time, , of the encapsulated molecule is significantly shorter than that of the crystalline material, which is explained by the interaction of the nitrogen spin with the conduction electrons of the nanotubes.
pacs:
73.63.Fg, 72.80.Rj, 76.30.-vI Introduction
Fullerenes encapsulated inside single-wall carbon nanotubes (SWCNTs)Iijima and Ichihashi (1993); Bethune et al. (1993) is an interesting molecular nanostructure as it combines two fundamental forms of carbon. The existence of this so-called peapod structure Smith et al. (1998) inspired a number of fundamental and application oriented studies. The growth of peapods was studied with molecular dynamics simulations Berber et al. (2002) and the existence of the structure was explained by the net energy gain per encapsulated fullerenes Melle-Franco et al. (2003); Rochefort (2003); Otani et al. (2003); Dubay and Kresse (2004). Peapods turned out to be a model system to study molecular interactions such as fullerene polymerization Pichler et al. (2001) and guest-host interactions Pfeiffer et al. (2004) and they are also the precursors to double-wall carbon nanotubes Bandow et al. (2001); Pfeiffer et al. (2003) which enabled the growth of 13C isotope enriched inner tubes Simon et al. (2005). Concerning applications, peapods were found to show ambipolar field transistor effect Shimada et al. (2002) and modified field emission characteristics as compared to empty SWCNTs Lyashenko et al. (2005).
An intriguing class of peapods is that with encapsulated magnetic fullerenes such as metallofullerenes with magnetic rare-earth ions Shimada et al. (2002), the endohedral N@C60 Simon et al. (2004), and C59N Simon et al. (2006). Peapods with magnetic fullerenes can be used to study the electronic properties of the tubes Simon et al. (2006) and may be suitable for quantum information processing Harneit (2002); Harneit et al. (2002) and they are thought to be good candidates for magnetic force microscopy cantilevers. The endohedral N@C60 fullerene is itself a unique molecule as it contains an atomic nitrogen in the electron spin S=3/2 configuration Almeida Murphy et al. (1996). The atomic nitrogen weakly interacts with its environment resulting in long electron spin-lattice relaxation times, s Knorr et al. (2000). However, the N@C60 molecule is very sensitive to temperature and annealing to 500 K was reported to irreversibly destroy it through the escape of the nitrogen Waiblinger et al. (2001). This fact motivated us to study the temperature stability of N@C60 when it is encapsulated inside SWCNTs. The modification to the electronic state of the molecule upon encapsulation is also of interest as it can yield information about the fullerene-tube interaction and about the electronic structure of the tubes themselves.
Here, we report on high temperature electron-spin resonance (ESR) spectroscopy on the encapsulated N@C60. We find that the molecule decays much slower than its pristine counterpart in the crystalline form, which indicates that the presence of the nanotubes stabilize the molecule. of N@C60 in the peapod form is significantly shorter than in the crystalline form due to the interaction with the conduction electrons on the nanotubes.
II Experimental
We prepared peapods from commercial purified SWCNTs (Nanocarblab, Moscow, Russia, purity 50 wt%) and N@C60:C60 fullerenes with an N@C60 concentration of 400 ppm. The endohedral fullerene was produced by the N implantation method Almeida Murphy et al. (1996) followed by high performance liquid chromatography, which purifies and concentrates the material. A suspension of SWCNT in toluene containing dissolved N@C60:C60 was sonicated for 2 hours, filtered with a 0.4 micron pore size filter and dried at room temperature to obtain samples in the form of bucky-papers. Raman, electron-energy loss spectroscopies, and X-ray diffraction studies indicate that sizable filling can be obtained with this route Simon et al. (2004). After degassing at room temperature, the bucky-paper samples were ground to enable penetration of the exciting microwaves and to avoid microwave losses. In the following, we refer to the starting N@C60:C60 as ”crystalline” and to the encapsulated material as ”peapod”. Both kinds of samples were sealed in quartz tubes under He atmosphere. Experiments were carried out using a Bruker Elexsys E500 spectrometer with a TE011 microwave cavity equipped with gas-flow inserts for the low (5-300 K) and high (300-620 K) temperature measurements. The ESR signal intensity, which is proportional to the number of spins observed, was determined by fitting Lorentzian curves to the data.
III Results and Discussion
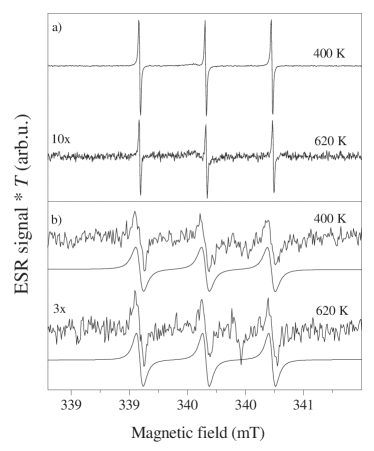
The ESR spectra of the crystalline and peapod N@C60:C60 materials are shown for different temperatures in Fig. 1. A triplet signal, which is characteristic for the hyperfine interaction of the N spins with the 14N nucleus with nuclear spin is observed for both kinds of samples. The three unpaired electrons on the 2p3 nitrogen atomic orbitals are in a high spin, S=3/2 state configuration. The zero-field splitting of the electron Zeeman levels is small due to the high symmetry of the fullerene cage and it can be observed in spin-echo ESR experiments only Weiden et al. (1999). The isotropic nuclear hyperfine coupling, mT of N@C60 is uniquely large due to the compression of the nitrogen orbitals, which unambiguously identifies the observation of this molecule Almeida Murphy et al. (1996).
Besides the triplet, the peapod spectra contains a broad background (not shown) due to the inevitable presence of ferromagnetic Ni:Y catalysts in the SWCNT samples. However, the peapod spectrum does not contain any impurity line around as observed in the early studies Simon et al. (2004), which attests the high SWCNT sample purity. The ESR signal intensity observed for the peapod sample was compared to that in the crystalline sample, which enables to determine the amount of N@C60 in the peapods. We found that fullerene content in the peapod is 2–3 weight-percent, in agreement with the previous studies Simon et al. (2004, 2005).
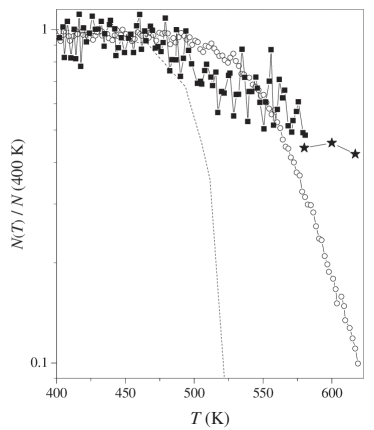
The number of N@C60 spins, , is proportional to the product of the ESR signal intensity and the temperature as the magnetic susceptibility of the N@C60 spins follows a Curie temperature dependence. Since we are interested in the change of as a function of temperature, normalizing it to a well defined temperature value allows a precise monitoring of the decay of N@C60. In Fig. 2., we show the temperature dependence of the number of N@C60 spins in both kinds of samples normalized to the value at 400 K. For comparison, we show the corresponding data from Ref. Waiblinger et al. (2001). The annealing speed was 90 s/2 K, that is identical to the heating protocol used in Ref. Waiblinger et al. (2001). At 580, 600, and 620 K, we performed longer data acquisition thus less temperature points were taken to maintain the annealing protocol. We observe a clear drop in the number of N@C60 for the crystalline material when heated above 550 K. However, we observe that the decay is less sharp and that it occurs at about 50 K higher temperature than that observed previously Waiblinger et al. (2001). We have no clear explanation for this difference between ours and the previous studies. We carefully checked our thermometry and we used a large flux of exchange gas. In addition, ex-situ annealing, i.e. heating both samples outside the ESR cavity in a furnace while approximately following the above annealing protocol, gave identical decay curves as the in-situ result.
The important observation is that the number of N@C60 does not decay in the peapod sample as fast as in the crystalline material. We observe about relatively three times as much N@C60 in the peapod material at 620 K than in the crystalline material. This effect is also apparent in Fig. 1. where the corresponding spectra are shown. Although the noise in the peapod data limits the conclusions, the decay of N@C60 appears to start already at 500 K but there is no sharp decay such as that observed for the crystalline material. The amount of N@C60 decreases rather smoothly with increasing temperature, however we could not follow this above 620 K due to technical limitations.
In the following, we discuss the origin of the enhanced thermal stability of N@C60 inside nanotubes. It was proposed in Ref. Waiblinger et al. (2001) that the atomic nitrogen escapes from the fullerene cage by forming bonds with two neighboring carbon atoms from the inside and by swinging through the bonds to the outside of the fullerene. This was supported by the observation of enhanced stability of the encaged nitrogen when the fullerene was functionalized, which effectively suppresses the probability of this escape path. Ab-initio electronic structure calculations on the peapods indicate a hybridization of the orbitals on the fullerenes and the nanotubes Dubay and Kresse (2004). Raman spectroscopy on the peapods provided experimental evidence for hybridization and a partial charge transfer between the nanotubes and the fullerenes Pichler et al. (2001). We suggest that these effects suppress the inside-the-cage bond formation for the peapod N@C60 similar to functionalization of the molecules.
In addition to the modified electronic structure of fullerenes, the peapod geometry may also play a role in the enhanced thermal stability of N@C60. The one-dimensional lattice constant of fullerenes inside the tubes is 0.97 nm Hirahara et al. (2001) that is about half-way between the 1.002 nm fullerene-fullerene spacing in crystalline C60 Heiney et al. (1991) and 0.961 nm for polymerized fcc C60 Iwasa et al. (1994). The eight voids between the fullerenes and the host nanotube wall are significantly smaller than the so-called octahedral and tetrahedral voids in crystalline C60. This, combined with the hindered rotation of the fullerenes Simon et al. (2006), probably limits the above described escape process of nitrogen simply by geometrically limiting the available room for the above described swinging-out process. For both mechanisms, the Gaussian distribution of tube diameters with an average of 1.4 nm and 0.1 nm variance explains why the thermally induced decay of N@C60 is spread out in temperature: we expect that both the electronic modification of the fullerenes through the fullerene-nanotube interaction and also the geometrical effect are strongly influenced by the diameter of the host tubes.
In general, the spin-lattice relaxation time of a paramagnetic spin can be used to study the electronic structure of its environment. Well known example of this is the Korringa-relaxation, i.e. const. of nuclear spins when these are embedded in metals Slichter (1989). In our case, the of encapsulated N@C60 can be studied using saturated ESR measurement Portis (1953). In this method, the ESR signal intensity is progressively saturated upon increasing microwave power and the ESR signal intensity follows Portis (1953); Slichter (1989):
| (1) |
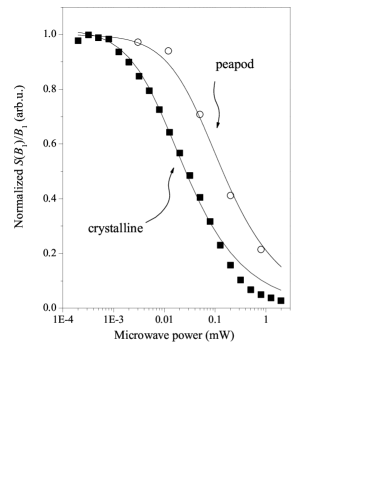
where is the electron gyromagnetic ratio, is the microwave power, is the spin-spin relaxation time of the individual spin-packets, is a constant which depends on the microwave cavity mode with quality factor Q and describes how large microwave magnetic field, , is produced for a power of . Taking into account that only one of the two circularly polarized magnetic field components of the linearly polarized field is ESR active we obtain for the TE011 cavity Poole (1983). In Fig. 3. we show the saturated ESR results for the crystalline and the peapod material at 300 K.
| [s] | [s] | |||
|---|---|---|---|---|
| crystalline Harneit (2002) | 120 | 5 | ||
| peapod | 13 | 13 |
Clearly, the ESR signal of the peapod material saturates at larger microwave powers, which indicates a shorter relaxation time. To obtain values from the saturation curves using Eq. 1, the value for has to be known. is the spin-spin relaxation time of individual spin-packets that is given by the dipolar interaction of like-spins provided is long enough and does not give a homogeneous broadening Abragam (1961). If this is the case, can be determined from the dipolar interaction strength of the like-spins and is inversely proportional to their concentration. is obtained for the 400 ppm N@C60:C60 crystalline material from the for a 100 ppm N@C60:C60 sample Harneit (2002). As shown in Table 1., is much longer for the crystalline material so no homogeneous broadening of the spin-packets occurs. This situation is reversed for the peapod material: the low concentration of the like nitrogen spins would give a long based on the % fullerene weight percentage in the peapod. However, is shorter than that value, which gives a homogeneous broadening of the individual spin-packets and sets . As we show below, this holds down to the lowest temperatures. It is interesting to note here, that a similar situation was encountered for another diluted magnetic fullerene peapod system, the C59N:C60, where the rapid relaxation causes a homogeneous broadening Simon et al. (2006).
We show the simulated saturation curves in Fig. 3. with the parameters given in Table 1. The excellent agreement for the measured and calculated saturation curves for the crystalline material shows that the saturated ESR measurement can be used to determine values for and , although it lacks the direct access to these values such as the spin-echo ESR method. It thus justifies the use of the saturated ESR method to determine the and values for the peapod system as well.
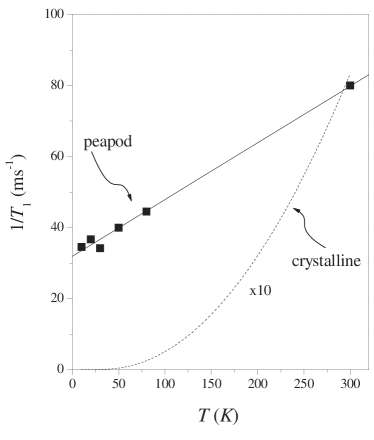
We determined the temperature dependence of from the saturated ESR measurements in the 10-80 K temperature range in addition to the 300 K data. Measurements at other temperatures were hindered by spectrometer stability. We show the data in Fig. 4. for the peapod material. We also show the same data for the crystalline material from Ref. Knorr et al. (2000). The spin-lattice relaxation rate is roughly one order of magnitude larger for the peapod material than for the crystalline at room temperature. It is even larger at 10 K for the peapod than the corresponding value for the crystalline material. The temperature dependence of is also different for the two kinds of compounds: for the peapod it decreases with temperature to a residual value, whereas it vanishes exponentially for the crystalline material Knorr et al. (2000). It was proposed in Ref. Knorr et al. (2000) that in crystalline N@C60 is given by the quantum oscillator motion of the encaged nitrogen through the modulation of the hyperfine field, which results in the exponential freezing-out of the relaxation rate.
The enhanced relaxation rate in the peapod material is given by additional relaxation mechanisms. We expect that the hyperfine relaxation is not significantly different in the peapod material as the isotropic hyperfine coupling is unchanged. In addition, the altered rotational dynamics of the molecule inside the tubes cannot have a significant effect on the hyperfine relaxation, contrary to that was concluded previously Corzilius et al. (2005). Possible mechanisms for the relaxation are coupling to conduction electrons on the tubes and paramagnetic relaxation from defects on the tubes and from the transition metal catalyst particles, which are inevitably present in the nanotube samples. The latter relaxation mechanism could explain the presence of the residual relaxation rate as it is inversely proportional to the temperature Abragam (1961). This contribution is expected to be negligible at room temperature, therefore the factor 10 enhancement of the room temperature relaxation rate for the peapod is suggested to originate from the coupling of the nitrogen spins to the conduction electrons on the tubes, i.e. from a Korringa relaxation. It is important to note here, that we do not observe a multi-component saturation, i.e. there seems to be a single time for the encapsulated N@C60.
An approximate value for the Korringa-relaxation related relaxation rate is obtained from the 90 % of the room temperature value, that gives . The theory of Korringa relaxation can be used to obtain the meV coupling constant between the localized spins and the conduction electrons Slichter (1989):
| (2) |
where is the DOS at the Fermi level for a nm metallic tube in the tight-binding approximation Dresselhaus et al. (2001). The current value of is significantly lower than the meV found for the coupling of C59N spins and the itinerant electrons on the nanotubes. This difference originates from the encaged nature of the nitrogen spins for N@C60. Nevertheless, the above mentioned uniformity of the saturation curves suggests that only one kind of nanotubes, namely metallic ones are detected using magnetic resonance, which confirms the earlier observations using NMR Singer et al. (2005) and ESR Simon et al. (2006). The fact that the spin-lattice relaxation rate of N@C60 remains finite at the lowest temperature puts a severe limit on the applicability of the NC60 peapod system for quantum information processing.
IV Conclusions
In summary, we found that the N@C60 molecule is more stable in peapod than in crystalline form. This was suggested to result from the modified electronic structure of fullerenes inside the tubes or alternatively from the compact packing of the fullerenes inside the nanotubes. The spin-lattice relaxation time of the N@C60 spins is much shorter in the peapod form due to the interaction with the electrons on the nanotubes. This indicates a finite density of states at the Fermi level of most of the nanotubes.
V Acknowledgement
The authors are grateful to A. Jánossy and A. Rockenbauer for stimulating discussions. We thank K.-P. Dinse for providing the endohedral fullerenes. We acknowledge support by the Hungarian State Grants (OTKA) No. TS049881, F61733, NK60984, and T046953. FS acknowledges the Zoltán Magyary and the Bolyai fellowships for support. The work in Lausanne was supported by the Swiss National Science Foundation and by the European research network IMPRESS.
∗ Corresponding author: ferenc.simon@univie.ac.at
References
- Iijima and Ichihashi (1993) S. Iijima and T. Ichihashi, Nature 363, 603 (1993).
- Bethune et al. (1993) D. S. Bethune, C. H. Kiang, M. S. DeVries, G. Gorman, S. R., and R. Beyers, Nature 363, 605 (1993).
- Smith et al. (1998) B. W. Smith, M. Monthioux, and D. E. Luzzi, Nature 396, 323 (1998).
- Berber et al. (2002) S. Berber, Y.-K. Kwon, and D. Tománek, Phys. Rev. Lett. 88, 185502 (2002).
- Melle-Franco et al. (2003) M. Melle-Franco, H. Kuzmany, and F. Zerbetto, J. Phys. Chem. B 109, 6986 (2003).
- Rochefort (2003) A. Rochefort, Appl. Magn. Reson. 67, 115401 1 7 (2003).
- Otani et al. (2003) M. Otani, S. Okada, and A. Oshiyama, Phys. Rev. B 68, 125424 (2003).
- Dubay and Kresse (2004) O. Dubay and G. Kresse, Phys. Rev. B 70, 165424 (2004).
- Pichler et al. (2001) T. Pichler, H. Kuzmany, H. Kataura, and Y. Achiba, Phys. Rev. Lett. 87, 267401 (2001).
- Pfeiffer et al. (2004) R. Pfeiffer, H. Kuzmany, T. Pichler, H. Kataura, Y. Achiba, M. Melle-Franco, and F. Zerbetto, Phys. Rev. B 69, 035404 (2004).
- Bandow et al. (2001) S. Bandow, M. Takizawa, K. Hirahara, M. Yudasaka, and S. Iijima, Chem. Phys. Lett. 337, 48 (2001).
- Pfeiffer et al. (2003) R. Pfeiffer, H. Kuzmany, C. Kramberger, C. Schaman, T. Pichler, H. Kataura, Y. Achiba, J. Kürti, and V. Zólyomi, Phys. Rev. Lett. 90, 225501 (2003).
- Simon et al. (2005) F. Simon, C. Kramberger, R. Pfeiffer, H. Kuzmany, V. Zólyomi, J. Kürti, P. M. Singer, and H. Alloul, Phys. Rev. Lett. 95, 017401 (2005).
- Shimada et al. (2002) T. Shimada, T. Okazaki, R. Taniguchi, T. Sugai, H. Shinohara, K. Suenaga, Y. Ohno, S. Mizuno, S. Kishimoto, and T. Mizutani, Appl. Phys. Lett. 81, 4067 (2002).
- Lyashenko et al. (2005) D. A. Lyashenko, A. N. Obraztsov, F. Simon, H. Kuzmany, E. D. Obraztsova, Y. P. Svirko, and K. Jefimovs, AIP Conf. Proc. 786, 301 (2005).
- Simon et al. (2004) F. Simon, H. Kuzmany, H. Rauf, T. Pichler, J. Bernardi, H. Peterlik, L. Korecz, F. Fülöp, and A. Jánossy, Chem. Phys. Lett. 383, 362 (2004).
- Simon et al. (2006) F. Simon, H. Kuzmany, B. Náfrádi, T. Fehér, L. Forró, F. Fülöp, A. Jánossy, A. Rockenbauer, L. Korecz, F. Hauke, et al., Phys. Rev. Lett. 97, 136801 (2006).
- Harneit (2002) W. Harneit, Phys. Rev. A 65, 032322 (2002).
- Harneit et al. (2002) W. Harneit, C. Meyer, A. Weidinger, D. Suter, and J. Twamley, Phys. St. Solidi B 233, 453 (2002).
- Almeida Murphy et al. (1996) T. Almeida Murphy, T. Pawlik, A. Weidinger, M. H hne, R. Alcala, and J.-M. Spaeth, Phys. Rev. Lett. 77, 1075 (1996).
- Knorr et al. (2000) S. Knorr, A. Grupp, M. Mehring, M. Waiblinger, and A. Weidinger, AIP Conf. Proc. 544, 191 (2000).
- Waiblinger et al. (2001) M. Waiblinger, K. Lips, W. Harneit, A. Weidinger, E. Dietel, and A. Hirsch, Phys. Rev. B 64, 159901 (2001).
- Weiden et al. (1999) N. Weiden, H. Käß, and K. P. Dinse, J. Phys. Chem. B 103, 9826 (1999).
- Hirahara et al. (2001) K. Hirahara, K. Bandow, S. Suenaga, H. Kato, T. Okazaki, T. Shinohara, and S. Iijima, Phys. Rev. B 64, 115420 (2001).
- Heiney et al. (1991) P. A. Heiney, J. E. Fischer, A. R. McGhie, W. Romanow, A. M. Denenstein, J. McCauley, and A. C. D. Smith, Phys. Rev. Lett. 66, 2911 (1991).
- Iwasa et al. (1994) Y. Iwasa, T. Arima, R. M. Fleming, T. Siegrist, O. Zhou, R. C. Haddon, L. J. Rothberg, K. B. Lyons, H. L. Carter, A. F. Hebard, et al., Science 264, 1570 (1994).
- Slichter (1989) C. P. Slichter, Principles of Magnetic Resonance (Spinger-Verlag, New York, 1989), 3rd ed.
- Portis (1953) A. M. Portis, Phys. Rev. 91, 1071 (1953).
- Poole (1983) C. P. Poole, Electron Spin Resonance (John Wiley & Sons, New York, 1983), 1983rd ed.
- Abragam (1961) A. Abragam, Principles of Nuclear Magnetism (Oxford University Press, Oxford, England, 1961).
- Corzilius et al. (2005) B. Corzilius, A. Gembus, K.-P. Dinse, F. Simon, and H. Kuzmany, AIP Conf. Proc. 786, 291 (2005).
- Dresselhaus et al. (2001) M. S. Dresselhaus, G. Dresselhaus, and P. Avouris, Carbon Nanotubes: Synthesis, Structure, Properties, and Applications (Springer, Berlin, Heidelberg, New York, 2001).
- Singer et al. (2005) P. M. Singer, P. Wzietek, H. Alloul, F. Simon, and H. Kuzmany, Phys. Rev. Lett. 95, 236403 (2005).