X-rays from Magnetically Channeled Winds of OB Stars
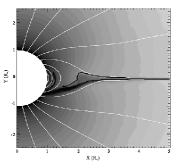
OB stars with strong radiation-driven stellar winds and large-scale magnetic fields generate strong and hard X-ray emission via the Magnetically Channeled Wind Shock (MCWS) mechanism ([Shore & Brown (1990), Babel & Montmerle (1997), ud-Doula & Owocki (2002), Shore & Brown 1990; Babel & Montmerle 1997; ud-Doula & Owocki 2002]). There are four separate X-ray diagnostics that confirm the MCWS scenario for the young, magnetized O star that illuminates the Orion Nebula, , and constrain the physical properties of its X-ray emitting magnetosphere:
- 1.
-
High X-ray temperatures, determined from thermal spectral model fitting. The differential emission measure of peaks at temperatures above 10 MK, which is in contrast to the few million K peak temperatures in mature, unmagnetized O stars ([Wojdowski & Schulz (2005), Wojdowski & Schulz 2005]), and which is well reproduced by MHD simulations of the MCWS mechanism ([Gagné et al.(2005), Gagné et al. 2005]).
- 2.
-
Relatively narrow X-ray emission lines. The X-ray emitting plasma in the MCWS scenario is predominantly in the closed magnetic field regions and thus the plasma velocity is relatively low and the associated Doppler line broadening is modest. This is seen in the MHD simulations and confirmed by the Chandra grating observations.
- 3.
-
The rotational modulation of the X-ray emission is consistent with part of the magnetosphere being eclipsed near phase 0.5, when the viewing orientation is magnetic equator-on. The depth of the eclipse provides information about the location of the X-ray emitting plasma (deeper eclipses imply more plasma close to the star). The observed eclipse depth for implies that the bulk of the plasma is within a stellar radius of the photosphere. This is a somewhat closer than the MHD simulations predict (e.g. [Gagné et al.(2005), Gagné et al. 2005]).
- 4.
-
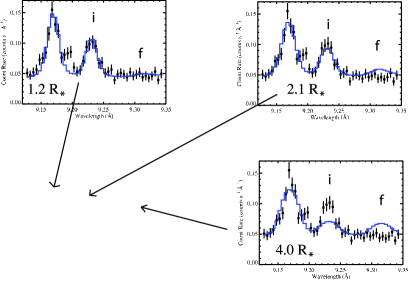
The ratio of the forbidden to intercombination line strengths in helium-like ions also puts a constraint on the location of the X-ray emitting plasma, via the sensitivity of these line ratios to the local UV mean intensity. The closer the hot plasma is to the photosphere, the stronger the UV photoexcitation of electrons from the upper level of the forbidden line to the upper level of the intercombination line, and the smaller the ratio. This is demonstrated in Fig. 1 for the Mg xi complex in the co-added (over four observations) Chandra grating spectrum of , where we see that the very weak forbidden line requires a plasma location below .
References
- [Babel & Montmerle (1997)] Babel, J. & Montmerle, T. 1997, ApJ (Letters), 485, L29
- [Gagné et al.(2005)] Gagné, M., Oksala, M., Cohen, D.H., Tonnesen, S.K., ud-Doula, A., Owocki, S.P., Townsend, R.H.D., & MacFarlane, J.J. 2005, ApJ, 628, 986
- [Shore & Brown (1990)] Shore, S.N. & Brown, D.N. 1990, ApJ, 365, 665
- [ud-Doula & Owocki (2002)] ud-Doula, A. & Owocki, S.P. 2002, ApJ, 576, 413
- [Wojdowski & Schulz (2005)] Wojdowski, P. & Schulz, N.S. 2005, ApJ, 627, 953