Silicates in Ultra-Luminous Infrared Galaxies
Abstract
We analyze the mid-infrared (MIR) spectra of ultraluminous infrared galaxies (ULIRGs) observed with the Spitzer Space Telescope’s Infrared Spectrograph. Dust emission dominates the MIR spectra of ULIRGs, and the reprocessed radiation that emerges is independent of the underlying heating spectrum. Instead, the resulting emission depends sensitively on the geometric distribution of the dust, which we diagnose with comparisons of numerical simulations of radiative transfer. Quantifying the silicate emission and absorption features that appear near 10 and 18m requires a reliable determination of the continuum, and we demonstrate that including a measurement of the continuum at intermediate wavelength (between the features) produces accurate results at all optical depths. With high-quality spectra, we successfully use the silicate features to constrain the dust chemistry. The observations of the ULIRGs and local sightlines require dust that has a relatively high 18/10m absorption ratio of the silicate features (around 0.5). Specifically, the cold dust of Ossenkopf et al. (1992) is consistent with the observations, while other dust models are not. We use the silicate feature strengths to identify two families of ULIRGs, in which the dust distributions are fundamentally different. Optical spectral classifications are related to these families. In ULIRGs that harbor an active galactic nucleus, the spectrally broad lines are detected only when the nuclear surroundings are clumpy. In contrast, the sources of lower ionization optical spectra are deeply embedded in smooth distributions of optically thick dust.
1 Introduction
High infrared luminosity () characterizes ultraluminous infrared galaxies (ULIRGs). The underlying energy source may be accretion onto a supermassive black hole in an active galactic nucleus (AGN), intense bursts of star formation, or a combination of the two (Sanders et al., 1988a; Genzel et al., 1998). Because the total luminosities are large, ULIRGs are critical sites to consider in obtaining a complete account of star formation, black hole growth, and the relationship between these two phenomena over cosmic time. In all cases, dust is responsible for reprocessing the intrinsic hard radiation to emerge at longer wavelengths. This dust reprocessing erases the spectral signatures that would reveal the nature of the original source, but the resulting spectra serve as probes of the dust itself.
While most of the dust emission is continuum radiation, in the mid-infrared (MIR), two of its spectral features are observable, arising near 10 and 18m. These are attributed to silicates, especially amorphous analogs of pyroxenes and olivines (Draine, 2003a, and references therein). Both features have been measured in stellar observations for decades (Gillett, Low, & Stein, 1968; Woolf & Ney, 1969; Low & Krishna Swamy, 1970). Observations of the stronger 10m absorption feature in starburst galaxies and AGNs have a similarly long history (e.g., Gillett et al., 1975; Rieke & Low, 1975a, b; Kleinmann, Gillett, & Wright, 1976), but only recently has the high sensitivity of instruments in space made measurement of the 18m feature in large numbers of galaxies feasible.
Detecting silicate features in emission can identify the dusty medium as optically thin, and deep absorption characterizes optically thick obscuration. In detail, however, quantifying the optical depth requires a complete radiative transfer calculation because the same material produces both the continuum and line features. Thus, the apparent optical depth that silicate absorption strength yields is not the true optical depth along the line of sight, although it is frequently treated as such a direct measurement (e.g., Shi et al., 2006; Gallais et al., 2004; Maiolino et al., 2001). Compared with complete calculations, however, high signal-to-noise spectra of both of these features together effectively reveal the geometric distribution of the dust, including the total line-of-sight optical depth. Moreover, while the continuum emission depends only weakly on the dust chemistry, comparison of the two silicate features provides one of the few accessible diagnostics of the dust composition.
Infrared studies that aim to deduce the nature of sources and surrounding dust geometry suffer from the degeneracy of the problem: a large range of different configurations produces very similar overall spectral energy distributions. Reaching conclusions about geometry, let alone dust chemistry, based on the spectral shape is difficult if not impossible (e.g. Vinković et al., 2003). However, extremely deep 10m silicate absorption proves to be a good discriminant of clumpy and smooth dust distributions, as we show in Levenson et al. (2007). Here we extend this analysis to include both the 10 and 18m silicate features. We apply detailed models to MIR spectral measurements of ULIRGs to probe the dust chemistry and geometric distribution of material around the galaxies’ powerful nuclear sources. While the MIR spectra of ULIRGs have been studied previously (e.g., Armus et al., 2004, 2006, 2007; Desai et al., 2007; Farrah et al., 2007; Marshall et al., 2007; Spoon et al., 2004; Spoon et al., 2006), here we investigate both silicate features in detail.
We consider the ULIRGs contained in the samples of Spoon et al. (2007) and Imanishi et al. (2007), which were all observed using the Infrared Spectrograph (IRS; Houck et al. 2004) on board the Spitzer Space Telescope (Werner et al., 2004). All the observations were obtained in low-resolution mode, which provides spectral resolution and complete coverage from 5–35m. The slits are up to 3.7 and 10.7″ wide in the short- and long-wavelength modules, respectively. Although these slits cover large areas of the galaxies (which have redshifts up to 0.93), the concentrated emission dominates the flux of the nuclear spectra we discuss. See Spoon et al. (2007) for additional information about the data reduction.
2 Modeling Dust Reprocessing
Dust reprocesses the heating spectrum, and the reprocessed radiation emerges at IR wavelengths. In contrast to standard extinction along the line of sight, whereby dust modifies the underlying spectrum of the source to produce the transmitted spectrum, this reprocessed dust emission fundamentally erases the spectral signature of the heating source. The emitting dust need not be located along the line of sight to the source. In the absence of other obscuration, both the intrinsic source and the reprocessed dust emission may then be detected, as is the case, for example, in type 1 AGNs. However, because the stellar and AGN engines of ULIRGs are intrinsically weak in the IR regime, in all cases the reprocessed dust emission dominates the resulting IR spectrum.
We calculate the radiative transfer through the dusty medium using the one-dimensional code DUSTY (Ivezić, Nenkova, & Elitzur, 1999). The emergent spectrum depends on the dust composition, the geometric distribution of the dust, and the initial heating spectrum. We adopt the grain size distribution of Mathis, Rumpl, & Nordsieck (1977). Variations of the grain sizes affect only NIR and shorter wavelength emission and do not alter silicate emission or absorption at 10 and 18m, as long as the grains sizes do not exceed about 1m. The grain composition is 53% silicate and 47% graphite. We consider the optical properties of three different models of dust chemistry: from Ossenkopf, Henning, & Mathis (1992), cool, oxygen-rich silicates that may be typical of the diffuse interstellar medium (“OHMc”) and warm, oxygen-deficient silicates that may be typical of circumstellar regions (“OHMw”), and “astronomical silicate” from Draine (2003b, c, “Draine”). In all cases, we use the graphite optical properties of Draine (2003b, c). We explore further variations in composition below. We do not include any polycyclic aromatic hydrocarbons (PAHs) in the numerical models, and we restrict our detailed analysis below to sources that exhibit weak PAH emission, in which the silicate and graphite grain emission dominates the MIR spectra.
We examine three geometries of the dusty material: a normally-illuminated slab, a smooth spherical shell, and a clumpy spherical shell. The spherical symmetry of the smooth and clumpy distributions minimizes the number of model variables. We use the formalism of Nenkova et al. (2002) to calculate the clumpy models. The maximum dust temperature is 1500K, at which dust sublimates. The inner surface of the slab, shell, or innermost clouds is located at the distance, , corresponding to this temperature. This distance at which the dust sublimation temperature is reached depends on the luminosity of the central source and its spectral shape. For an incident AGN spectral shape, for the typical grains, where is the bolometric luminosity in units of . For all three geometries, we consider a range of total optical depths to the source, where is the optical depth at 0.55m. The slab is geometrically thin, whereas the radial density distribution and the total extent of the dust can vary in the spherical models. In the continuous shell, we consider dust density profiles proportional to , where , 1, or 2, and the shell thickness, , ranges from 1.25 to 1000. The clumpy distribution similarly contains clouds whose number is proportional to , located between and some maximum thickness, typically . The individual clouds are optically thick, each with ranging from 10 to 80. The number of clouds along radial rays is distributed stochastically according to Poisson statistics around a prescribed mean value, which we designate the mean number of clouds, . In our computations, . Thus, the average total optical depth along radial rays, , ranges from 10 to 800 through these clumpy distributions.
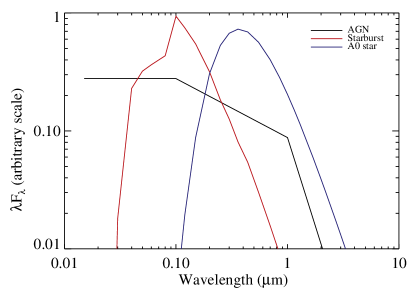
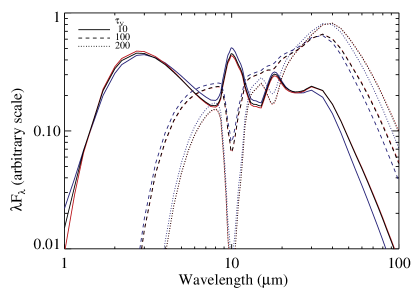
Ivezić & Elitzur (1997) show that for large optical depth, the resulting IR radiation is largely independent of the nature of the heating radiation. We consider three incident spectral energy distributions (SEDs): an AGN, a starburst, and a stellar blackbody (Figure 1, left panel). The AGN spectrum is a broken power law described by Rowan-Robinson (1995) and Nenkova et al. (2002). We use Starburst99 (Leitherer et al., 1999; Vázquez & Leitherer, 2005) to calculate the SED of a 1-Myr-old instantaneous burst with solar metallicity and a Salpeter initial mass function. The right panel of Figure 1 shows the results of the model calculation for smooth spherical shells of OHMc dust with with profile , shell thickness , and various values of . (We adopt these particular parameters because the resulting SEDs vary dramatically as a function of optical depth.) As is evident from the figure, there is no hint of the input SED in the dust emission. The total optical depth of the dusty material rather than the particular incident spectrum determines the emergent spectrum, even using the relatively cool A0 star, provided the dust is close enough to be heated to 1500K. In the subsequent calculations, we adopt the AGN incident spectrum; a luminous stellar population would yield equivalent results.
The same calculations underlie the models of continuous spherical shells we present here and those of Ivezić & Elitzur (1997). Thus, their results that do not depend in detail on the dust chemistry, such as radial variations of temperature, are representative. The comparison with their work demonstrates explicitly the applicability of the computations and results we present here to individual dust-embedded stars. Although the disks and outflows of young stellar objects can introduce asymmetry, the resulting SEDs remain similar (see Whitney et al. 2003 or Vinković et al. 2003, for example).
3 Silicate Continuum and Feature Measurements
3.1 Continuum Fitting
The silicate features appear characteristically different in the nuclear spectra of various classes of galaxies. Emission is typical of optically-identified quasars, and deep absorption is typical of ULIRGs (Hao et al., 2007). To quantify these silicate properties, both in observations and simulations, the strength of the emission or absorption must be measured relative to the underlying continuum. A complication in the MIR is that dust is responsible for both the observed “continuum” and the spectral features; they do not have independent origins.
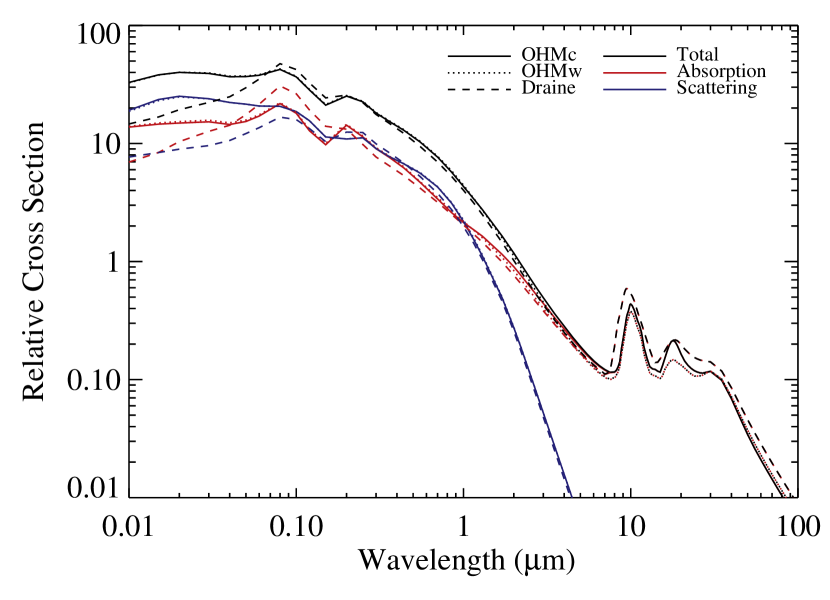
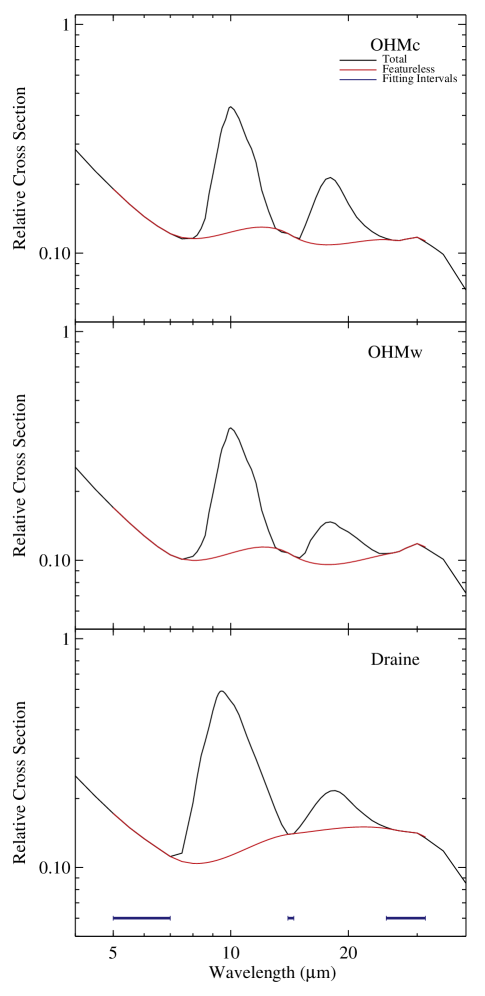
Figure 2 shows the total cross sections of the three dust models. Ossenkopf et al. (1992) tabulate cross sections only down to 0.4m, and we use DUSTY to extrapolate their results to shorter wavelengths employing the Mie theory111The published tabulation lists 63 wavelengths between 0.4 and m. We use 198 entries on a finer grid over the same spectral range kindly provided by T. Henning (1999, private communication).. Scattering is important at shorter wavelengths, but in the MIR, absorption dominates. The three cross sections are very similar from 0.1 to 5m, but they differ significantly in the silicate features. For all dust chemistries, two features stand out as local maxima in the cross section near 10 and 18m. Figure 3 shows the total (absorption and scattering) cross section of this region for the three dust models. The peaks are not single-wavelength excitation but broad Si-O stretching and Si-O-Si bending modes, which are ultimately responsible for the emission and absorption features observed in spectra. While all three models are empirical descriptions of observed spectra, the profile and central wavelength of each of these features and their relative strength depend physically on the mineral composition of the dust. These are evidently different in the three different dust models, with the 18m feature relatively stronger in the OHMc dust.
In the familiar setting, atomic or molecular lines are superposed on a continuum, and different physical processes are responsible for the line and the continuum emission. As a result, increasing the optical depth of lines leads to broadening and possible blending, while the continuum remains fixed. The properties of these lines, such as central wavelength and spectral width, are well-defined, and they are independent of any continuum. In contrast, in the case of grain emission, the same mechanism produces both the features and the underlying continuum. The features that are evident in spectra are a consequence of variations of the dust cross section, but they are not independent entities. In order to define measurable features, we introduce synthetic “featureless dust,” which we obtain from the interpolation of the smooth variation of the actual cross section. We define the features as the excess above this “continuum.” Figure 3 shows these results for the three dust chemistries. In each case, the featureless dust, plotted in red, is a cubic spline interpolation of the total cross section in logarithmic space over three intervals: 5–7, 14–14.5, and 25–31.5m (shown in blue). We still measure the continuum well at wavelengths longer than 31.5m, but we adopt this cutoff to develop a consistent method that we can apply to the spectra obtained with the IRS.
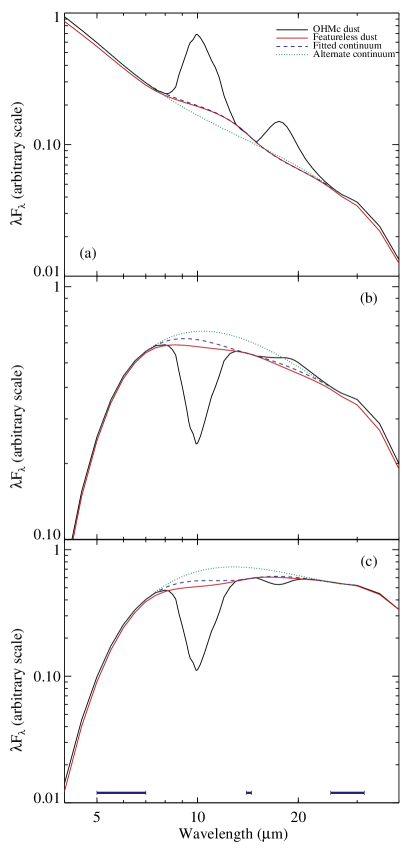
Figure 4 shows the result of radiative transfer calculations for three representative optical depths: , 100, and 400. At small optical depth, both features appear in emission, and at large optical depth, both are in absorption. In the intermediate case, the 10m feature is in absorption while the 18m is in emission. In each panel, the red line shows the result of the radiative transfer calculation for the exact same geometric configuration, but using the featureless dust. In order to quantify the strengths of the silicate features in spectra, we employ the same technique to fit the underlying continuum: cubic spline interpolation over the same three intervals shown in blue. The result is shown as the dashed blue line in each panel. In each case, this line resembles the model result for the featureless dust. In other words, performing this interpolation procedure over the cross section, to create “featureless dust,” or on the emergent spectrum, to measure the continuum, produces the same result. This outcome reflects a fundamental property of radiative transfer: it proceeds wavelength-by-wavelength. Only an indirect coupling exists across wavelengths, through heating. This accounts for the small differences between the red and dashed blue lines. The emission or absorption at each wavelength is independent of all others, so the features do not broaden to occupy a larger wavelength interval, even at large optical depths. Instead, they remain confined to their original extent.
Including the intermediate-wavelength measurement is critical to obtaining a good fit of the underlying continuum. The failure of continuum fitting that excludes the intermediate interval (green dotted line) is evident mostly at moderate and large visual optical depths. In the former, this alternate fitting technique almost entirely misses the 18m emission feature, and in the latter, it greatly exaggerates the strength of both absorption features. We quantify the strengths of the features and give further examples below (§3.2).
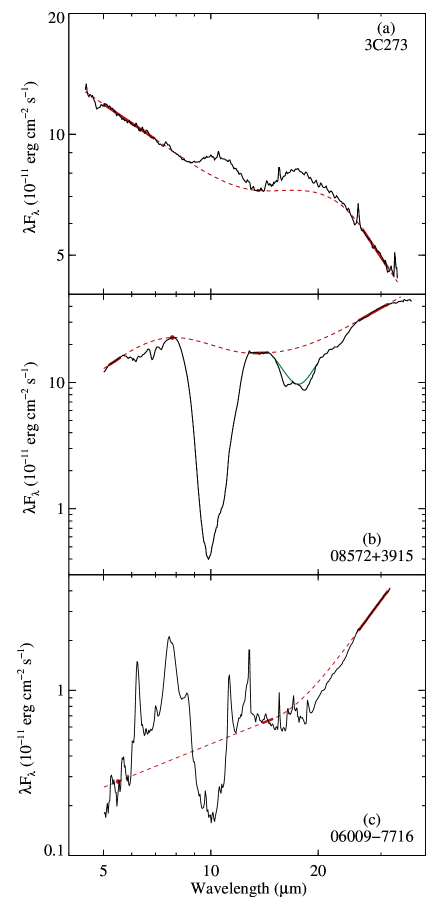
Application of this continuum-fitting method to spectra of galaxies is complicated by the presence of emission lines, absorption by hydrocarbons and ices, and emission of very small dust grains (PAHs). Therefore, in order to measure the continuum in observations of galaxies, we must exclude these emission and absorption features from the fitting intervals. The technique we developed to overcome these problems was employed by Spoon et al. (2007), who outlined its essential points; here we describe it in detail. We find three characteristic classes of spectra that require modification of the fitting intervals. Continuum-dominated spectra often exhibit high-ionization emission lines typical of AGNs, and they do not show any strong PAH emission or ice absorption. Water ice and aliphatic hydrocarbon absorption at shorter MIR wavelengths (below 8m) is strong in the absorption-dominated spectra, and PAH emission remains weak. The PAH emission is strong in the PAH-dominated spectra, with the equivalent width of the 6.2m band, , exceeding 0.1m, measured relative to the local continuum. In all cases, to eliminate noise, power law fits of the observed flux within the selected intervals, rather than the raw data, are used to fit the full continuum (Figure 5).
Continuum-dominated spectra require only minor modifications of the ideal fitting intervals. To avoid the strong [Ne V], the intermediate fitting interval becomes 13.8–14.2m. When [O IV] is strong, we increase the lower bound of the long-wavelength interval to 26.5m. We show the continuum-dominated spectrum of 3C273 and the resulting fitted continuum in Figure 5a.
Strong absorption bands due to water ice (centered at 6m), aliphatic hydrocarbons (at 6.90 and 7.25m) and gas phase C2H2 and HCN (at 13.7 and 14.0m) characterize the absorption-dominated spectra. (See Spoon et al. 2005 for more detail.) The short-wavelength interval is reduced to the 5.2–5.6m region plus a connection point at 7.8m, and the intermediate- and long-wavelength intervals become 13.2–14.5 and 26.0–31.5m, respectively. While PAH emission may be strong at 7.7m, we do not find it to contaminate the 7.8m point in these spectra. Figure 5b shows the absorption-dominated spectrum of IRAS 08572+3915 and the resulting fitted continuum.
Direct measurement of the continuum is difficult when PAH emission is strong. Most of the PAH emission is concentrated in two complexes that extend from 6–9 and 10.5–14m, with a minimum that coincides with the center of the 10m silicate band. Essentially none of the short-wavelength flux within the Spitzer bandpass of low-redshift galaxies is true continuum in these cases. We use a power law between the average of the 5.3–5.7 and 14.0–15.0m intervals with a spline fit extending through the standard long-wavelength interval to model the continuum. We consider this method for PAH-dominated spectra when and always employ it when . We show IRAS 06009-7716, with strong PAH emission, and the subsequent continuum fit in Figure 5c as an example of the method, although we exclude this and other ULIRGs that exhibit strong PAH emission from the sample below.
3.2 Feature Strengths
We define the strength of a feature as the natural logarithm of the ratio of the total emission to the underlying continuum:
| (1) |
evaluated at , where the strength is an extremum. Both OHMc and OHMw dust cross sections have local maxima at 10.0 and 18.0m, while the Draine dust has local maxima at 9.5 and 18.5m. We use the extremum of near these wavelengths to measure the 10 and 18m strengths, and , respectively. Positive values of indicate emission above the continuum, and negative values of indicate absorption. When the silicate feature is in absorption, the definition of corresponds to apparent optical depth; i.e., is negative, so , with . However, we emphasize that this calculation does not yield the actual optical depth along the line of sight. For example, in Figure 4c, at 10m the dust optical depth is , yet the apparent optical depth is only 1.6. Furthermore, the apparent and actual optical depths are not related to each other in any direct way because the strength depends on the geometric distribution and is not a single-valued function at extremely large optical depth (Levenson et al., 2007).
The wavelength at which or is evaluated, , is not fixed but is rather the wavelength of the local extreme strength. In the simulations, we find of the shorter-wavelength feature typically near the wavelength of the peak cross section, although ranging from 9.2–10.0, 9.3–10.2, and 9.0–9.8m, respectively, when the OHMc, OHMw, or Draine dust is used. The longer-wavelength feature typically peaks close to 18.0m, ranging from 16.0 to 19.5m in all simulations. The former is often described as the “9.7m” feature, with the measured center typically varying from 9.7 to 10.0m in absorption and often exceeding 10m in emission (e.g., Hao et al., 2005). In observations, we evaluate at the wavelength of the local extremum relative to the continuum between 8 and 13m, , and we measure at , the wavelength of the local extremum between 15 and 22m. Crystalline silicates can produce strong features at 17 and 20m, especially in absorption-dominated spectra. In these cases, we identify the amorphous contribution in a spline fit to the data in regions free of crystalline absorption, and we evaluate in the amorphous component alone (Spoon et al., 2006). Figure 5b shows the spectrum of IRAS 08572+3915 (in black), an example of a strong crystalline component, and the green line shows the amorphous silicate contribution we identify.
We apply these methods to the ULIRGs observed with the IRS that Spoon et al. (2007) and Imanishi et al. (2007) have presented. We restrict consideration to those galaxies that have . When is larger, continuum measurements are less certain. This selection criterion excludes a number of familiar ULIRGs, such as Arp 220 and Mrk 273. We caution that this sample selection does not allow us to draw conclusions about the nature of ULIRGs’ energy sources generally, for we reject the objects that exhibit the strongest direct evidence for dominant star formation. We also eliminate all spectra that do not have complete coverage of both the 10m and 18m features. The resulting sample (of 46) and their silicate strengths are listed in Table Silicates in Ultra-Luminous Infrared Galaxies by their IRAS identification or other common name. Within the sample, where the continuum fitting is robust, the order-to-order flux uncertainty of the spectra themselves dominate the errors in the strength measurements, which are typically less than 10%. Uncertainties of the continuum fitting are greater in the sources with strong PAH emission, which we exclude from this study, resulting in larger errors in the strength measurements.
In all cases, including the intermediate-wavelength continuum data is critical to obtaining reliable strength measurements. In quasar spectra in which both features are detected in emission, neglecting the intermediate-wavelength data in the fit suppresses the long-wavelength continuum, resulting in larger 18m strengths. In some cases, e.g., in the fits of Hao et al. (2005), even becomes much greater than . For example, in 3C273, they find and . Including the intermediate-wavelength continuum measurement reduces this ratio; we find both and .
4 Diagnostics of Dust Geometry and Chemistry
4.1 Silicate Feature Strength
Dust reprocessing of intrinsic radiation is directly responsible for the entire observed MIR spectra of ULIRGs. Thus, the spectra are sensitive to dust properties in detail, and both the total optical depth of the dusty material and its geometric distribution determine the behavior of the silicate features. Consider a dusty region having optical depth, , and consider first the case of constant temperature. The emission from such a region is , where is the Planck function of the temperature. When , . Since is proportional to the dust cross section, in this case the emergent spectrum has the same shape as the profiles shown in Figures 2 and 3. Therefore, the feature is in emission () and it has the same strength as the plotted cross sections, independent of optical depth. (For an example, see Figure 4a.) When increases and approaches unity, self-absorption sets in, and the feature strength decreases. As increases further and exceeds unity, becomes equal to : at constant temperature, self-absorption and emission exactly balance each other, producing the thermodynamic limit of the Planck function. Therefore, for all , a single-temperature region can never produce a feature, either in emission or absorption. The emergence of an absorption feature (Figures 4b and c) reflects the temperature stratification in actual dusty material: as the radiation propagates from hot regions toward the observer, it passes through cooler regions where it suffers absorption that is not balanced by the emission from these cooler regions. Thus, the temperature structure primarily determines the strength of the absorption feature at large optical depths. The 10 and 18m features display a different behavior, with the former switching from emission to absorption at a smaller total optical depth, because (Figure 4b).
Either radiative transfer effects or geometric dilution can produce temperature gradients. In the first case, the surface layer absorbs the heating radiation, and the propagation to subsequent layers degrades the photons to longer wavelengths. Radiative transfer can produce only a limited temperature difference, which is similar in all geometries. In contrast, the spatial dilution of radiation is unique to the geometrically thick dust shell around a central heating source. Indeed, Levenson et al. (2007) show that deep silicate absorption requires dust distributions that are not only optically but also geometrically thick. However, the models never show large silicate strength; although the shell may be formally geometrically thick, the dust is concentrated, with 80% located within . The slab and cloudy models are confined to the low silicate strength regime (Nenkova et al., 2002, 2007).
The cross section at either the 10 or 18m silicate feature depends on the mineral composition of the dust. (See Molster & Waters 2003 for a review.) Various silicates have different maximal wavelengths for absorption. Combinations of multiple silicates alter the breadth of the features immediately in the cross section, with consequential effects in the observed spectra. Altering the size distribution of grains affects primarily their scattering properties. Thus, the grain sizes do not strongly influence the feature strengths in the MIR, where absorption is most important.
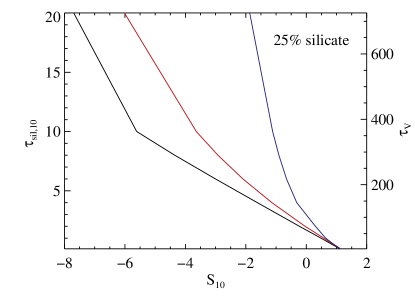
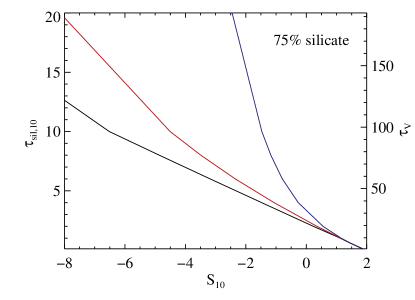
For a given mineral composition, changing the silicate abundance relative to carbon simply results in changing the scale of strength relative to the optical depth at 0.55m. Because the silicate produces both the MIR continuum and features, the absolute amount of silicate sets the feature strength. Thus, only the scaling of with is altered with a change in abundance. Figure 6 shows the scaling relations for two extreme abundance variations and demonstrates that the optical depth of silicate, not the silicate abundance, governs the feature strength. Increasing the silicate abundance does not increase the absolute feature strength, so strong features, whether in emission or absorption, are not a signature of high silicate abundance.
4.2 Feature-Feature Diagram
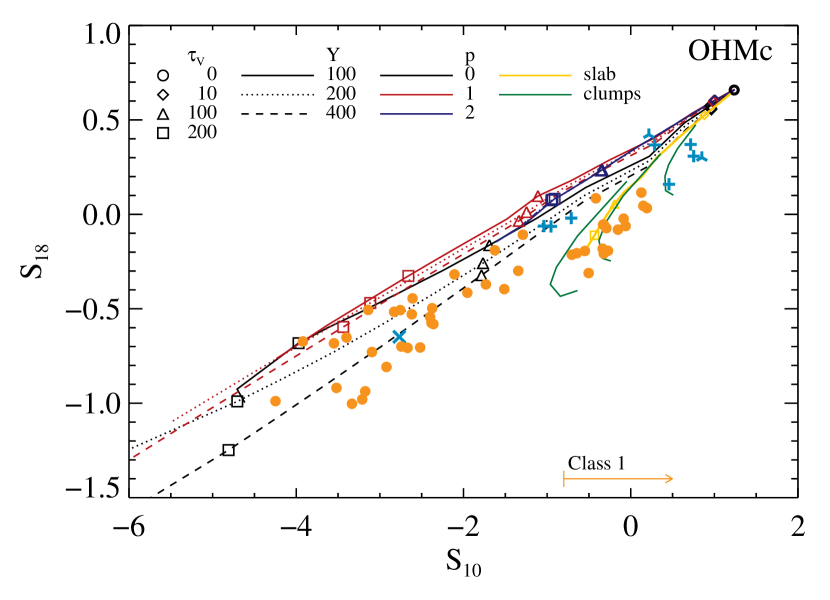
The different optical depths around 10 and 18m result in differing behavior of the two silicate features, and their appearance depends on the geometric dust configuration. In order to examine these systematic differences we introduce the “feature-feature diagram,” in which we plot . For a given dust chemistry, irrespective of the geometry, all optically thin configurations are located at the same point in the diagram, corresponding to the strengths of the two features in the dust absorption coefficient. For each dust model, the coordinates of this optically thin point are listed in Table 2, where the notation refers to the silicate strength measured in the cross section. Increasing the optical depth of a given dust geometry produces tracks that move away from this point toward deeper absorption. Figures 7 through 9 show the feature-feature diagrams for the three different dust chemistries. In each diagram, we plot the tracks for the basic geometries of slab and clumpy and smooth spherical shells. As described above, only the smooth shells ever exhibit large feature strengths. Remarkably, for each dust composition, all smooth shells exhibit nearly the same behavior, independent of the density distribution: tracks have nearly the same slope, set by the optically thin feature strengths. In other words, the optical properties of the dust set both the initial point and the slope of the tracks.
The similarity of the smooth shell tracks shows the dominant effect of chemistry, and the scatter of these trends is a consequence of the differing temperatures that arise at the surface where each observable feature is produced. In general, in the geometrically thicker shells, where the dust is spread over a larger volume, the tracks are steeper. The same optical depth produces greater strength because of the larger temperature gradient (§4.1). This effect is most evident for and smaller for , while the tracks are independent of . In this last case, the dusty material is concentrated in the inner regions, and the observed surface is at constant temperature in all shells. These tracks also stand out because they never produce large feature strengths, ending closer to the optically thin point at , the maximum plotted.
The clumpy models yield results similar to those of the slab on the feature-feature diagram. None of the clumpy configurations exhibit the extremely deep absorption of the continuous thick shells, and for a given value of , the 10m absorption is weaker compared with the smooth geometry. For clarity, we plot only the results for , 3, and 5, fixing and . As with all other distributions, these tracks originate at the optically thin point. However, as the optical depth of a single cloud, , increases, these tracks diverge away from those of the smooth shell models. The plotted clumpy results begin at , so the total optical depth on each track’s upper right is . These and all subsequent clumpy results lie in a region inaccessible to the smooth shell tracks. Along each track, increases to a maximum of 80, for total optical depth . Individual tracks extend farther to the lower left as increases, and they become more similar to the continuous shell results when is very large, i.e., as the geometric distributions become physically indistinguishable.
As optical depth increases, both and initially follow the trends of the slab, moving away from the optically thin limit. When the dust becomes optically thick in the silicates, however, the strength becomes less negative. In contrast to the slab, the clumpy obscuration offers the possibility of observing some bright, directly-illuminated cloud faces. The silicate emission from these bright faces fills in the absorption trough, reducing the depth of the absorption feature in the spectrum (Nenkova et al., 2002). These optical depth effects first become relevant to the 10m feature, producing the curvature evident in the resulting tracks. Although both the clumpy and smooth configurations can result in weak , the combination of both silicate features together breaks this degeneracy and can be used to discriminate between these two fundamentally different geometries.
5 Observations and Dust Chemistry
5.1 ULIRGs and Local Sources
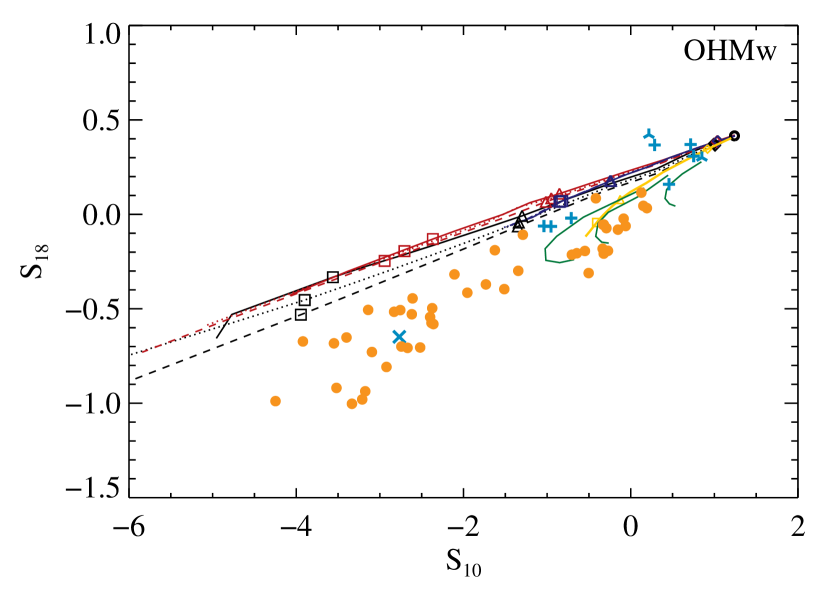
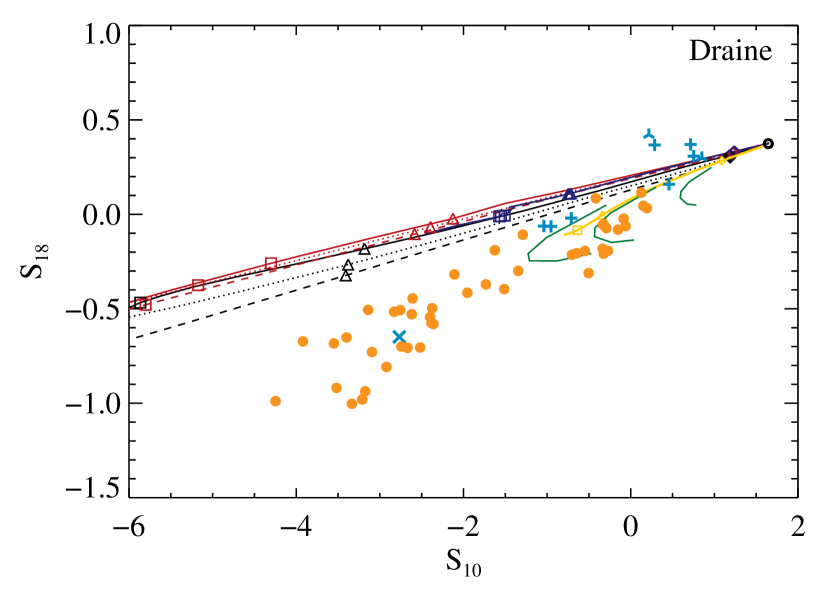
The ULIRGs we observed exhibit the same general trend of increasing with , plotted as filled symbols on Figures 7 through 9. In detail, however, the measured ratios deviate from the simulations that use either the OHMw or Draine dust, particularly at great strengths where large optical depths are required. Neither of these models can reproduce the observed ratio when . Instead, the data are consistent with the OHMc dust model, in which both and are relatively higher (Table 2).
The comparison with a number of objects in the Galaxy and Magellanic Clouds demonstrates that the ULIRGs do not have unusual dust properties. Indeed, the similarity of all sources shows that the mineralogy that the OHMc dust represents is appropriate in both Galactic and extragalactic contexts. We include MIR observations of several planetary nebulae and giant H II regions (Pottasch & Surendiranath 2005; Lebouteiller et al. 2007; Bernard-Salas et al., in preparation; Lebouteiller et al., in preparation; Whelan et al., in preparation), and the Wolf-Rayet star GCS 4 (Gibb et al., 2004) on Figures 7 through 9 (plotted as , Y , and , respectively). The last of these offers the advantages of a lack of circumstellar dust and a well-behaved intrinsic continuum, which can be modeled accurately to yield the interstellar absorption (Kemper, Vriend, & Tielens, 2004).
The local sources provide further evidence in favor of the OHMc dust. Several of the low optical depth local sources lie above all the Draine and OHMw tracks, and no geometry can accommodate such a location. The clumpy results, which are not very sensitive to chemistry, cover the region below the smooth shell tracks, but the region above these tracks is inaccessible in any given dust chemistry. Overall, only the OHMc tracks can successfully describe all the low optical depth sources with smooth or clumpy shells.
Other studies also provide evidence in favor of the OHMc dust. Roussel et al. (2006) use DUSTY to fit the IR SED of the nascent starburst galaxy NGC 1377, and their best-fitting model employs this dust chemistry. The adoption of the OHMc optical properties is critical to their successful description of the Spitzer IRS spectrum. The dust is actually more important than the multiple free parameters they use to describe the geometry. Furthermore, the OHMc dust better fits the central wavelengths of the observed silicate features, with the observed 10m absorption peak arising at a longer wavelength than the Draine dust would produce.
Other dust models to consider are those of Chiar & Tielens (2006), who also prefer the longer-wavelength 10m silicate peak. These authors find relatively strong interstellar absorption at 18m in observations of several Galactic Wolf-Rayet stars, with toward the Galactic Center, which is comparable to the corresponding OHMc ratio, and 0.70 in the local ISM. Independently, measurements of molecular hydrogen line ratios along lines of sight near the Galactic Center also favor similar high values for this ratio (Simpson et al., 2007). In contrast, the Chiar & Tielens (2006) extinction curves have rather low strength ratios ( and 0.19, for the Galactic Center and local ISM, respectively). The former is intermediate between the Draine and OHMw values, while the latter is lower than all others we consider. We did not employ either of the Chiar & Tielens (2006) dust models in the computational models, which require complete tabulations of the scattering and absorption cross sections.
5.2 Artificial Dust Chemistry
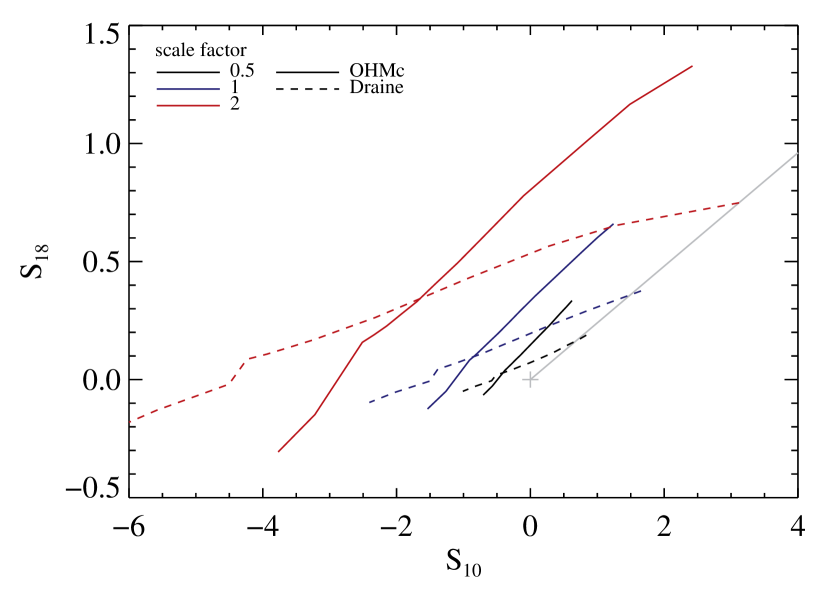
We consider whether modifying the tabulated optical properties of dust in a simple way can bring all the resulting smooth shell tracks into agreement with the large strength observations. We artificially scale the cross sections of the two silicate features by the same factor relative to the featureless continuum. This procedure is equivalent to scaling the excess over the red curves plotted in Figure 3. The ratio remains constant, although both and individually change. Because we do not alter the underlying continuum, this transformation does change the ratio .
Figure 10 shows that the consequence of this modification is to shift the curves up and down without changing their slopes. We plot the results of scaling the Draine silicates by logarithmic factors of two in the models. We choose this particular density profile because the results are independent of , yielding a one-parameter family of tracks. Density laws or 1, for which shell thickness is important, exhibit similar behavior. All displayed models have the same value of . Therefore, the initial points () of all tracks lie nearly on the same line that originates at the featureless dust point and has a slope equal to the common ratio. As is evident in the figure, scaled dust properties also produce tracks that have nearly the same slope. That is, the initial point fully determines the slope of the smooth shell tracks. Considering an arbitrary line drawn from the featureless point (0, 0), all tracks that originate along this line will have roughly the same slope.
The comparable calculation for the OHMc dust is also plotted, and its unscaled curve (solid blue line) serves to indicate the initial trend of the observed strengths. Evidently, the Draine dust cannot be artificially rescaled to resemble the OHMc results. Having already considered a great range of dust geometries, we conclude that no scaling can be applied to the Draine or OHMw dust to steepen the strength trends of the continuous shell models and successfully match the observations at large strength. The data fundamentally require a higher ratio of , which the OHMc dust provides. The low values of the Chiar & Tielens extinction laws imply that these dust models, too, cannot produce tracks that match the observations, in spite of their relatively high values of . The reason the Chiar & Tielens dust models couple a high extinction ratio with a low strength ratio is their relatively higher continuum around the 18m feature. Reducing the relative extinction at long wavelengths would lower the continuum and thereby increase the relative strength of the 18m feature.
6 Geometric Families and Optical Classification
The two silicate strengths together empirically separate the present ULIRG sample into two families with a discernible gap, as is evident in Figures 7 through 9. ULIRGs in the first group are deeply absorbed, exhibiting and comparably deep 18m absorption. ULIRGs belonging to the second group have shallow absorption or emission, with and commensurate 18m behavior. Theoretically, we account for these two families in terms of their dust distributions: sources in the first group are embedded in smooth dust distributions, while those in the second have clumpy distributions. As we noted in §4.2, the clumpy tracks populate a distinct region of the feature-feature diagram that is inaccessible to the smooth shell models. We employed the generic spherical geometry to minimize the number of free parameters of the models, but the results remain valid even if the sphere is stretched or distorted, provided the axial ratios do not become extreme (Vinković et al., 2003).
The first group shows deep absorption, requiring smooth shells, though ruling out the most concentrated () density distributions. Members of the second (shallow absorption) group do not lie on the low- regime of the continuous shell models. Instead, they are located in the realm of fragmented shells where the total optical depth at is greater than , and . Despite the small magnitude of within this group of ULIRGs, the average total optical depth of the reprocessing material must be large, although the dust need not be located along the line of sight. (Indeed, the observation of silicate emission requires an unobscured line of sight to some heated cloud faces.) While the measurement of alone does not discriminate between the smooth and clumpy distributions, the combination of both and together is diagnostically powerful.
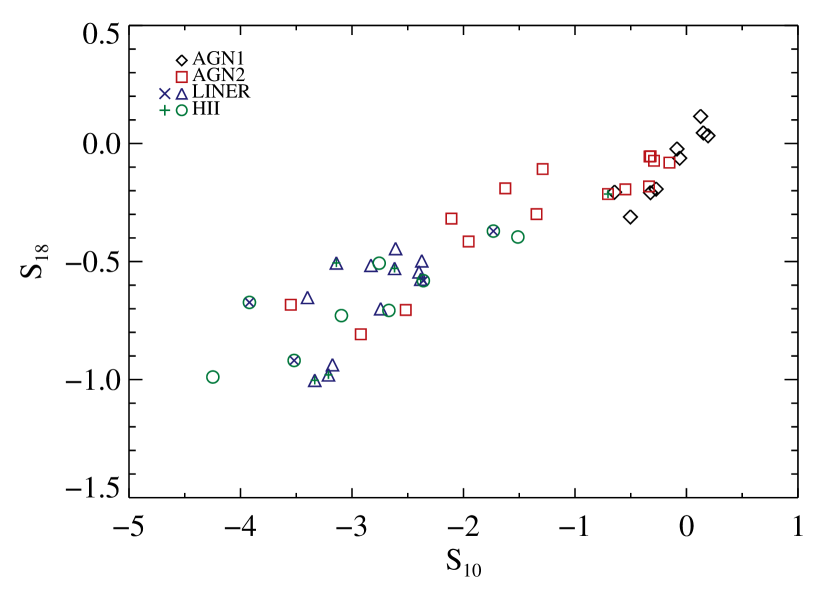
The optical classifications of the weak-PAH ULIRGs we study are related to these two geometric families. Figure 11 again shows the feature-feature diagram, adding identification of the galaxy nuclei as characteristic of AGNs, LINERs, or H II regions (listed in Table Silicates in Ultra-Luminous Infrared Galaxies), using optical emission line ratios from the literature. The clumpy group contains AGNs exclusively, while the optical LINERs and H II galaxies are all members of the deeply-embedded smooth shell group. Starting with the latter group, the source responsible for the MIR emission from these deeply embedded ULIRGs cannot be located in the region that produces the detected optical lines because large quantities of dust hide the embedded source from direct view. Conversely, the regions that produce the optical emission lines cannot contribute significantly to the MIR spectrum, because otherwise they would fill the silicate absorption troughs. For example, additional MIR radiation cannot be present at greater than the 5% level in order to measure . The absence of optically LINER- and H II-like sources with in our sample suggests that the IR emission and optical lines always emanate from different regions in such ULIRGs. Thus, we cannot draw any firm conclusions about the embedded sources’ underlying nature as AGNs or starburst nuclei. Embedding both an accreting active nucleus and the high ionization line-emitting regions could result in optical line ratios that are not typical of AGNs, even though a buried AGN is present. Independent of whether an AGN or star formation is responsible for the galaxy’s large and deeply obscured luminosity (and the silicate strengths), less-buried star formation produces the H II spectra that are detectable at optical wavelengths, as others have suggested (Imanishi et al., 2006, 2007).
The ULIRG sample includes objects that are optically identified as AGNs. Axial symmetry is the foundation of the standard AGN unification scheme, with a toroidal dust distribution, whereas the models we present here employ spherical symmetry. However, the clumpy distributions preserve the essence of standard unification, with the stochastic variations of the clump distribution resulting in variations of viewing geometry. In the standard model, both the central engine and the broad emission line region are obscured from view when the line of sight passes through the torus, and these are designated “type 2” AGNs. In these obscured cases, spherical models yield the same results as equatorial views through a torus, whether smooth or clumpy, producing 10 and 18m silicate features in absorption. On the other hand, when the central engine is viewed along the symmetry axis, the AGN is unobscured, broad emission lines are observed, and the AGN is classified as “type 1.” Even in this unobscured case, the observed MIR radiation originates in the surrounding optically thick torus. Because the toroidal geometry allows in type 1 viewing a direct line of sight to the heated dust surface, the silicate features appear in emission (e.g., Pier & Krolik, 1992). Smooth spherical dust configurations are inapplicable in this case because they offer no unobscured lines of sight to the central engine. However, clumpy spherical models do faithfully reproduce the behavior of the silicate features for both type 1 and type 2 AGNs; the detailed clumpy torus calculations of Nenkova et al. (2002, 2007) produce spectra that are quite similar to those of the clumpy spheroidal dust distributions we present here. Fundamentally, clumpy spherical models are valid because they allow direct views of the AGN and heated cloud surfaces from some select lines of sight that by chance avoid any obscuring clumps; the only significant difference between the two morphologies is that the fraction of unobscured lines of sight to the central engine increases when the clump distribution becomes toroidal. The spherical models offer the advantage of minimizing the number of free parameters while retaining the essential ones that govern the behavior of the silicate features. The regions of the feature-feature diagrams that these models occupy are accessible only to clumpy models, irrespective of their geometry.
In contrast with the deeply embedded ULIRGs, all sources in the region of clumpy tracks exhibit characteristic AGN optical emission, with permitted lines that are either broad (type 1) or narrow (type 2). The location of both type 1 and type 2 AGN ULIRGs in the clumpy geometric group argues that the obscuring torus itself is clumpy, as first proposed by Krolik & Begelman (1988) and recently verified for the Circinus AGN by MIR interferometric observations (Tristram et al., 2007). The distribution of AGN types 1 and 2 in the feature-feature diagram supports the AGN clumpy torus unification scheme. All type 1 AGNs are located in the clumpy region. Indeed, each of these sources offers an unobscured line of sight to the AGN, so the only emitting dust is the torus, which is clumpy. In contrast, type 2 AGNs are located in both the clumpy and deeply absorbed regions of the diagram. AGNs in the former group represent the direct type 2 analogs of the type 1 sources. The deep absorption features cannot be explained by the clumpy torus but instead arise naturally from additional obscuration by cold foreground dust. The fact that this additional dust is required only in some type 2, but no type 1, AGNs agrees with the large extent—hundreds of pc—of the narrow line region. Blocking the central engine and the broad line region produces a type 2 AGN, irrespective of the torus orientation. A dusty filament a few tens of pc wide can hide the AGN central engine without obscuring the narrow line region. If this dust is not heated by the central source, it will act as a cold screen and produce an absorption feature. The depth of the absorption is limited only by the 10m emission of the screen itself, so deep absorption can occur when the AGN radiation does not heat the dust and the screen remains cold (K). For example, the deepest AGN feature we observe is , which a single cold molecular cloud with could produce.
In principle, a cold screen could account for the deep silicate absorption in all these galaxies. However, in order to remain cold, such a screen cannot simultaneously reprocess the intrinsic radiation to emerge at the enormous IR luminosities that identify ULIRGs. Thus, the cold screen must be invoked in addition to the reprocessing, large optical depth dusty component. Furthermore, the screen must always fully cover the primary reprocessing dust along the line of sight. Such screens present a contrived solution for ULIRGs generally, requiring two separate dust regions and correlating the presence of these screens along the line of sight with the large IR luminosity of ULIRGs. Moreover, we do not observe any unscreened counterparts of the optically LINER- and H II-like sources. Instead, we find the single entity of embedding dust to account more plausibly for the total IR characteristics of deeply absorbed ULIRGs.
We caution that this ULIRG sample is neither complete nor unbiased, selected for small (less than 0.1). We cannot draw general conclusions about the distribution of ULIRG properties, and we emphasize that the present comparison is with only the optical classification, not the total evidence for an AGN or starburst nature of the dominant underlying energy source. However, having already eliminated those ULIRGs that exhibit evidence for strong star formation in the MIR from this analysis, we find a range of optical characteristics even within this restricted subsample.
Classifying a variety of galaxies on the basis of and , Spoon et al. (2007) identify two distinct branches in the relationship between these measurements. They suggest that characteristically different dust distributions—either clumpy or smooth—produce these two distinct branches, and our results validate this conjecture. While we consider only the small subsample of ULIRGs here, it includes members of both branches, selected where the two branches are most widely separated. The weak ULIRGs are members of the Spoon et al. (2007) “Class 1,” which they associate with clumpy obscuration. Although the weak alone could be consistent with either the smooth or clumpy geometry, Figure 7 demonstrates that measurements of and together eliminate the possibility of smooth geometry. The deeply absorbed ULIRGs of the present work are located along the branch that Spoon et al. (2007) associate with smooth dust distributions. Indeed, for this group both silicate measurements agree quantitatively with the computational results for smooth obscuration, supporting the interpretation of Spoon et al. (2007). In addition, we note that Desai et al. (2007) include optical identifications with this and classification. They find some separation of optical types among the low- objects we study here, in agreement with our results based on optical classification and both silicate feature strengths.
Imanishi et al. (2007) use measurements similar to the silicate strength as a qualitative indicator of the geometry of the central regions of ULIRGs. Although they determine the continuum with a local power law fit, they identify deep absorption () with an embedded central source, in agreement with this work and with Levenson et al. (2007). Imanishi et al. (2007) separately consider the strength ratio; they associate a small value of with an embedded central source and expect a larger ratio when the heating sources are distributed (as in a starburst). However, our radiative transfer calculations show that without considering the strengths of the individual features, the strength ratio alone is insufficient to determine the dust geometry. Central heating sources located behind low optical depth continuous media, inhomogeneous distributions, and even foreground screens can produce low values of . Instead, the strength ratio depends primarily on dust chemistry, and both and are necessary to diagnose dust geometry.
7 Conclusions
The large luminosity of ULIRGs requires that these galaxies possess both an underlying source that is more energetic than star formation within ordinary galaxies and dust to reprocess the intrinsic radiation to long wavelengths. Observations in the IR offer the obvious advantage of directly detecting the light that emerges. Although they suffer the disadvantage that dust reprocessing erases the detailed signature of the nature of the energy source, as we have shown quantitatively, MIR spectroscopy does directly probe the dust itself. Analysis of the silicate features in particular provides useful diagnostics of the geometric distribution of dust and its optical properties, which ultimately depend on its mineralogy.
Comparing observations of ULIRGs with several models of dust chemistry, we find that numerical simulations of radiative transfer employing the observationally-motivated OHMc dust properties match the data well, and this dust is required when deep absorption is measured. The key difference between this model and others that are frequently employed is the relatively high silicate absorption peak near 18m relative to that near 10m; this strength ratio is around 0.5 in the OHMc dust. These properties are physically-motivated, based on laboratory measurements of amorphous silicates. Including the effects of grain oxidation results in the higher ratio of 18/10m cross section, which is characteristic of bronzite (Ossenkopf et al., 1992, and references therein). This dust chemistry is not peculiar to the ULIRGs or to the nuclei of galaxies, but also fits observations within the Galaxy and Magellanic Clouds. Moreover, local observations where the silicates appear in emission rule out the OHMw and Draine dust at low optical depths.
Quantifying the strength of the silicate features requires determining the underlying continuum accurately. We demonstrate that including measurements of the continuum at intermediate wavelengths between the features yields physically consistent results, and we recommend specific modifications to the idealized method when observational complications, such as photoionized emission or ice absorption bands, are present. We emphasize that because the same dust is responsible for both the feature and continuum, the apparent optical depth of silicate absorption does not reveal the line of sight optical depth, independent of the continuum-fitting procedure.
We identify two distinct families in the ULIRG measurements, which is a consequence of fundamental differences in obscuring geometry. One class shows deep absorption (). These energetic sources must be deeply embedded in a continuous medium that is geometrically and optically thick (). The other class exhibits weak silicate features, which may appear in absorption or emission. Either a geometrically thin slab or a clumpy dusty medium can account for these observations, but they do not represent the low optical depth realm of the continuous geometry. In addition, we find that these two ULIRG families of geometry are related to the optical identification of the galaxy nuclei. All members of the second (low-strength) class are AGNs, while ULIRGs having spectra characteristic of LINERs and H II regions systematically exhibit the deepest absorption. Among the deeply embedded sources, the MIR emission and optical lines always emanate from different regions. Optically-identified LINERs may be a heterogeneous class, but the consistent finding of H II ULIRGs only in the deeply embedded group leads us to speculate that two different regions dominate the IR and optical emission line signatures in all such optical H II ULIRGs.
In spite of the general degeneracy of IR SEDs (e.g., Vinković et al., 2003), extreme absorption of the 10m feature alone proves to be a strong indicator of smooth (as opposed to clumpy) dust distributions (Levenson et al., 2007). Here we find that the combination of 10 and 18m silicate features together constrains the geometry even more powerfully in a wider range of situations. Furthermore, the analysis tool of the feature-feature diagram we introduce here provides a strong diagnostic of the dust chemistry. The optical properties fix the absolute zero points and the slopes of the linear trends of silicate strength that variations of the model parameters can produce. However, because analysis based on this diagram is sensitive only to the feature strengths in the absorption cross section, it does not probe feature shape, peak wavelength, or properties such as mineral composition directly. We conclude that of the available models, the OHMc dust best describes cosmic silicate feature strengths, both in ULIRGs and local sources.
References
- Allen et al. (1991) Allen, D. A., Norris, R. P., Meadows, V. S., & Roche, P. F. 1991, MNRAS, 248, 528
- Armus et al. (1989) Armus, L., Heckman, T. M., & Miley, G. K. 1989, ApJ, 347, 727
- Armus et al. (2004) Armus, L., et al. 2004, ApJS, 154, 178
- Armus et al. (2006) ——. 2006, ApJ, 640, 204
- Armus et al. (2007) ——. 2007, ApJ, 656, 148
- Arribas et al. (2000) Arribas, S., Colina, L., & Borne, K. D. 2000, ApJ, 545, 228
- Chiar & Tielens (2006) Chiar, J. E., & Tielens, A. G. G. M. 2006, ApJ, 637, 774
- Clements et al. (1996) Clements, D. L., Sutherland, W. J., Saunders, W., Efstathiou, G. P., McMahon, R. G., Maddox, S., Lawrence, A., & Rowan-Robinson, M. 1996, MNRAS, 279, 459
- de Grijp et al. (1992) de Grijp, M. H. K., Keel, W. C., Miley, G. K., Goudfrooij, P., & Lub, J. 1992, A&AS, 96, 389
- Desai et al. (2007) Desai, V., et al. 2007, ApJ, 669, 810
- Draine (2003a) Draine, B. T. 2003a, ARA&A, 41, 241
- Draine (2003b) ——. 2003b, ApJ, 598, 1017
- Draine (2003c) ——. 2003c, ApJ, 598, 1026
- Duc et al. (1997) Duc, P.-A., Mirabel, I. F., & Maza, J. 1997, A&AS, 124, 533
- Farrah et al. (2007) Farrah, D., et al. 2007, ApJ, 667, 149
- Farrah et al. (2005) Farrah, D., Surace, J. A., Veilleux, S., Sanders, D. B., & Vacca, W. D. 2005, ApJ, 626, 70
- Frogel et al. (1989) Frogel, J. A., Gillett, F. C., Terndrup, D. M., & Vader, J. P. 1989, ApJ, 343, 672
- Gallais et al. (2004) Gallais, P., Charmandaris, V., Le Floc’h, E., Mirabel, I. F., Sauvage, M., Vigroux, L., & Laurent, O. 2004, A&A, 414, 845
- Genzel et al. (1998) Genzel, R., et al. 1998, ApJ, 498, 579
- Gibb et al. (2004) Gibb, E. L., Whittet, D. C. B., Boogert, A. C. A., & Tielens, A. G. G. M. 2004, ApJS, 151, 35
- Gillett et al. (1975) Gillett, F. C., Kleinmann, D. E., Wright, E. L., & Capps, R. W. 1975, ApJ, 198, L65
- Gillett et al. (1968) Gillett, F. C., Low, F. J., & Stein, W. A. 1968, ApJ, 154, 677
- Hao et al. (2007) Hao, L., Weedman, D. W., Spoon, H. W. W., Marshall, J. A., Levenson, N. A., Elitzur, M., & Houck, J. R. 2007, ApJ, 655, L77
- Hao et al. (2005) Hao, L., et al. 2005, ApJ, 625, L75
- Houck et al. (2004) Houck, J., et al. 2004, ApJS, 154, 18
- Imanishi et al. (2007) Imanishi, M., Dudley, C. C., Maiolino, R., Maloney, P. R., Nakagawa, T., & Risaliti, G. 2007, ApJS, 171, 72
- Imanishi et al. (2006) Imanishi, M., Dudley, C. C., & Maloney, P. R. 2006, ApJ, 637, 114
- Ivezić & Elitzur (1997) Ivezić, Ž., & Elitzur, M. 1997, MNRAS, 287, 799
- Ivezić, Nenkova, & Elitzur (1999) Ivezić, Ž., Nenkova, M., & Elitzur, M. 1999, User Manual for DUSTY, University of Kentucky Internal Report, accessible at http://www.pa.uky.edu/~moshe/dusty.
- Kemper et al. (2004) Kemper, F., Vriend, W. J., & Tielens, A. G. G. M. 2004, ApJ, 609, 826
- Keel et al. (2005) Keel, W. C., Irby, B. K., May, A., Miley, G. K., Golombek, D., de Grijp, M. H. K., & Gallimore, J. F. 2005, ApJS, 158, 139
- Kim et al. (1998) Kim, D.-C., Veilleux, S., & Sanders, D. B. 1998, ApJ, 508, 627
- Kleinmann et al. (1976) Kleinmann, D. E., Gillett, F. C., & Wright, E. L. 1976, ApJ, 208, 42
- Krolik & Begelman (1988) Krolik, J. H., & Begelman, M. C. 1988, ApJ, 329, 702
- Lawrence et al. (1999) Lawrence, A., et al. 1999, MNRAS, 308, 897
- Lebouteiller et al. (2007) Lebouteiller, V., Brandl, B., Bernard-Salas, J., Devost, D., & Houck, J. R. 2007, ApJ, 667, 390
- Leitherer et al. (1999) Leitherer, C., et al. 1999, ApJS, 123, 3
- Levenson et al. (2007) Levenson, N. A., Sirocky, M. M., Hao, L., Spoon, H. W. W., Marshall, J. A., Elitzur, M., & Houck, J. R. 2007, ApJ, 654, L45
- Low et al. (1988) Low, F. J., Cutri, R. M., Huchra, J. P., & Kleinmann, S. G. 1988, ApJ, 327, L41
- Low & Krishna Swamy (1970) Low, F. J., & Krishna Swamy, K. S. 1970, Nature, 227, 1333
- Maiolino et al. (2001) Maiolino, R., Marconi, A., Salvati, M., Risaliti, G., Severgnini, P., Oliva, E., La Franca, F., & Vanzi, L. 2001, A&A, 365, 28
- Marshall et al. (2007) Marshall, J. A., Herter, T. L., Armus, L., Charmandaris, V., Spoon, H. W. W., Bernard-Salas, J., & Houck, J. R. 2007, ApJ, 670, 129
- Mathis et al. (1977) Mathis, J. S., Rumpl, W., & Nordsieck, K. H. 1977, ApJ, 217, 425
- Mazzarella & Balzano (1986) Mazzarella, J. M., & Balzano, V. A. 1986, ApJS, 62, 751
- Molster & Waters (2003) Molster, F. J., & Waters, L. B. F. M. 2003, in Lecture Notes in Physics Vol. 609, Astromineralogy, ed. T.K. Henning, (Berlin: Springer), 121
- Nenkova et al. (2002) Nenkova, M., Ivezić, Ž., & Elitzur, M. 2002, ApJ, 570, L9
- Nenkova et al. (2007) Nenkova, M., Sirocky, M. M., Nikutta, R., Ivezić, Ž., & Elitzur, M. 2007, submitted to ApJ
- Ossenkopf et al. (1992) Ossenkopf, V., Henning, T., & Mathis, J. S. 1992, A&A, 261, 567
- Pier & Krolik (1992) Pier, E. A., & Krolik, J. H. 1992, ApJ, 401, 99
- Pottasch & Surendiranath (2005) Pottasch, S. R., & Surendiranath, R. 2005, A&A, 444, 861
- Rieke & Low (1975a) Rieke, G. H., & Low, F. J. 1975, ApJ, 197, 17
- Rieke & Low (1975b) Rieke, G. H., & Low, F. J. 1975, ApJ, 199, L13
- Risaliti et al. (2000) Risaliti, G., Gilli, R., Maiolino, R., & Salvati, M. 2000, A&A, 357, 13
- Roussel et al. (2006) Roussel, H., et al. 2006, ApJ, 646, 841
- Rowan-Robinson (1995) Rowan-Robinson, M. 1995, MNRAS, 272, 737
- Rowan-Robinson (2000) ——. 2000, MNRAS, 316, 885
- Rupke et al. (2005) Rupke, D. S., Veilleux, S., & Sanders, D. B. 2005, ApJ, 632, 751
- Shi et al. (2006) Shi, Y., et al. 2006, ApJ, 653, 127
- Sanders et al. (1988a) Sanders, D. B., Soifer, B. T., Elias, J. H., Madore, B. F., Matthews, K., Neugebauer, G., & Scoville, N. Z. 1988a, ApJ, 325, 74
- Sanders et al. (1988b) Sanders, D. B., Soifer, B. T., Elias, J. H., Neugebauer, G., & Matthews, K. 1988b, ApJ, 328, L35
- Simpson et al. (2007) Simpson, J. P., Colgan, S. W. J., Cotera, A. S., Erickson, E. F., Hollenbach, D. J., Kaufman, M .J., & Rubin, R. H. 2007, ApJ, 670, 1115
- Spoon et al. (2007) Spoon, H. W. W., Marshall, J. A., Houck, J. R., Elitzur, M., Hao, L., Armus, L., Brandl, B. R., & Charmandaris, V. 2007, ApJ, 654, L49
- Spoon et al. (2004) Spoon, H. W. W., et al. 2004, ApJS, 154, 184
- Spoon et al. (2006) ——. 2006, ApJ, 638, 759
- Spoon et al. (2005) Spoon, H. W. W., Keane, J. V., Cami, J., Lahuis, F., Tielens, A. G. G. M., Armus, L., & Charmandaris, V. 2005, in IAU Symposium 231, Astrochemistry: Recent Successes and Current Challenges, ed. D. C. Lis, G. A. Blake, & E. Herbst (Cambridge: Cambridge University Press), 281
- Stanford et al. (2000) Stanford, S. A., Stern, D., van Breugel, W., & De Breuck, C. 2000, ApJS, 131, 185
- Tristram et al. (2007) Tristram, K. R. W., et al. 2007, A&A, 474, 837
- Vader & Simon (1987) Vader, J. P., & Simon, M. 1987, Nature, 327, 304
- Vázquez & Leitherer (2005) Vázquez, G. A., & Leitherer, C. 2005, ApJ, 621, 695
- Veilleux et al. (1999) Veilleux, S., Kim, D.-C., & Sanders, D. B. 1999, ApJ, 522, 113
- Veilleux et al. (1995) Veilleux, S., Kim, D.-C., Sanders, D. B., Mazzarella, J. M., & Soifer, B. T. 1995, ApJS, 98, 171
- Vinković et al. (2003) Vinković, D., Ivezić, Ž., Miroshnichenko, A. S., & Elitzur, M. 2003, MNRAS, 346, 1151
- Werner et al. (2004) Werner, M., et al. 2004, ApJS, 154, 1
- Whitney et al. (2003) Whitney, B. A., Wood, K., Bjorkman, J. E., & Cohen, M. 2003, ApJ, 598, 1079
- Woolf & Ney (1969) Woolf, N. J., & Ney, E. P. 1969, ApJ, 155, L181
| Galaxy | Optical ClassaaOptical classification: A1 = broad-line AGN; A2 = narrow-line AGN; L = LINER; H = H ii galaxy. Multiple classes are listed when various diagnostic diagrams or alternative analysis yields different results, with the primary classification listed first. | Optical Reference | ||||
|---|---|---|---|---|---|---|
| -3.5 | 9.4 | -0.92 | 18.0 | H, L | 1 | |
| F | -2.8 | 9.9 | -0.52 | 18.3 | L | 2 |
| -2.6 | 9.8 | -0.44 | 18.0 | L | 1 | |
| -0.3 | 10.2 | -0.21 | 18.0 | A1 | 3 | |
| -2.8 | 9.8 | -0.51 | 17.9 | H | 1 | |
| -2.0 | 9.5 | -0.41 | 17.8 | A2 | 4 | |
| -0.7 | 9.8 | -0.21 | 18.1 | A2, H | 5, 1 | |
| SE | -3.1 | 9.6 | -0.73 | 17.4 | H | 1 |
| -4.2 | 9.9 | -0.99 | 18.0 | H | 1 | |
| FF J | -2.1 | 9.8 | -0.32 | 17.5 | A2 | 6 |
| -0.1 | 10.8 | -0.02 | 17.9 | A1 | 7 | |
| -3.5 | 10.0 | -0.68 | 17.6 | A2 | 8 | |
| -0.3 | 9.8 | -0.23 | 18.2 | A2 | 9 | |
| -1.5 | 9.9 | -0.40 | 18.5 | H | 10 | |
| -2.4 | 9.8 | -0.54 | 17.7 | L | 11 | |
| 0.2 | 9.6 | 0.05 | 17.2 | A1 | 12 | |
| NW | -3.9 | 9.9 | -0.67 | 17.8 | H, L | 13, 14 |
| -3.3 | 9.9 | -1.00 | 18.3 | L, H | 14 | |
| -2.4 | 9.9 | -0.50 | 17.9 | L | 1 | |
| -3.4 | 9.9 | -0.65 | 18.2 | L | 10 | |
| -3.2 | 10.0 | -0.94 | 18.2 | L | 14 | |
| -2.7 | 9.8 | -0.70 | 18.3 | L | 1 | |
| -1.3 | 9.9 | -0.30 | 18.2 | A2 | 12 | |
| NE | -2.4 | 9.8 | -0.57 | 17.8 | L, H | 1 |
| -1.6 | 9.8 | -0.19 | 18.0 | A2 | 15 | |
| -0.5 | 9.9 | -0.31 | 18.2 | A1 | 16 | |
| -0.3 | 9.8 | -0.05 | 18.4 | A2 | 12 | |
| -2.9 | 10.0 | -0.81 | 18.0 | A2 | 14 | |
| F | -2.5 | 10.6 | -0.70 | 17.9 | A2 | 17 |
| -2.4 | 9.9 | -0.58 | 17.8 | H, L | 1 | |
| -3.1 | 9.8 | -0.51 | 18.0 | L, H | 18 | |
| -0.3 | 10.3 | -0.19 | 18.4 | A1 | 10 | |
| -2.6 | 9.9 | -0.53 | 18.1 | L, H | 14 | |
| -1.7 | 9.9 | -0.37 | 18.0 | H, L | 19, 14 | |
| -0.2 | 9.2 | -0.08 | 18.0 | A2 | 1 | |
| S | -1.3 | 9.4 | -0.11 | 18.3 | A2 | 10 |
| -0.1 | 10.1 | -0.06 | 18.8 | A1 | 7 | |
| -2.7 | 10.1 | -0.71 | 18.1 | H | 10 | |
| -0.3 | 9.7 | -0.07 | 17.8 | A2 | 20 | |
| -3.2 | 10.0 | -0.98 | 18.0 | L, H | 1 | |
| -0.5 | 9.8 | -0.19 | 18.3 | A2 | 1 | |
| F | -0.3 | 9.3 | -0.05 | 18.4 | A2 | 21 |
| 3C273 | 0.1 | 10.9 | 0.12 | 17.5 | A1 | |
| Mrk 1014 | 0.2 | 9.5 | 0.03 | 17.4 | A1 | 22 |
| Mrk 231 | -0.6 | 9.8 | -0.21 | 17.6 | A1 | 9 |
| Mrk 463E | -0.4 | 9.8 | 0.09 | 18.3 | A2 | 22 |
References. — (1) Veilleux et al. 1999; (2) Armus et al. 1989; (3) Vader & Simon 1987; (4) Allen et al. 1991; (5) Farrah et al. 2005; (6) Stanford et al. 2000; (7) Lawrence et al. 1999; (8) Risaliti et al. 2000; (9) Sanders et al. 1988a; (10) Duc et al. 1997; (11) Keel et al. 2005; (12) Sanders et al. 1988b; (13) Arribas et al. 2000; (14) Kim et al. 1998; (15) Cutri et al. private communication, cited in Rowan-Robinson 2000; (16) Low et al. 1988; (17) Rupke et al. 2005; (18) Veilleux et al. 1995; (19) deGrijp et al. 1992; (20) Frogel et al. 1989; (21) Clements et al. 1996; (22) Mazzarella & Balzano 1986.