Star formation and bar instability in cosmological haloes
Abstract
Context. This is the third of a series of papers presenting the first attempt to analyze the growth of the bar instability in a consistent cosmological scenario. In the previous two articles we explored the role of the cosmology on stellar disks, and the impact of the gaseous component on a disk embedded in a cosmological dark matter halo.
Aims. The aim of this paper is to point out the impact of the star formation on the bar instability inside disks having different gas fractions.
Methods. We perform cosmological simulations of the same disk-to-halo mass systems as in the previous works where the star formation was not triggered. We compare the results of the new simulations with the previous ones to investigate the effect of the star formation by analysing the morphology of the stellar components, the bar strength, the behaviour of the pattern speed. We follow the gas and the central mass concentration during the evolution and their impact on the bar strength.
Results. In all our cosmological simulations a stellar bar, lasting 10 Gyr,
is still living at z=0.
The central mass concentration of gas and of the new stars has a mild action
on the ellipticity of the bar but is not able to destroy it; at z=0 the
stellar bar strength is enhanced by the star formation.
The bar pattern speed is decreasing with the disk evolution.
Key Words.:
galaxies: spirals, structure, evolution, halos, kinematics and dynamics1 Introduction
The connection between the bar feature and the star formation process has
already been pointed out in the past: Martinet & Friedli (1997) observed that
non interacting galaxies displaying the highest star forming activity have strong and long bars.
Conversely not all strong and long bars are intensively creating stars.
Mazzei & Curir (2001) performed SPH simulations to investigate the dependence
of the star formation in disks on the geometry and dynamical state of the DM
halo.
They showed that the star formation lengthens the life time of the bar.
However in their works the evolution of the disk+halo system arises in a isolated framework,
outside the cosmological scenario.
The treatment of the star formation in galaxies involves
a large number of physical processes which arise with different time
scales and spatial lengths.
Therefore its inclusions in simulations of galaxy formation is complex
(Mazzei & Curir (2003) and references therein) and many sub-grid parametrisations
(i.e. representing all the astrophysical processes that cannot be resolved due
to resolution or computing power limitations) of the star formation process, exist
in literature.
To mimic all these processes with a numerical model of a realistic disk
galaxy is difficult too. Thus the numerical work on this subject focuses
either on a detailed analysis of the interstellar medium (ISM) and a smaller simulated area
(Wada 2001; Avillez et al. 2000) or on the study of the global instabilities and of the star formation
at the cost of simplified ISM models (Robertson et al. 2004; Semelin & Combes 2002; Combes & Melchior 2002).
Models that have tackled both topics have either been in two dimensions
(Wada & Norman 2001) or restricted to a box size a few hundred parsecs across
(Wada 2001). Rosen & Bregman (1995) worked in two dimensions allowing the ISM to evolve
self-consistently but treated the stars as collisional rather than collisionless fluid.
Tasker & Bryan (2006) presented the first three dimensional simulations of a global disk without
the need to simplify the structure of the ISM. Their paper is devoted to understand the
fundamental processes of star formation and feedback in a disk galaxy.
Here we performed cosmological simulations to analyse the effects of the
star formation process inside stellar-gaseous disks embedded in a DM cosmological halo evolving
in a fully consistent scenario.
We employ the sub-grid star formation model by Springel & Hernquist (2003) which is able to
produce a self-regulated star formation in galactic disks.
We point out that our model is not a general galaxy evolution model, since the
gradual formation and growth of the stellar disk has not been taken into
account. However our approach, developed in two previous papers (Curir et al. 2006, 2007),
allows us to investigate the effects of different parameters like the
disk-to-halo mass ratio and the gas fraction inside the disk, on the growth
of the bar instability, its coupling with the star formation rate and its dependence
on such parameters in a self-consistent cosmological framework.
We compare the results of such a new set of simulations with those of our previous sets
with the star formation switched off (Curir et al. (2006), hereafter
Paper 1, Curir et al. (2007), hereafter Paper 2). In Paper 1 we presented
simulations of purely stellar disks with the same disk-to-halo mass ratios,
in the same cosmological scenario, and with the same initial conditions as in
this new paper. In Paper 2 we investigated the growth and the evolution of the bar
instability in disks with the same disk-to-halo mass ratios as in Paper 1, and
different gas fractions, without star formation.
Thus, we will compare the results of simulations here performed, with those
corresponding to the same disk-to-halo mass ratio as in Paper 1 and to the same
gas fraction as in Paper 2.
The comparison between the parameters characterising the bar can be done only
evaluating that of the old stars component, since the new stars are not
present in Paper 1 and 2.
In both such Papers it was shown that in DM dominated disks a bar
feature is triggered and maintained by the Cosmology whereas, in the more
massive disks, a gas fraction 0.2 is able to destroy the bar.
The focus of the present
work is to determine if the star formation changes such a result.
The plan of the paper is the following: in Section 2, we summarise our recipe for the initial system fully described in Paper 1, and present our star formation recipe. In Section 3 there are our cosmological simulations, in Section 4 we point out our results. The parameters related to the bars formed in the new and the old stars and to the global, old+new, stellar populations are given in such a section. Section 5 is devoted to our discussion and conclusions. It contains a Table including the parameters characterising the old stellar bar at z in the three Papers to allow a more easy comparison between the results of our Papers (Table 2).
2 Method
We embed a gaseous and stellar disk inside a cosmological halo selected in a suitable slice of Universe and follow its evolution inside a cosmological framework: a CDM model with 0.3, 0.7, 0.9, 0.7, where is the total matter of the Universe, the cosmological constant, the normalisation of the power spectrum, and the value of the Hubble constant in units of 100 km s-1Mpc-1.
A detailed description of our method to produce the cosmological scenario where the disk is evolved has been given in Paper 1. Here we present a short overview of our recipe. Paper 1 showed that the numerical resolution does not impair their main result: in pure stellar disks, long living bars are a ’natural’ outcome of the cosmological scenario.
2.1 The DM halo
To select the DM halo, we perform a low-resolution simulation of a concordance CDM cosmological model, starting from redshift 20.
With a standard ’friends of friends algorithm’ we selected one suitable DM
halo with a mass M1011 M⊙ (at
z=0). We resample it with the multi-mass technique described in
Klypin et al. (2001). The particles of the DM halo, and those belonging to a sphere
with a radius Mpc, are followed to their Lagrangian position and
re-sampled to an equivalent resolution of 1024 3 particles. The total
number of DM particles in the high resolution corresponds to a DM mass
resolution of . The high-resolution DM
halo is followed to the redshift z=0. We run the DM simulation, to extract
the halo properties in absence of any embedded stellar disk. The mass of our
halo at z=0, M⊙, corresponds to a
radius, Kpc, which entails 84720 halo particles.
The selected halo is living in an under-dense environment. From its accretion
history (see Fig. 1 in Paper 1) we conclude that our halo undergoes no
significant merger during the time it hosts our disk, nor immediately before.
The halo density profile is well–fitted by a Navarro, Frenk and White (NFW)
form (Navarro et al. (1996); Navarro et al. (1997)) at z 2. The concentration,
Cvir, equal to R, takes an high value, 18.1, confirming that
this halo does “form” at quite high redshift ( e.g. Wechsler et al. (2002) for a
discussion about the link between concentration and assembly history of the
halo). The dimensionless spin parameter of the halo is 0.04 at z=2, near to
the average one for our cosmological model (Maller et al. 2002; Bett et al. 2007).
Cosmological
DM haloes are not spherical (Bett et al. 2007, and references therein).
From a recent analysis of the halo shapes from
the Millennium simulation, Bett et al. (2007) show that halos
are triaxial and prolate. Their shape is driven by the hierarchical
formation.
The prolateness of our halo at z=2, where R30 Kpc, is 0.9, quite the same as at the disk radius (Paper 1,
Table 1).
2.2 The baryonic disk
The spatial distribution of particles follows the exponential surface density law: where r0 is the disk scale length, Kpc, and is the surface central density. The disk is truncated at five scale lengths with a radius: R20 Kpc. To obtain each disk particle’s position according to the assumed density distribution, we used the rejection method (Press et al. 1986). We used 56000 star particles and 56000 gaseous particles to describe our disk. The (Plummer equivalent) softening length, the same for DM, gas, and star particles, is Kpc in comoving coordinates.
We embed the disk in the high resolution cosmological simulation, at redshift 2, in a plane perpendicular to the angular momentum vector of the halo and in gravitational equilibrium with the potential. Its centre of mass corresponds to the minimum potential well of the DM halo. The initial redshift corresponds to 10.24 Gyr down to in our chosen cosmology. During the evolution, new star particles are formed from the gaseous particles. We will refer to such new component as ’new stars component’, whereas we will call ’old stars component’ the non dissipative particles present in the disks at z=2.
2.3 Star formation recipe
We use the sub-grid star formation prescription by Springel & Hernquist (2003). In such prescription, when a gas particle overcomes a given density threshold its gas content is considered to reside in a multi-phase state, corresponding to the equilibrium solution of an analytical model describing the physics of the multi-phase interstellar medium. Such a solution gives an effective temperature for the gas particle, obtained as a weighted average of the (fixed) temperature of the cold phase and that of the hot phase. The temperature of the hot phase is set by supernova feedback and by the efficiency of cloud evaporation. The resulting inter stellar medium (ISM) has an effective equation of state which is stiffer than isothermal and prevent Toomre instabilities even when a large amount of gas is present. When this prescription is used, the star formation rate agrees with the Schmidt law in disk galaxies, as obtained e.g. by Kennicut (1998). A detailed description of the numerical prescription and several tests can be found in Springel & Hernquist (2003). The effective temperature drives hydrodynamical interactions of the gas particles. Moreover, the model consistently gives a star formation rate, which is used to spawn a star particle from the gas one on the basis of a stochastic prescription; the initial mass function adopted is the Salpeter’s one. The star forming from the gas has the same position and velocity of the gaseous particle.
3 Simulations
We performed six cosmological simulations of a disk+halo system. We exploited the parallel Tree+SPH N-body code GADGET-2 (Springel 2005) (courtesy of V. Springel). The simulations run on the CLX computers located at the CINECA computing center (BO, Italy ) and on OATo Beowulf-class cluster of 32 Linux-based PC at the Osservatorio Astronomico di Torino.
| N | Mdisk | gas fraction | (o.s.) | (n.s.) | Qb (o.s.) | Qb (o.s.+n.s.) | amax (o.s.) | amax (n.s.) | bulge(o.s.) | bulge(n.s.) | bars in bars |
|---|---|---|---|---|---|---|---|---|---|---|---|
| c1 | 0.33 | 0.1 | 0.65 | 0.72 | 0.45 | 0.5 | 8 | 4 | y | n | n |
| c2 | 0.33 | 0.2 | 0.55 | 0.55 | 0.51 | 0.66 | 11 | 5.7 | y | y | n |
| c3 | 0.33 | 0.4 | 0.6 | 0.55 | 0.58 | 0.69 | 8.4 | 6 | y | y | n |
| c4 | 0.1 | 0.1 | 0.39 | 0.01 | 0.5 | 0.41 | 3 | - | n | y | y |
| c5 | 0.1 | 0.2 | 0.45 | 0.03 | 0.46 | 0.42 | 3 | - | n | y | y |
| c6 | 0.1 | 0.6 | 0.5 | 0.02 | 0.51 | 0.47 | 3 | - | n | y | y |
The main parameters and the final properties of our set of simulations
are listed in Table 1.
We define as a geometrical measure of the bar strength the value of the
ellipticity, (Table 1); a strong bar
corresponds to . A more dynamical measure of the bar
strength at radius R has been defined by Combes & Sanders (1981) by using the
parameter: where is the maximum amplitude of
tangential force and is the mean
axisymmetric radial force derived from the component of the
gravitational potential at the same radius, R. The maximum value of provides a measure of the
bar strength for the whole galaxy. Stronger bars correspond to higher Qb values. In order to compare the results with
the Papers 1 and 2 the values of are evaluated in the bars formed in the
old stars component, since in our previous works we didn’t include
the star formation process.
We give here in Table 1 also the
value of the parameters related to the bars formed in the new stars component and to the bar
strenght of the global old+new stars populations.
In Table 1 we present: the simulation
number (I column), the mass of the disk in code units (i. e. ) (II col.), the fraction of gas, i.e. gas–to–disk mass
ratio (III col.) Moreover we present, as final values (i. e. at ) the
maximum ellipticity for the old stars system(IV col.), and for the new stars
(V col.) the bar strength
according to Combes & Sanders (1981) for the old stars (VI col.), and for the old+new
stars system (VII col.), the major axis (physical Kpc)
corresponding to the maximum ellipticity for the old stars (VIII col.)and for
the new stars (IX col.), the morphology of the
inner region of the disk for the old stars (X col.) and for the new ones (XI col.), peculiar features inside the disk (XII
col.)
4 Results
In all our cosmological simulations,
a stellar bar is still living at z=0 in the old star component.
The new stars component at z=0 is arranged in a bulge component which can or
cannot present a barred shape depending on the initial mass of the disk and on
the gaseous fraction.
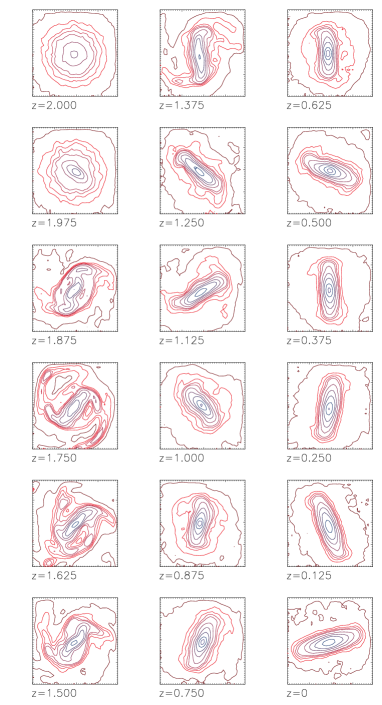
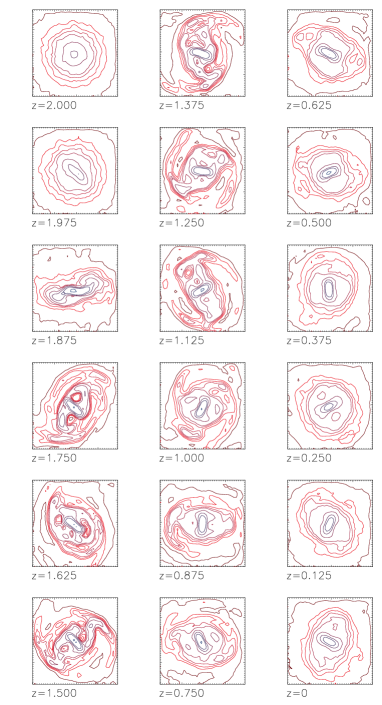
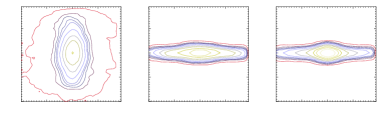
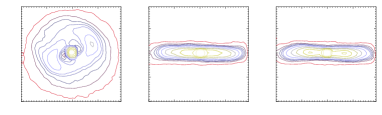
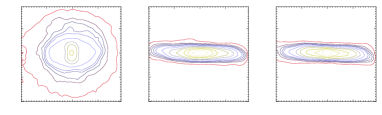
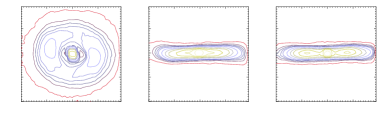
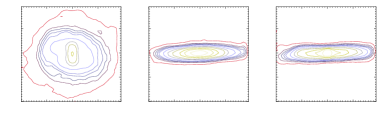
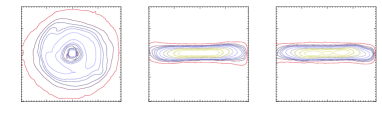
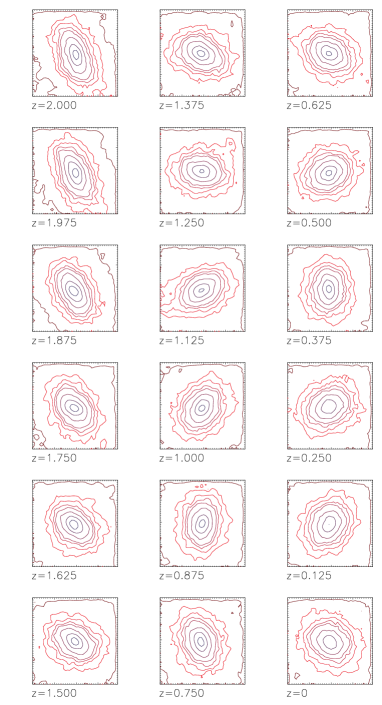
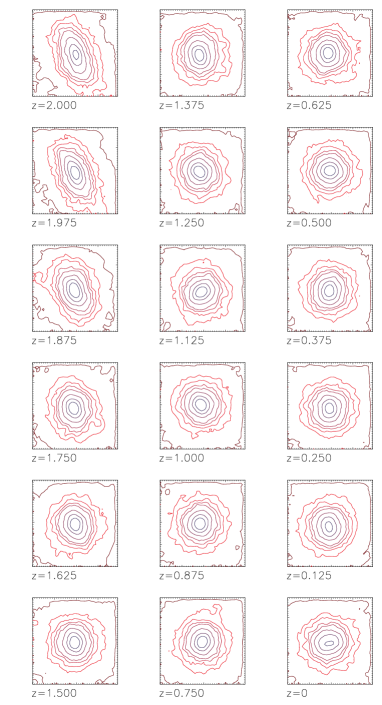
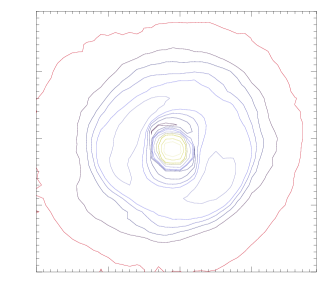
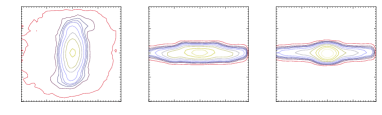
In Figs 1-8 we present the
isodensity contours of the old stars, gas and new stars for simulations in Table
1. All such figures have been built up with the same
box-size, number of levels, and density contrast (see caption of Fig.
1), as in Papers 1 and 2.
4.1 Morphologies
We will discuss first the bar features as far as the old star component is concerned. Fig.1 and Fig.2 show the evolution of this component from z=2 to z=0 for simulation c1 and c4. The bar feature is well defined since z=1.75 in both the cases. In the more massive case, the evolving bar becomes stronger and dominates the disk, whereas in the less massive case, the bar remains a central structure inside the disk, generating a bar-in-bar feature.
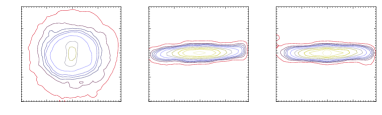
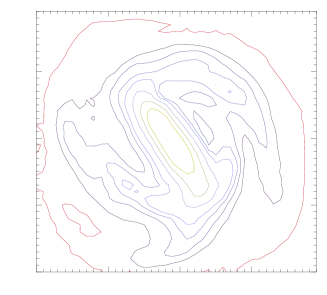
The strongest bar arises from simulation c1 (Fig. 3).
In this case, the ellipticity, evaluated through the isodensity plots, is higher (0.65) than the one measured in the purely stellar disk of the same mass (0.52, Paper 1), but slightly smaller than that measured in the case of a disk with the same mass and the same gas fraction (0.68, Paper 2). The enhancement of the stellar bar strength in comparison to the gas free case is due to the coupling of the gaseous component to the stellar one: the gaseous bar is indeed superimposed to the stellar one, as pointed out in Paper 2. However, this effect is slightly reduced by the star formation activity.


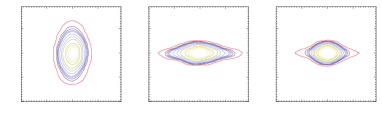


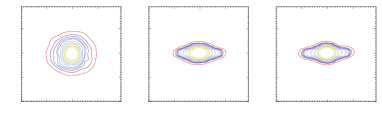
In the simulation c2, the
stars produce a barred feature, lasting until (Fig. 4).
This is an important difference with the case having the same gas fraction in
Paper 2, where the bar was decreasing its strength and disappearing at
.
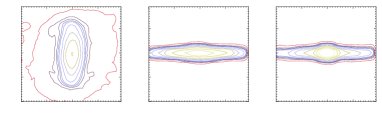
The same behaviour arises also in the c3 case (Fig. 5), which corresponds to a larger initial
gas fraction: the bar is living until the final redshift, whereas, without the
star formation, the bar was disappearing at .
The gas forms a bar since the beginning of the disk evolution and the new
stars originating from the gaseous component
assume an elongated structure which fuels the old stars bar
feature: the new stars are dynamically cold and they strongly feel the
resonances in the equatorial plane, where they are born.
In the simulations with
higher gas fractions, they are swept out in the central regions
by vertical resonances which results in the formation of a central young
bulge (Friedli & Benz 1995).
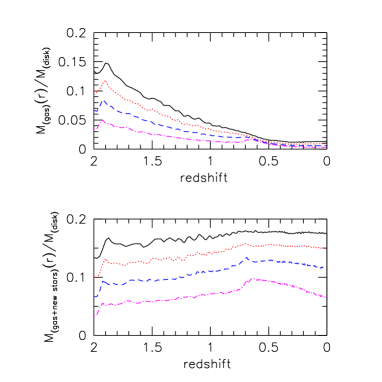
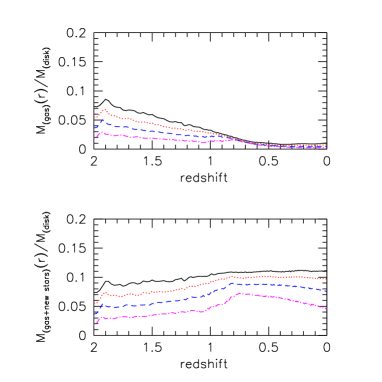
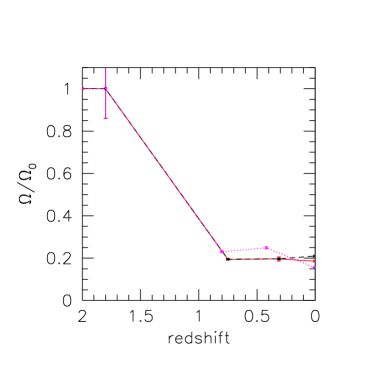
According to the claim of Berentzen et al. (1998), the growth of a gas mass concentration in the disk dissolves the regular orbits in the stellar bar. In Paper 2, we deduced a threshold value for the gas concentration inside a radius of 2 Kpc, 9%, able to destroy the bar in the more massive disks. If the star formation is included, it transforms the dissipative component into a non dissipative one and therefore the central concentration of the gas is lower. Fig. 9 and Fig. 10 show the evolution of the gas mass in the inner regions, i.e., of the gas concentration (upper panel), and that of the mass of gas plus new stars (lower panel) in the same regions, in simulations c2 and c3 respectively. In both these cases, the gas mass inside 2 kpc never overcomes the threshold value pointed out in Paper 2. However, the gas+new star concentration in simulation c3 overcomes this threshold value at z=0.6, without any consequence on the bar observed (Fig. 11).

This is because the effect of bar dissolution due to the central mass concentration cannot be achieved including the mass of new stars which are crossing the central region through elongated orbits and are not really concentrated as the gas. In the simulation c3 the gas shows more developed arms at z=1 than in the case c1 (Fig. 12).
But this feature, which is considered as a possible mechanism for the bar destruction has no impact on the bar in these new simulations (Bournaud et al. 2005).
A different discussion is devoted to the DM-dominated disks, which, as we already stressed in Paper 1 and 2, show bars which are not a classical product of the self-gravity or of angular momentum exchanges, but they are features that strongly depend on the dynamical state and evolution of the cosmological halo, and we did not observe their distruction even by an higher gas concentration.
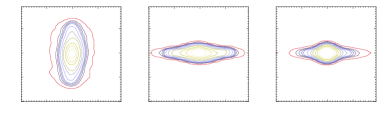
Old stars in simulation c4 show a stellar bar stronger than that
in the pure stellar disk of the same
mass (ellipticity 0.39 instead of 0.3, see Tab. 2 ) but weaker than
that arising from the simulation with the same disk mass and gas fraction
but without star formation (Paper 2).
Bar-in-bar features are present along the whole evolution (simulation c4)
until z=0 (Fig. 6).
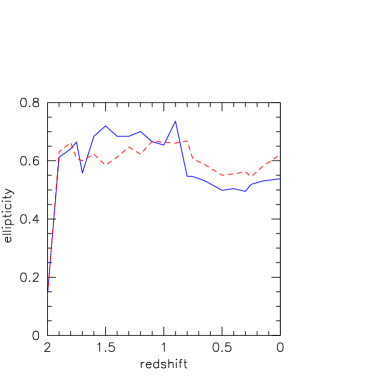
Simulations c5 and c6, which correspond to increasing gas
fractions, show
similar features during the system evolution. In this set of DM dominated
disk simulations, the final bar is increasing its
strength with the increasing gas fraction (Fig. 13, Tab. 1).
This trend is different from the one we observed in Paper 2, where
the increasing gas fraction produces an increase to a maximum and then a
decrease of the bar strength.
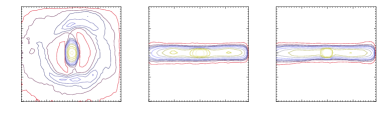
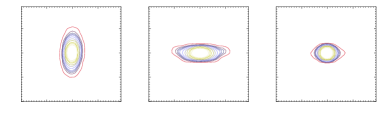
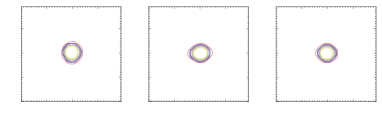
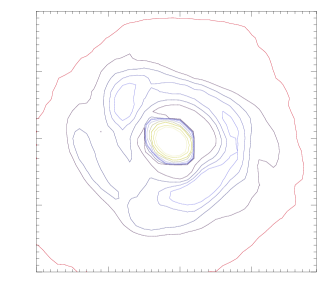
In DM dominated disks the bars in the old star component are the
imprint of the halo cosmological properties, as discussed in the previous
Papers. Fig. 14, shows the isodensity contours
of the halo in the plane of disk in the same frame, with the same
isodensity levels, and box sizes as those of the old stars in Fig. 1 and Fig.2.
The semimajor axis of the triaxial DM halo, for is both in phase with the
central bar of the disk and they have the same pattern speed.
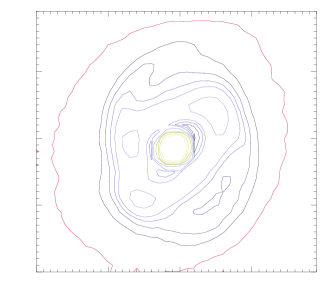
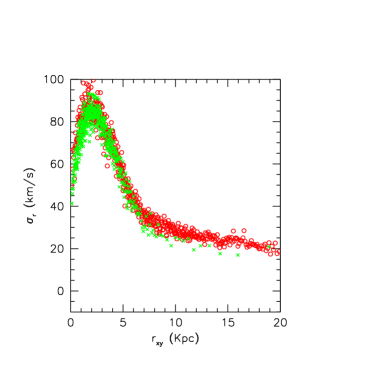
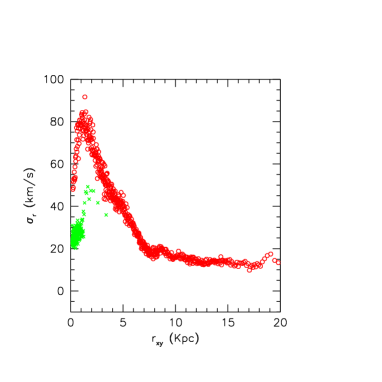
In the more massive disks (Fig. 15), the central DM region becomes more round, due to impact of the disk itself, and the coupling with the stellar bar disappears. Therefore, in the case of the lighter disks, the cosmological halo properties drive the formation of the bar, whereas in the more massive disks, the bar is a classical product of the disk instability. In the DM dominated disks the new stellar component produces a small spheroidal bulge which has a disky shape in the simulation c6. The gas component is confined in the central regions from the beginning of the evolution, and therefore the new stellar component arranges itself in a small spheroidal bulge. Therefore, in DM dominated disk, the new stars at z=0 have no bar features, at difference with more massive disks. We recall that, in DM dominated disks the bars are not due to classical resonances. So, the new stars do not feel these resonances whereas this is what happens in the cases of the more massive disks. The decoupling between new and old stars is depicted also by In Fig. 17 the distribution of radial velocity dispersions in a massive disk at z=1 is compared with the one in a DM dominated disk at the same redshift; in such a case the decoupling between new and old stars is well depicted. The radial velocity dispersion of this new star component is lower than that of the old stars. At the end of the evolution we therefore see a small bulge of new stars hiding a small nuclear bar of old stars. Such a nuclear bar remains, as observed in Papers 1 and 2 and stressed by Fig. 14, as a genuine product of the cosmology, since the light disks are classically below the instability threshold.
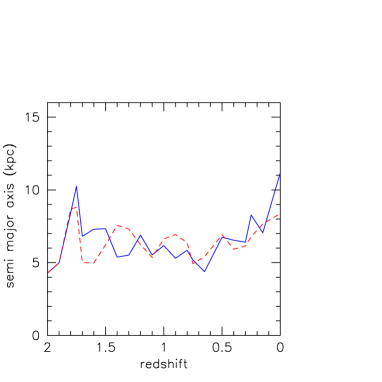
4.2 Bar pattern speed
The bar pattern speed, is the angular speed of the bar-like density wave as viewed from an inertial frame. Here, it is evaluated following the position angle of the major bar axis during the disk evolution, where the major axis is selected with the same criterium E1 quoted in Michel-Dansac & Wozniak (2006), namely as the radius where the ellipticity profile reaches a maximum as in Paper 2. The values of as function of the redshift for the more massive disks and the lighter disks are shown in Fig. 18 and Fig. 19 respectively.
For the more massive disks, we observe a decrease of in all the simulations. This is a different behaviour from the one observed in Paper 2: there we noticed an increase of the pattern speed coupled with the increasing gas fraction, since the gas presence both shortens the bar and decreases its ellipticity.
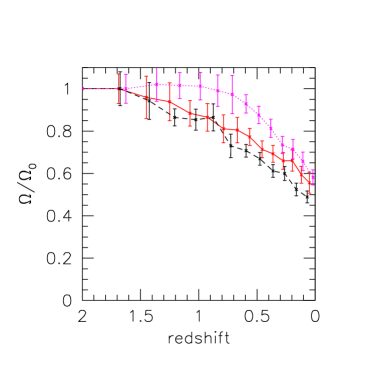
This mechanism is no longer working when the star formation is activated, since the ongoing star formation reduces the gas concentration in the central regions and the new stars arrange into an elongated structure which enforces also the length of the original bar (Fig. 20, see also the previous section).
For the DM dominated disks the evaluation of in this paper as in the previous ones, is done by referring to the angular velocity of the long-lived central bar. Its behaviour is the same as observed in Paper 2, namely it shows a fast decrease before redshift , and then a quasi stationary behaviour until redshift 0.
5 Discussion and conclusions
We presented six cosmological simulations with the same disk–to–halo mass ratios as in Paper 1 and Paper 2. In order to study the impact of the forming stars from the gaseous component, here we included and varied its percentages inside disks of different disk-to-halo mass ratios, as in Paper 2 where the star formation was switched off. In Table 2 we show the final data for ellipticities and semimajor axes resuming the results of our three papers.
The old star component show a long lasting bar, 10 Gyr old, in all the simulations of this work.
| Disk mass | gas fraction | no star formation | star formation | ||
|---|---|---|---|---|---|
| ellipticity | ellipticity | ||||
| 0.33 | 0. | 0.52 | 5 | - | - |
| 0.33 | 0.1 | 0.68 | 8.4 | 0.65 | 8 |
| 0.33 | 0.2 | 0.1 | no bar | 0.55 | 11 |
| 0.33 | 0.4 | 0.07 | no bar | 0.6 | 8.4 |
| 0.1 | 0. | 0.3 | 6.5 | - | - |
| 0.1 | 0.1 | 0.58 | 5.8 | 0.39 | 3 |
| 0.1 | 0.2 | 0.6 | 5.4 | 0.45 | 3 |
| 0.1 | 0.6 | 0.42 | 5.8 | 0.5 | 3 |
Moreover, in all such simulations, except for simulation c6, the bar is stronger than that developed in the pure stellar case with the same disk-to-halo mass ratio but weaker than that formed in the case of the same gas fraction without star formation.
We find that the star formation, reducing the central gaseous mass
concentration, allows the bar to survive until the end of the evolution
also in the more massive disks, at
variance with the results in Paper 2 (where the gas was not allowed to
form stars): in such a case a gas fraction 0.2 was able to destroy the
bar.
Even if some
details of the disk morphologies obviously depend on the star
formation prescription, the bars arising here in the c2 and c3
simulations are due to the
reduced central gas concentration and thus to the
weakening of its effect on the bar itself.
We verified this point by rerunning simulation c2 changing the star
formation prescription. Instead of the GADGET-2 effective model, we used a
simple algorithm in which, when a gas particle reaches a given density
threshold with a temperature lower than a minimum temperature threshold,
it is converted into a star particle, as in Katz et al. (1996). Fig. 21
shows the morphology of the old stellar component
for such a different star formation recipe:
the survival of the bar is due to the star formation, independently on
its details.
In all the simulations of more massive disks,
the new stellar component
shows a barred shape coupled with that of old stars but
with semimajor axis and ellipticity values smaller than those.
In all the simulations of DM dominated disks, a bar feature is maintained in the old stellar component at the disk center, and the new stars form a spheroidal bulge that hides the bar of the old stars. This effect could be of interest as far as the observations about the Milky Way are concerned where, in addition to the main bar, a small nuclear bar consisting of old stars seems to be included in the bulge (see e. g. Alard (2001)).
The final strenght of these old star bars increases by increasing gas fraction and their pattern speed is quickly decreasing before z.
The classical results obtained outside the cosmological scenario are no longer applicable. This conclusion remarks the results of Paper 1, where it was shown that in the DM dominated disks the bar feature is triggered and maintained by the cosmological properties of the halo (namely its triaxiality and its dynamical state).
From the models presented here we suggest that a very low pattern speed (few ) could be a signature of a dominating halo and not a classical product of the disk instability.
The whole set of cosmological simulations we presented here is suggesting that the star formation works in favour of maintaining the bar feature in self gravitating disks, against the effect of increasing gas fractions, whereas in DM dominated disks, it slightly reduces the bar strength. Moreover, inside such disks, the new stars are arranged in non barred systems which are decoupled from the bar of the old star component.
Acknowledgements Simulations have been performed on the CINECA IBM CLX Cluster, thanks to the INAF-CINECA grants cnato43a/inato003 “Evolution of disks in cosmological contests: effect of the star formation inside the disk”, and on the Linux PC Cluster of the Osservatorio Astronomico di Torino. We wish to thank V. Springel for kindly providing us with his code GADGET, and Martina Giovalli which implemented the simple star formation prescription in it. We thank the referee for his suggestions, useful to improve the paper.
References
- Alard (2001) Alard, C. 2001, A&A, 379, L44
- Avillez et al. (2000) Avillez, M. A., Ballesteros-Paredes, J., & Mac Low, M.-M. 2000, in Bulletin of the American Astronomical Society, Vol. 32, Bulletin of the American Astronomical Society, 711–+
- Berentzen et al. (1998) Berentzen, I., Heller, C. H., Shlosman, I., & Fricke, K. J. 1998, MNRAS, 300, 49
- Bett et al. (2007) Bett, P., Eke, V., Frenk, C. S., et al. 2007, MNRAS, 376, 215
- Bournaud et al. (2005) Bournaud, F., Combes, F., & Semelin, B. 2005, MNRAS, 364, L18
- Combes & Melchior (2002) Combes, F. & Melchior, A. L. 2002, Ap&SS, 281, 383
- Combes & Sanders (1981) Combes, F. & Sanders, R. H. 1981, A&A, 96, 164
- Curir et al. (2006) Curir, A., Mazzei, P., & Murante, G. 2006, A&A, 447, 453
- Curir et al. (2007) Curir, A., Mazzei, P., & Murante, G. 2007, ArXiv Astrophysics e-prints
- Friedli & Benz (1995) Friedli, D. & Benz, W. 1995, A&A, 301, 649
- Katz et al. (1996) Katz, N., Weinberg, D. H., & Hernquist, L. 1996, ApJS, 105, 19
- Klypin et al. (2001) Klypin, A., Kravtsov, A. V., Bullock, J. S., & Primack, J. R. 2001, ApJ, 554, 903
- Maller et al. (2002) Maller, A. H., Dekel, A., & Somerville, R. 2002, MNRAS, 329, 423
- Martinet & Friedli (1997) Martinet, L. & Friedli, D. 1997, A&A, 323, 363
- Mazzei & Curir (2001) Mazzei, P. & Curir, A. 2001, A&A, 372, 803
- Mazzei & Curir (2003) Mazzei, P. & Curir, A. 2003, ApJ, 591, 784
- Michel-Dansac & Wozniak (2006) Michel-Dansac, L. & Wozniak, H. 2006, A&A, 452, 97
- Navarro et al. (1996) Navarro, J. F., Frenk, C. S., & White, S. D. M. 1996, ApJ, 462, 563
- Navarro et al. (1997) Navarro, J. F., Frenk, C. S., & White, S. D. M. 1997, ApJ, 490, 493
- Press et al. (1986) Press, W. H., Flannery, B. P., & Teukolsky, S. A. 1986, Numerical recipes. The art of scientific computing (Cambridge: University Press, 1986)
- Robertson et al. (2004) Robertson, B., Yoshida, N., Springel, V., & Hernquist, L. 2004, ApJ, 606, 32
- Rosen & Bregman (1995) Rosen, A. & Bregman, J. N. 1995, ApJ, 440, 634
- Semelin & Combes (2002) Semelin, B. & Combes, F. 2002, A&A, 388, 826
- Springel (2005) Springel, V. 2005, MNRAS, 364, 1105
- Springel & Hernquist (2003) Springel, V. & Hernquist, L. 2003, MNRAS, 339, 289
- Tasker & Bryan (2006) Tasker, E. J. & Bryan, G. L. 2006, ApJ, 641, 878
- Wada (2001) Wada, K. 2001, ApJ, 559, L41
- Wada & Norman (2001) Wada, K. & Norman, C. A. 2001, ApJ, 547, 172
- Wechsler et al. (2002) Wechsler, R. H., Bullock, J. S., Primack, J. R., Kravtsov, A. V., & Dekel, A. 2002, ApJ, 568, 52