The embedded cluster DBSB 48 in the nebula Hoffleit 18: comparison with Trumpler 14
Abstract
We derive fundamental parameters of the embedded cluster DBSB 48 in the southern nebula Hoffleit 18 and the very young open cluster Trumpler 14, by means of deep JH infrared photometry. We build colour-magnitude and colour-colour diagrams to derive reddening and age, based on main sequence and pre-main sequence distributions. Radial stellar density profiles are used to study cluster structure and guide photometric diagram extractions. Field-star decontamination is applied to uncover the intrinsic cluster sequences in the diagrams. Ages are inferred from K-excess fractions. A prominent pre-main-sequence population is present in DBSB 48, and the K-excess fraction gives an age of Myr. A mean reddening of was found, corresponding to . The cluster CMD is consistent with the far kinematic distance of 5 kpc for Hoffleit 18. For Trumpler 14 we derived similar parameters as in previous studies in the optical, in particular an age of Myr. The fraction of stars with infrared excess in Trumpler 14 is . Despite the young ages, both clusters are described by a King profile with core radii pc and pc, respectively for DBSB 48 and Trumpler 14. Such cores are smaller than those of typical open clusters. Small cores are probably related to the cluster formation and/or parent molecular cloud fragmentation. In DBSB 48, the magnitude extent of the upper main sequence is mag, while in Trumpler 14 it is mag, consistent with the estimated ages.
keywords:
(Galaxy:) open clusters and associations: individual: DBSB 48 and Trumpler 14 - (ISM:) H II regions - ISM: individual: Hoffleit 18 and NGC 3372url]www.if.ufrgs.br/charles
1 Introduction
Infrared clusters represent a new class of objects, virtually undetectable before the 90’s (e.g. Deharveng et al. 1997; Hodapp 1994). Until recently, the number of known infrared clusters and stellar groups amounted to 276, as shown in the compilation by Bica et al (2005). A systematic survey by Dutra et al. (2003a) and Bica et al. (2003) in directions of nebulae using 2MASS111The Two Micron All Sky Survey, All Sky data release (Skrustskie et al., 1997), available at http://www.ipac.caltech.edu/2mass/releases/allsky/ revealed 346 new infrared embedded clusters and candidates. Thus, the systematic study of embedded clusters is fundamental to understand their nature, to probe the physical conditions associated to the early stages of star clusters, and to derive their fundamental parameters. Just to mention a few efforts in that direction, Serpens (Olmi, Testi, 2002), NGC 1333 (Warin et al., 1996), NGC 3576 (Persi et al., 1994), AFGL 5142 (Carpenter et al., 1993), and S 106 (Hodapp, Rayner, 1991).
Embedded clusters may provide the clues to better understand the formation and evolution processes of star clusters and their interaction with the parent molecular cloud. Colour-colour diagrams (2-CDs) allow identification of Pre-Main-Sequence (PMS) stars and can be used to distinguish them from Main Sequence (MS) and field stars (Carpenter et al. 1993; Lada, Lada 2003). Together with colour-magnitude diagrams (CMDs) they can be used to derive reddening values, reddening distribution, distance from the Sun and age. K-band infrared excesses originate mostly in dust envelopes and/or discs of PMS stars, and indicate their evolutionary stage up to Myr (Greaves 2005; Manoj, Bhatt 2005), or more (Bonatto et al., 2006a). K, and particularly L, excesses are sensitive to the presence of protoplanetary discs (Haisch et al. 2001a; Oliveira et al. 2004). Thus, these indicators allow dating very young star clusters (e.g. Lada et al. 1996; Soares, Bica 2003). In this context, it is important to increase the number of embedded clusters studied in detail in order to establish star-formation age spreads and constrain survival time-scales of dust envelopes and circumstellar discs.
Deriving locations of embedded clusters in the Galaxy by means of photometric and spectroscopic methods is useful, since these estimators might provide distances to be compared with the available kinematic ones of the nebulae (Georgelin, Georgelin 1976; Blitz et al. 1982). Embedded clusters are typically observed up to kpc from the Sun (Lada, Lada, 2003). In turn, these studies can be used to build the Galactic structure around the Sun, in particular to trace spiral arms. Improvement in distance determinations for clusters in all disc directions would contribute to the derivation of more reliable parameters of the rotation curve of the Galaxy. The rotation curve and spiral structure has been studied by Russeil (2003).
In this paper fundamental cluster parameters are derived using infrared photometry of the embedded cluster DBSB 48 and the young open cluster Trumpler 14.
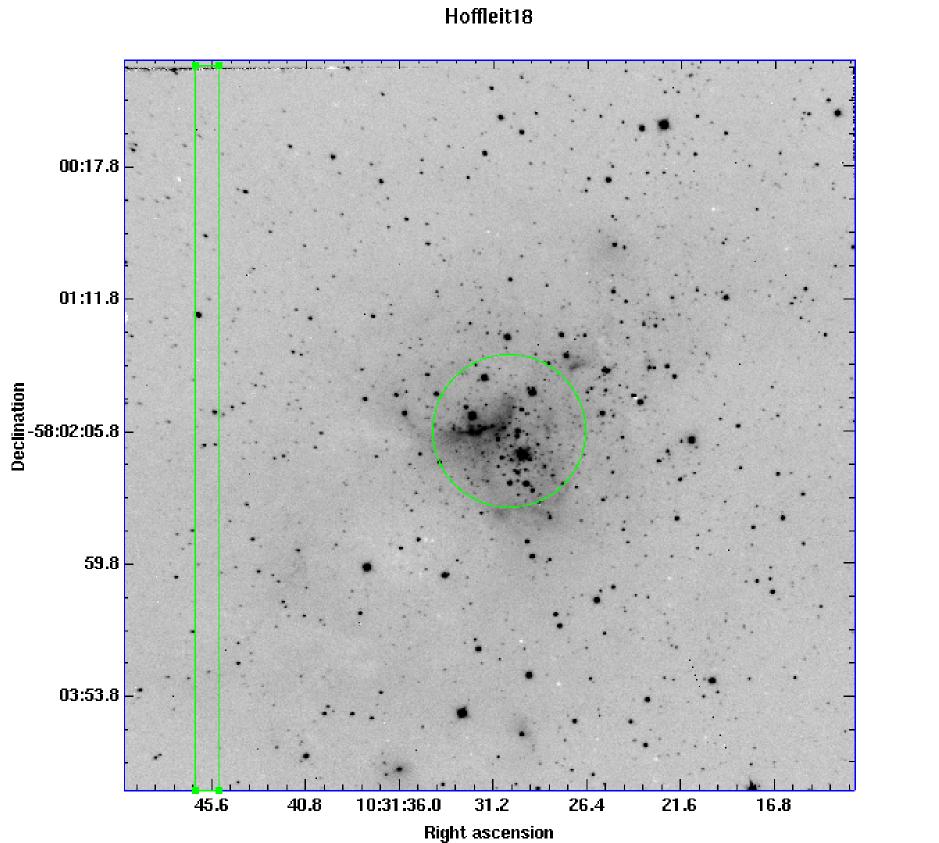
Hoffleit 18 is a southern nebula discovered by Hoffleit (1953). The cluster embedded in this nebula is Dutra, Bica, Soares, Barbuy 48 - DBSB 48 - (Dutra et al., 2003a), located at J2000 , (, ). The estimated diameter of the cluster is 1.5′.
The nebula Hoffleit 18 was also identified as a radio H II region designated G285.3+0.0 or G285.253-0.05. The derived radio velocity is , implying in this direction a near distance of 0.3 kpc and a far distance of 5.0 kpc. Given that the object is faint, the far distance should be the correct one, placing it in the Sagittarius-Carina arm (Caswell, Haynes, 1987). In the present paper we check the consistency of the CMD loci with the kinematic distance estimate.
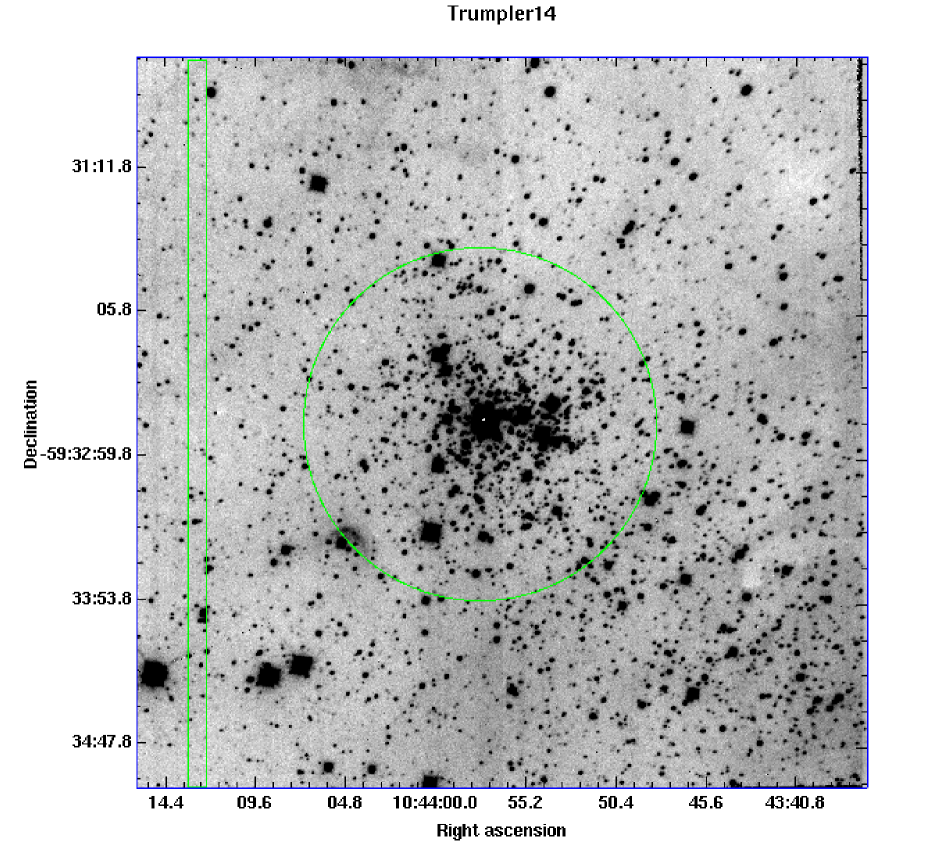
Trumpler 14 is usually classified as a young open cluster (Vázquez et al. 1996, and references therein). Besides, it is embedded in the nebula NGC 3372 () and its optical populous nature and environment properties make it an ideal object to be compared to a bona-fide embedded cluster such as DBSB 48. Trumpler 14 contains about 13 O stars, and is a relatively massive cluster, with a mass estimated to be around (Vázquez et al., 1996).
2 Observations and data reductions
The observations were carried out in 2003, May 17-18, using the SOFI Camera (Moorwood, Laby, Lidman, 1998) at the 3.55m New Technology Telescope (NTT) at ESO, La Silla. The detector was a HAWAII Rockwell HgCdTe with pixels, with a pixel size of m. We used the large field mode with a projected field of view of . The projected size of the pixel on the sky is 0.292′′. DBSB 48 was observed on the night of May 17. Total exposure times of 12 min in J and H, and 15 min in have been obtained in the cluster and background regions. The average seeing was in and bands, and in the band. Short exposures of 1.2 sec for a total of 60 sec were also taken in the three filters. Further details on observations, reductions and calibrations with this instrumentation can be found in Dutra et al. (2003b). The night was photometric and calibrations were obtained with 6 standard stars from Persson et al. (1998), and they were checked with 2MASS photometry. For the last filter the calibration was made in . For the photometric reductions the DAOPHOT code (Stetson, 1987) was used in IRAF environment.
Trumpler 14 was observed on May 18 for comparison purposes. The total exposure time on object and sky was 500 sec per band, plus multiple short exposures for a total of 60 sec per band. The average seeing was in and bands and in the band. Because the night was not photometric, the calibration was obtained via 2MASS photometry.
Fig. 1 shows a image of the cluster DBSB 48, where traces of the nebula Hoffleit 18 are seen, probably dominated by its reflection component in the infrared. In Fig. 2 the image of Trumpler 14 shows traces of emission from the Carina Nebula.
Photometric uncertainties from DAOPHOT, calculated from Poisson statistics, are provided in Table 1. The total photometric errors are larger because they also include uncertainties due to aperture correction, blends, non-linear pixels and flat field residuals. Below we include a brief description on the reduction and calibration of SOFI data. A detailed presentation can be found in Dutra et al. (2003b) and Momany et al. (2003).
The pre-reduction of SOFI data (dark-frame subtraction, sky subtraction and flat fielding) was performed following the steps given in the SOFI manual (Lidman et al. 2000). In the process of flat-fielding the illumination correction frames and the bad pixel maps, both available from the ESO web-pages, were used. SOFI is known to be linear up to about 5000 A.D.U. at a level of , showing a non-linearity at 13000-14000 A.D.U. In this sense, we note that our observing strategy (taking both shallow and deep exposures) of both clusters guaranteed that the raw science images (i.e. including the sky level) should not require linearity correction.
Compared with globular clusters, DBSB 48 and Hoffleit 18 are relatively non-crowded. Nevertheless, we made use of the DAOPHOT II and ALLFRAME (Stetson 1987, Stetson 1994) photometric reduction packages (designed for crowded fields). This ensured the derivation of PSF magnitudes for faint stars, even in the central regions of DBSB 48 and Hoffleit 18. It is important to note that our ALLFRAME reduction (which makes simultaneous use of the geometric and photometric information from all images) thus extends the range of magnitude and crowding conditions for which useful photometry is obtainable. Once the FIND and PHOT tasks were performed, we searched for isolated stars to build the PSF for each single image. The final PSF were generated with a PENNY function that had a quadratic dependence on position in the frame. The final instrumental photometric catalogue was constructed (using the DAOMASTER package) by scaling the shallow and deep magnitudes to a common photometric reference, and averaging the magnitudes for the stars in common. This catalogue contains PSF magnitudes, and these were converted into aperture magnitudes assuming that (Stetson 1987), where the constant is the aperture correction that we derived separately using bright isolated stars in the field.
The observation night of DBSB 48 was photometric and the photometric calibration was obtained using 6 standard stars from Persson et al. (1998). An independent check of our photometric calibration was obtained from a comparison with 2MASS photometry. This showed the presence of no systematic effects, and yielded differences among the brightest stars within for the magnitudes scales.
To assess the photometric errors and the completeness we performed artificial star experiments only for the DBSB 48 data set. Simulated stars were added to the sum image (used in ALLFRAME) by randomly distributing them around the nodes of a grid of triangles - a procedure well suited to prevent self-crowding (see also Momany et al. 2002). Stars were simulated at a fixed intermediate colour of (), and varying magnitudes. The frames (with the artificial stars) were then reduced and calibrated as done for the original images. The artificial stars experiments indicate that at we reach a photometric completeness level of .
For cluster analysis we applied a soft error filter to avoid the discrepant (mostly spurious) faint detections. Stars with errors larger than , and were discarded.
| J range | H range | range | |||
|---|---|---|---|---|---|
| J16 | 0.014 | H16 | 0.03 | 16 | 0.02 |
| 16J18 | 0.03 | 16H18 | 0.06 | 1618 | 0.09 |
| 18J19 | 0.09 | 18H19 | 0.17 | 1819 | 0.29 |
Data from short and long exposures were combined in order to increase the dynamical range of the photometry for both clusters. To do this we searched for a common set of stars in the CMD that minimises photometric errors and, at the same time, avoids saturation effects.
3 The cluster DBSB 48 in Hoffleit 18
3.1 Cluster structure
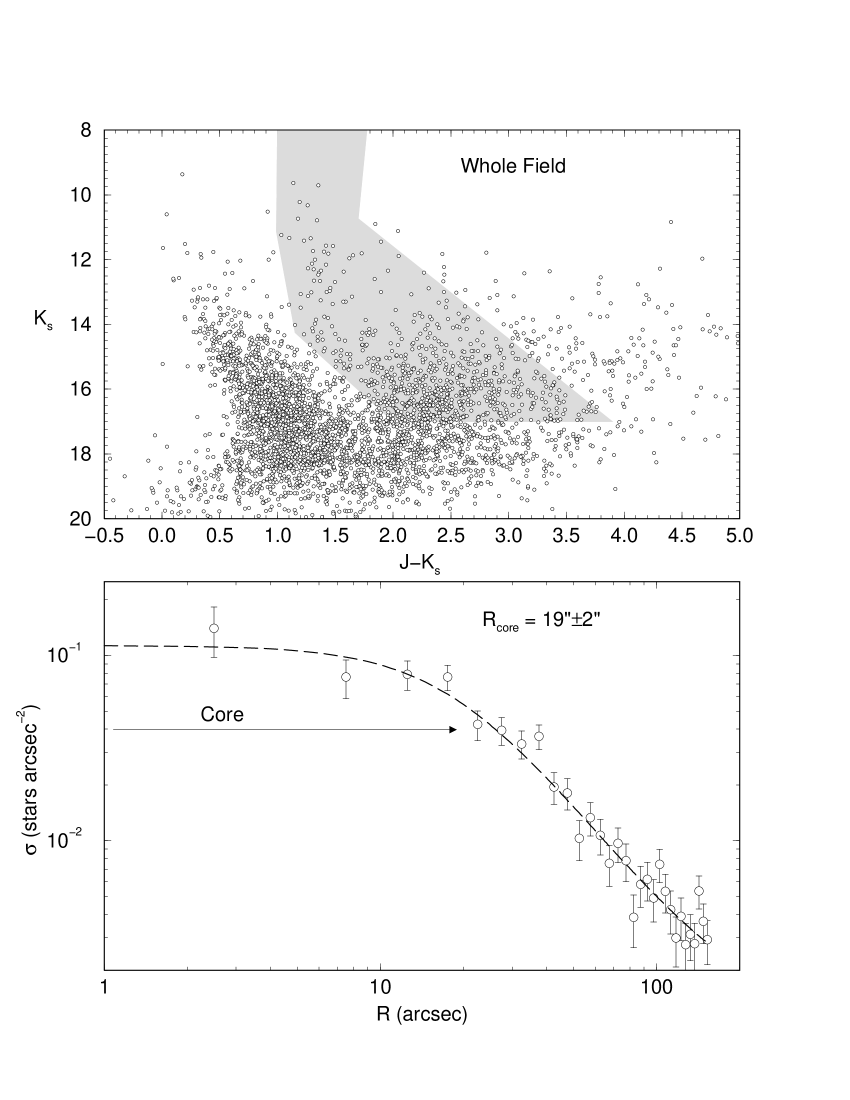
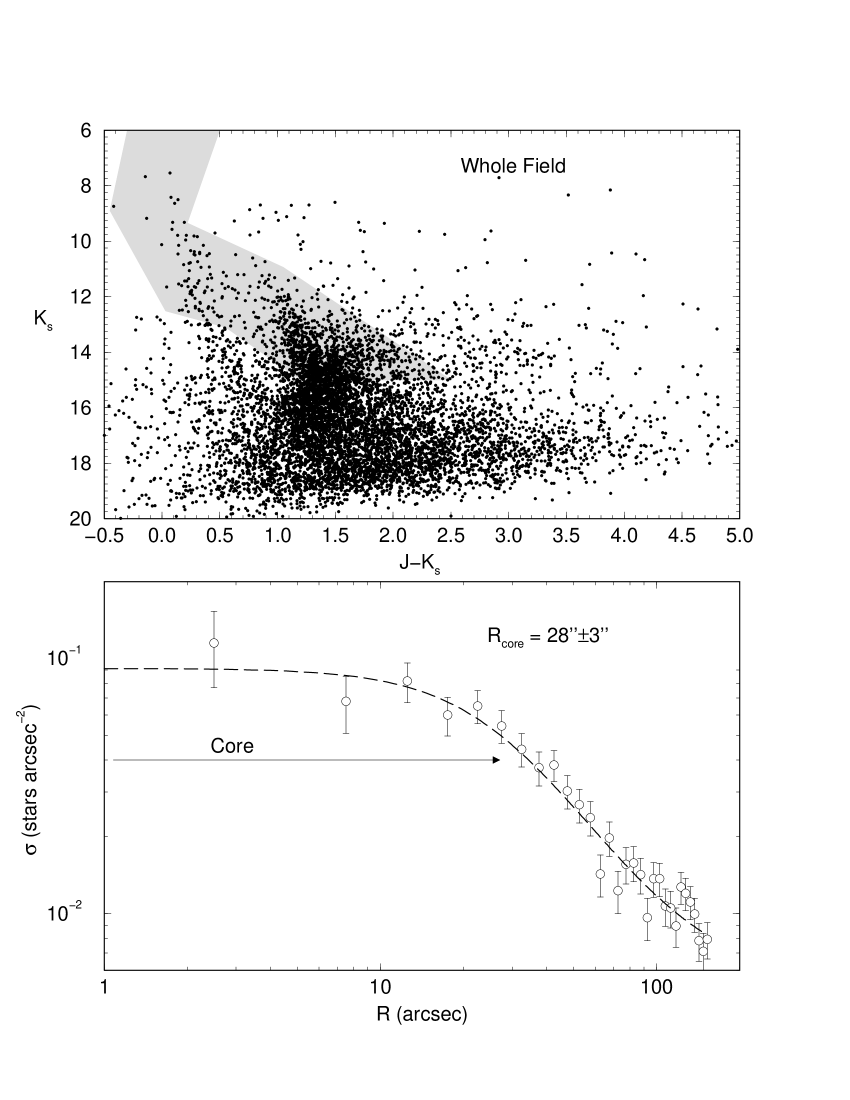
Fig. 3 (top panel) shows a whole field CMD of DBSB 48. Different extractions centred on DBSB 48 show that cluster sequences are more probably contained in the region marked off by the colour-magnitude filter (e.g. Bonatto, Bica 2007a; Bonatto, Bica 2007b) shown in the figure (see also the central extraction in panel (a) of Fig. 4). The colour-magnitude filter was designed based on the decontaminated photometry and the presence of O stars, see Sect. 3.2. A pronounced blue main sequence (mostly from the disc) is seen on the left side of the CMD (Fig. 3), and a considerable number of stars are seen to redder colours. Following e.g. Bonatto, Bica (2005) and Bonatto, Bica (2007a), we build the radial density profile (RDP) for stars with colours within the colour-magnitude filter. This procedure eliminates most of the stars with colours compatible with the field, which enhances cluster density profiles, especially in very crowded fields, as for the embedded open cluster NGC 6611 (Bonatto et al., 2006b). The resulting RDP is shown in the bottom panel of Fig. 3. Despite the cluster’s young age (Sect. 3.4.1), the RDP of DBSB 48 follows the two-parameter King (1966)222, which describes the central region of star clusters. surface density profile, with a core radius of . The cluster may extend at least to , since we are limited by frame dimensions. The similarity of the observed RDP with a King profile is no surprise for an embedded cluster, for instance, the radial distribution of stars in NGC 6611 ( Myr) also follows this law.
With the adopted distance of DBSB 48 (Sect. 3.4) the absolute core radius is pc, somewhat smaller than that derived for NGC 6611 (Bonatto et al., 2006b).
The RDP can be used to select spatial extractions that minimise CMD contamination. In the subsequent analysis we use the regions and (Fig. 4).
3.2 Field-star decontamination
To uncover the intrinsic cluster-CMD morphology we apply a field-star decontamination procedure. We take as comparison field the East border strip with dimension . This region is large enough to produce statistical representativity of field stars, both in magnitude and colours. This procedure was previously applied in the analysis of low-contrast (Bica, Bonatto, 2005), young embedded (Bonatto et al., 2006b), and young (Bonatto et al., 2006a) OCs.
The algorithm works on a statistical basis that takes into account the relative densities of stars in a cluster region and comparison field. It (i) divides the CMD in colour/magnitude cells of varying size, (ii) computes the expected surface density of field stars in each cell, assuming some uniformity throughout the cluster field, and finally (iii) subtracts the expected number of candidate field stars from each cell. Typical sizes of the colour/magnitude cells are and , which are wide enough to allow for a representative statistics and, at the same time, preserve the morphology of the CMD sequences. Because the remaining stars are in CMD cells where the stellar density presents a clear excess over the field, they have a high probability of being cluster members. Since field stars are taken from an external region of fixed area, corrections are made for the different solid angles of cluster and comparison field. To check consistency we apply the algorithm to the CMDs involving and , separately. As discussed in Bonatto, Bica (2007b), what is really critical for the decontamination algorithm - the cell size, in particular - is the differential reddening between cluster and field stars. Large gradients would require large cell sizes or, in extreme cases, would preclude application of the algorithm. However, the CMDs extracted from the cluster region and comparison field (Fig. 4) indicate that the differential reddening in the direction of DBSB 48, although present, is not excessively large. In any case, some residual contamination by very red field stars is expected to remain in the CMDs. A similar conclusion applies to Trumpler 14 (Fig. 9).
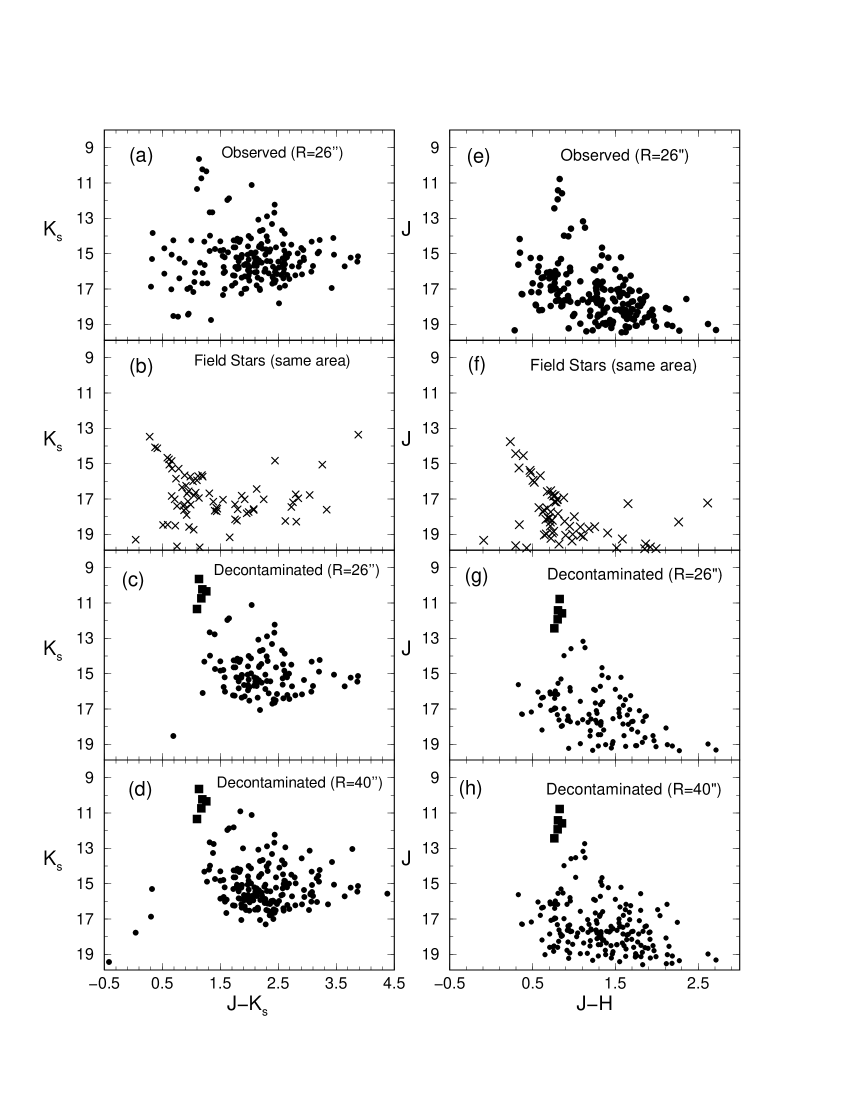
Fig. 4 (panel a) shows a CMD extraction of the region pixels (). This radius makes the CMD sequences clearer. In fact, compared to the whole field (Fig. 3, top panel) the disc MS stars becomes depleted with respect to that of the red sequence. This suggests that the cluster upper MS is present particularly around and . The fainter stars appear to define a populated distribution around and , however including a considerable contamination. In addition, stars extend to very red colours up to , which are mostly infrared excess stars (Sect. 3.4). In panel (b) we show field stars extracted at the frame edge with the same area as the extraction in panel (a). As expected, the blue sequence appears to be a field property. In panel (c) we show the decontaminated CMD, where the blue disc sequence vanishes, but a significant fraction of red stars remains, to be associated to PMS stars with and without infrared emission. For comparison purposes we also show in panel (d) the decontaminated CMD for the extraction , where the bright MS sequence remains unchanged. This CMD suggests that the MS is still developing, with the faintest stars at (Sect. 3.4.1). In panels (e) to (h) we show the counterpart CMDs. Basically the same conclusions apply, indicating that the CMD features are intrinsic.
3.3 Photometric diagrams
The 2-CD of the cluster DBSB 48 (Fig. 5), was built with the decontaminated photometry for . It can be used to identify PMS stars with and without K-excess emission and extract information for cluster parameter determination. The intrinsic MS and giant colours are from Schmidt-Kaler (1982), and the 1 Myr PMS track is from Siess et al. (2000). Reddening lines are from Kenyon, Hartmann (1995). The bluer line in corresponds to reddened M5 III stars, while the redder one to O V stars.
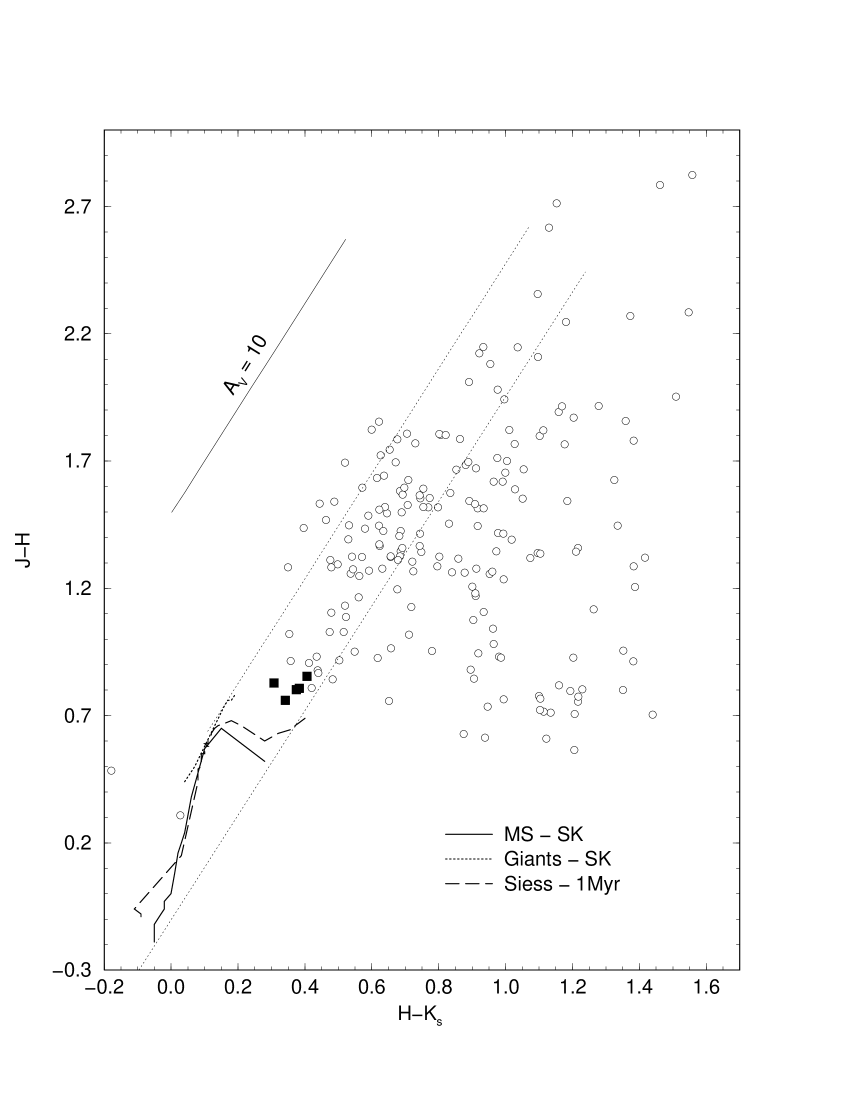
Reddening determination for upper MS stars is based on the ZAMS’s intrinsic sequence of early spectral types in the 2-CD (and CMD). For PMS stars it is measured taking as reference intrinsic T Tauri colours free of K-excess, at and (Strom et al. 1995; Soares et al. 2005). The probable PMS stars used for reddening calculations are those without K-excess found between the two reddening lines in Fig. 5. K-excess stars are those to the right of the MS reddening vector related to O stars, and are not used for reddening determination. Instead, they are used to constrain the cluster age (Sect 3.4.1).
Some of the stars follow the reddening vectors and are contained in the band defined in between them, and some show K excesses. Reddening is on average large. For the MS stars we derive a value of , converting to , and . The uncertainty in corresponds to the error of the mean. On the other hand, the spread in colour excess is corresponding to a range in absorption of .
3.4 Fundamental parameters
In Fig. 6 we show the decontaminated CMD for the extraction . The lack of observational constraints precludes a precise derivation of the distance from the Sun using the present data. In this case, we adopt the kinematical distance of the associated nebula Hoffleit 18, kpc (Caswell, Haynes, 1987) to set the distance modulus of the isochrones. The observed and absolute distance moduli are and . PMS tracks (Siess et al., 2000) with the ages 0.3, 0.5 and 4 Myr are used. Four probable turn on stars at basically coincide with the 0.3 Myr track. In the extraction (panel d of Fig. 4) this sequence is more populated.
We also analyse the 5 upper-MS stars in the context of distance estimate. The upper MS has a small magnitude extent of , implying a very early evolutionary state for DBSB 48. This extent remains unchanged on a larger extraction (panel d of Fig. 4). With the adopted reddening and kinematic distance, the brightest star in the upper MS has , comparable to of an O5V star in Binney, Merrifield 1998, and references therein. The presence of O stars is expected from ionisation in the nebula. Consequently, the spectral type of the other upper-MS stars would be around O8V, corresponding to an intrinsic . Alternatively, taking these upper-MS stars as indicators, a mean distance of kpc is implied, consistent with the adopted kinematic distance, within uncertainties.


Fig. 6 shows the youngest (4 Myr) available Padova isochrone (Girardi et al., 2002) set with the above parameters. MS and PMS tracks occupy consistent loci, considering that IR excesses affect a fraction of the PMS stars (Sect. 3.4.1).
Part of the small colour dispersion among the bright stars may be due to grain-destruction caused by the ionising stars. The colour range of the PMS candidates in the decontaminated photometry decreased to about 0.5 mag, thus within that of the PMS tracks distribution. This is not necessarily all due to differential reddening, since age dispersion among PMS stars is present.
The upper-MS is consistent with any Padova isochrone younger than Myr. However, the fact that we are dealing with an ionising nebula restricts the age to values younger than about 5 Myr. A more constrained age-range is provided by the PMS stars, which suggest the presence of ages from about 0.3 Myr to 4 Myr. These values suggest an intrinsic star formation age-spread.
To check the nature of the colour-dispersion in Fig. 6 (left panel) we isolate the stars with -excess in Fig. 5 and identify them on Fig. 6 (left panel). We conclude that most of the colour dispersion can be accounted for by -excess emission. In the right panel only stars without K-excess emission are shown. About 90% of the remaining stars are found close to the PMS tracks, which supports a star formation age-spread, and shows as well evidence of differential reddening.
Fig. 7 adds another dimension to the analysis by the inclusion of the H band, from which we conclude that the results are essentially the same. The isochrones were set with values similar to those in Fig. 6, and .
3.4.1 Age from K-excess fractions
The fraction of stars with K-excess emission correlates inversely with cluster age (e.g. Haisch et al. 2001b). On theoretical grounds it is estimated that because of disc-depleting processes such as irradiation by the central star, viscous accretion and mass loss due to outflow, the median lifetime of optically thick, inner accretion discs may be as short as Myr (Hillenbrand 2005). Observations indicate that significant fractions of stars younger than 1 Myr have already lost their discs. However, they also indicate that a small fraction of stars Myr old may retain their inner discs (e.g. Chen et al. 2005; Low et al. 2005). Similar conclusions were reached by Armitage et al. (2003) who found that of the stars in young clusters lose their discs in less than 1 Myr, while the remainder keep them for about Myr. Observational estimates of disc survival time-scales are important for planet formation theories (Brandner et al., 2000).
The observations of DBSB 48 (and Tr 14) were obtained with the filter. However, the difference between K and is negligible for our purposes (Dutra et al. 2003b; Persson et al. 1998). In fact, K and rarely differ more than 0.02 mag for red stars, the average difference being mag (Persson et al. 1998).
For DBSB 48 we quantify K-excess fractions by counting the number of stars with the H- colour redder than the OV/late dwarfs reddening vector in the decontaminated 2-CDs (Fig. 5). We adopted the extraction for the optimal cluster/field contrast. The resulting K-fraction is , where the uncertainty corresponds to Poisson fluctuation. Different extractions produce similar results. The K-excess fraction implies an age (Bonatto et al. 2006a and references therein; see also Soares, Bica 2003 and references therein) of Myr for DBSB 48. This suggests a cluster still in the process of developing the MS (Sect. 3.2).
4 Trumpler 14
4.1 Cluster structure
The full-frame CMD of Trumpler 14 (top panel of Fig. 8) shows the cluster’s colour-magnitude filter superimposed. Contamination by field stars smears cluster sequences, although the upper-MS can be seen for .
Similarly to DBSB 48 (Sect. 3) we built the radial density profile of Trumpler 14 (bottom panel of Fig. 8) after isolating stars with the respective colour-magnitude filter. King’s profile provides a core radius that together with the distance (Sect. 4.3) translates into pc. This core is smaller than those of DBSB 48 and NGC 6611 (Sect. 3.1), again suggesting a young age. Indeed, cluster expansion in the first few yr is expected to occur following the rapid expulsion of the unused gas by massive winds and supernovae (e.g. de la Fuente Marcos, de la Fuente Marcos 2002; Boily, Kroupa 2002; Goodwin, Bastian 2006). As a consequence, clusters expand in all scales as they reach for vitalisation. The cluster seems to extend beyond 100′′, which implies a limiting radius larger than pc.
4.2 Field-star decontamination
We apply the decontamination procedure (Sect. 3.2) to disentangle the intrinsic cluster-CMD morphology from field stars. To minimise the effects of crowding in the central parts we restricted the analysis to stars with DAOPHOT shape parameter333The DAOPHOT SHARP parameter is an image radius index which is greater than zero if the object is more extended than the expected stellar profile and less than zero when the detection appears sharper. The expected value for a point source is zero (Stetson & Harris 1988). .
Based on the cluster’s RDP (Fig. 8) we decontaminate the region that corresponds to an optimal cluster/field contrast. We take as comparison field the top, bottom, left and right border frame regions with 50′′ width. The observed CMD for this region (panel a of Fig. 9) is compared with the same-area field stars (panel b). The decontaminated CMD (panel c) presents MS and PMS sequences. The corresponding CMDs are shown in the right panels, where essentially the same features can be seen.

4.3 Fundamental parameters
Vázquez et al. (1996) with optical photometry obtained a mean reddening of (), a distance from the Sun kpc and an age Myr. From the age-spread of PMS tracks they concluded that star formation lasted about 5 Myr.
Fig. 10 (left panel) shows the decontaminated CMD of Trumpler 14 for the extraction (bottom panel of Fig. 9). The best-fit with the 4 Myr Padova isochrone was obtained for and , corresponding to , which converts to and . With these values the PMS star sequences are basically reproduced with tracks in the age range Myr (Fig. 10). These isochrones are set in the corresponding CMD (right panel) after applying the equivalent values of distance modulus and reddening. Both CMDs produce essentially the same results. Stars redder than the PMS tracks ( and ) are probably field ones not subtracted by the decontamination algorithm.
The present reddening value is somewhat larger than that derived by Vázquez et al. (1996) in the optical. This appears to be due to differential reddening, since we considered in our analysis a larger number of PMS stars. This is also seen in the Padova isochrone fit to the MS, which is shifted to the red. An alternative fit restricted to the upper MS provides a reddening .
The absolute distance modulus is , and the distance from the Sun kpc. The spectral type of the brightest star () basically corresponds to an O5V star, as expected from the spectral classification of the brightest stars (Vázquez et al., 1996).

Fig. 11 shows the 2-CD of Trumpler 14. The region occupied by K excess stars is much less populated than that of DBSB 48 (Fig. 5). By comparing the CMD and the 2-CD, we verify that the brighter PMS stars populate the region and , while the upper MS stars are concentrated in and . To further check the nature of the candidate-PMS stars we cross-identify them in Figs. 10 and 11. In Fig. 10 we select the stars in the expected PMS loci. These stars are superimposed on the 2-CD (Fig. 11) where they are tightly distributed, suggesting a common nature. Correcting their colours for (above) places them on the PMS track in the mass range . In this mass range the MS coincides with the PMS, however according to the CMDs in Fig. 10 we are effectively dealing with PMS stars. Un-subtracted field stars show up in this diagram for and .

For the optimal extraction of Trumpler 14 the K-fraction is . Similar fractions are obtained in different extractions. Following Bonatto et al. 2006a (and references therein), this K-excess fraction provides an age of Myr, which is in excellent agreement with the 1.5 Myr age derived in the optical (Vázquez et al., 1996). This is consistent with the upper-MS extent of Trumpler 14, and supports the short MS of DBSB 48.
5 Discussion and Conclusions
Before reaching the zero-age main sequence, stars are surrounded by optically thick material consisting of an infalling envelope and accretion disc that gradually disperse along the pre-main sequence phase. Because of disc-depleting processes such as irradiation by the central star, viscous accretion and mass loss due to outflow, the median lifetime of optically thick inner accretion discs may be as short as , with the final stages of disc accretion lasting as long as (Hillenbrand 2005). In addition, stars in young open clusters appear to form along some period of time (e.g. Sagar & Cannon 1995, and references therein). It is in this context that the analysis of stellar density structure and stellar-mass distribution in young star clusters is important.
In the present paper we studied DBSB 48, the cluster embedded in the H II region Hoffleit 18, by means of JH photometry, radial stellar density profiles and fraction of K-excess emission stars. Its properties were compared to those of the young open cluster Trumpler 14. Besides an important population of PMS stars of different ages, field-star decontamination shows that the MS has developed only the upper mass range, as expected from PMS contraction time-scales. The relatively short MS extent () of DBSB 48 reflects its younger age with respect to Trumpler 14 (). The upper MS extent appears to be an age indicator for well populated embedded clusters.
The loci of PMS stars in DBSB 48 are described by tracks with ages in the range Myr set in the CMD with reddening and absolute distance modulus . With a fraction of K-excess emission of the age of DBSB 48 results Myr. Its radial density profile is well represented by a King profile with a core radius pc.
For Trumpler 14 we derived pc. PMS stars are described by Myr tracks, consistent with the Myr age implied by .
The PMS age spread suggests that star formation in both clusters did not occur as an instantaneous event, instead it lasted a time equivalent to about the cluster ages.
The core radii of DBSB 48 and Trumpler 14 are similar to that of the embedded open cluster NGC 6611 and significantly smaller than those of classical open clusters (e.g. Bonatto, Bica 2005; Bonatto, Bica 2007a). This suggests that core formation is a process partly primordial, probably associated with parent molecular cloud fragmentation, and partly related to subsequent internal dynamical evolution.
acknowledgements
We thank the referee for helpful suggestions. We acknowledge partial financial support from the Brazilian agencies Fapesp and CNPq, and the Italian Ministero dell’Università e della Ricerca Scientifica e Tecnologica (MURST) under the program on ’Fasi iniziali di Evoluzione dell’Alone e del Bulge Galattico’.
References
- Armitage et al. (2003) Armitage, P.J., Clarke, C.J., Palla, F. 2003, MNRAS, 342, 1139
- Bica, Bonatto (2005) Bica, E., Bonatto, C. 2005, A&A, 443, 465
- Bica et al (2005) Bica, E., Dutra, C.M., Barbuy, B. 2003, A&A, 397, 177
- Bica et al. (2003) Bica, E., Dutra, C.M, Soares, J., Barbuy, B. 2003, A&A, 404, 223
- Binney, Merrifield (1998) Binney, J., Merrifield, M. 1998, in Galactic Astronomy, Princeton University Press, New Jersey, p. 107
- Blitz et al. (1982) Blitz, L., Fich, M., Stark, A.A. 1982, ApJS, 49, 183
- Boily, Kroupa (2002) Boily, C., Kroupa, P. 2002, in Modes of Star Formation and the Origin of Field Populations, E. Grebel, W. Brandner (eds), ASP Conference Series, 285, 141
- Bonatto, Bica (2005) Bonatto, C.J., Bica, E. 2005, A&A, 437, 483
- Bonatto, Bica (2007a) Bonatto, C.J., Bica, E. 2007a, A&A, 473, 445
- Bonatto, Bica (2007b) Bonatto, C.J., Bica, E. 2007b, MNRAS, 377, 1301
- Bonatto et al. (2006a) Bonatto, C.J., Bica, E., Ortolani, S., Barbuy, B. 2006a, A&A, 453, 121
- Bonatto et al. (2006b) Bonatto, C.J., Santos Jr., J.F.C., Bica, E. 2006b, A&A, 445, 567
- Brandner et al. (2000) Brandner, W., Zinnecker, H., Alcalá, J.M. et al. 2000, AJ, 120, 950
- Carpenter et al. (1993) Carpenter, J.M., Snell, R.L., Schloerb, F.P., Skrutskie, M.F. 1993, ApJ, 407, 657
- Caswell, Haynes (1987) Caswell, J.L., Haynes, R.F. 1987, A&A, 171, 261
- Chen et al. (2005) Chen, C.H., Jura, M., Gordon, K.D., Blaylock, M. 2005, ApJ, 623, 493
- Deharveng et al. (1997) Deharveng, L., Zavagno, A., Cruz-Gonzáles, I., Salas, L., Caplan, J., Carrasco, L. 1997, A&A, 317, 459
- Dutra et al. (2003a) Dutra, C.M., Bica, E., Soares, J., Barbuy, B. 2003a, A&A, 400, 533
- Dutra et al. (2003b) Dutra, C.M., Ortolani, S., Bica, E., Barbuy, B., Zoccali, M., Momany, Y. 2003b, A&A, 408, 127
- de la Fuente Marcos, de la Fuente Marcos (2002) de la Fuente Marcos, R., de la Fuente Marcos, C. 2002, ApSS, 280, 381
- Georgelin, Georgelin (1976) Georgelin, Y.-M., Georgelin, Y.-P. 1976, A&A, 49, 57
- Girardi et al. (2002) Girardi, L., Bertelli, G., Bressan, A., Chiosi, C., Groenewegen, M.A.T., Marigo, P., Salasnich, B., Weiss, A. 2002, A&A, 391, 195
- Goodwin, Bastian (2006) Goodwin, S.P., Bastian, N. 2006, MNRAS, 373, 752
- Greaves (2005) Greaves, J.S. 2005, Science, 307, 68
- Haisch et al. (2001a) Haisch, K.E. Jr., Lada, E.A., Lada, C.J. 2001a, AJ, 121, 2065
- Haisch et al. (2001b) Haisch, K.E. Jr., Lada, E.A., Lada, C.J. 2001b, ApJ, 553, L153
- Hillenbrand (2005) Hillenbrand, L.A. 2005, in A Decade of Discovery: Planets Around Other Stars, STScI Symposium Series 19, ed. M. Livio, in press (astro-ph/0511083)
- Hodapp (1994) Hodapp, K.-W. 1994, ApJS, 94, 615
- Hodapp, Rayner (1991) Hodapp, K.-W., Rayner, J. 1991, AJ, 102, 1108
- Hoffleit (1953) Hoffleit, D. 1953, AnHar, 119, 37
- Kenyon, Hartmann (1995) Kenyon, S.J., Hartmann, L. 1995, ApJS, 101, 117
- King (1966) King, I. 1966, AJ, 71, 64
- Lada, Lada (1991) Lada, C.J., Lada, E.A. 1991, in The formation and evolution of star clusters, Cambridge, USA, p. 3
- Lada, Lada (2003) Lada, C.J., Lada, E.A., 2003, ARA&A, 41, 57
- Lada et al. (1996) Lada, C.J., Alves, J., Lada, E.A. 1996, AJ, 111, 1964
- Lidman et al. (2000) Lidman, C., Cuby, J.-G., & Vanzi, L. 2000, in SOFI user’s manual, Doc. No. LSO-MAN-ESO-40100-0003, issue 13
- Low et al. (2005) Low, F.J., Smith, P.S., Werner, M., Chen, C.H., Krause, V., Jura, M., Hines, D.C. 2005, ApJ, 631, 1170
- Manoj, Bhatt (2005) Manoj, P., Bhatt, H.C. 2005, A&A, 429, 525
- Momany et al. (2002) Momany, Y., Held, E.V., Saviane, I., & Rizzi, L. 2002, A&A, 384, 393
- Momany et al. (2003) Momany, Y., et al. 2003, A&A, 402, 607
- Moorwood, Laby, Lidman (1998) Moorwood, A., Laby, J.G., Lidman, C., 1998. The Messenger 91, 8
- Oliveira et al. (2004) Oliveira, J.M., Jeffries, R.D., van Loon, J. Th. 2004, MNRAS, 347, 1327
- Olmi, Testi (2002) Olmi, L., Testi, L. 2002, A&A, 392, 1053
- Persi et al. (1994) Persi, P., Roth, M., Tapia, M., Ferrari-Toniolo, M., Marenzi, A.R. 1994, A&A, 282, 474
- Persson et al. (1998) Persson, S.E., Murphy, D.C., Krzeminski, W., Roth, M., Rieke, M.J., 1998, AJ, 116, 2475
- Russeil (2003) Russeil, D. 2003, A&A, 397, 133
- Sagar & Cannon (1995) Sagar, R. & Cannon, R.D. 1995, A&AS, 111, 75
- Schmidt-Kaler (1982) Schmidt-Kaler, T. 1982, in Landolt-Börnstein, New Ser., Group VI, vol.2b (Springer-Verlag, Berlin), 1
- Siess et al. (2000) Siess, L., Dufour, E., Forestini, M. 2000, A&A, 358, 593
- Skrustskie et al. (1997) Skrutskie, M., Schneider, S.E., Stiening, R., et al. 1997, in The Impact of Large Scale Near-IR Sky Surveys, ed. Garzon et al., Kluwer (Netherlands), 210, 187
- Soares, Bica (2003) Soares, J.B., Bica, E. 2003, A&A, 404, 217
- Soares et al. (2005) Soares, J.B., Bica, E., Ahumada, A.V., Clariá, J.J. 2005, A&A, 430, 987
- Stetson (1987) Stetson, P.B. 1987, PASP, 99, 191
- Stetson (1994) Stetson, P.B. 1994, PASP, 106, 250
- Stetson & Harris (1988) Stetson, P.B., & Harris, W E. 1988, AJ, 96, 909
- Strom et al. (1995) Strom, K.M., Kepner, J., Strom, S.E. 1995, ApJ, 438, 813
- Vázquez et al. (1996) Vázquez, R.A., Baume, G.L., Feinstein, C., Prado, P. A&AS, 116, 75
- Warin et al. (1996) Warin, S., Castets, A., Langer, W.D., Wilson, R.W., Pagani, L. 1996, A&A, 306, 935