11email: antonio.sollima@oabo.inaf.it (AS) 22institutetext: INAF Osservatorio Astronomico di Bologna, via Ranzani 1, Bologna, 40127-I, Italy
A Correlation between Blue Straggler and Binary Fractions in the core of Galactic Globular Clusters††thanks: Based on ACS observations collected with the Hubble Space Telescope within the observing program GO 10775.
Abstract
Context. Blue Stragglers Stars (BSSs) are thought to form in globular clusters by two main formation channels: mergers induced by stellar collisions and coalescence or mass-transfer between companions in binary systems. The detailed study of the BSS properties is therefore crucial for understanding the binary evolution mechanisms, and the complex interplay between dynamics and stellar evolution in dense stellar systems.
Aims. We present the first comparison between the BSS specific frequency and the binary fraction in the core of a sample of Galactic globular clusters, with the aim of investigating the relative efficiency of the two proposed formation mechanisms.
Methods. We derived the frequency of BSSs in the core of thirteen low-density Galactic globular clusters by using deep ACS@HST observations and investigated its correlation with the binary fraction and various other cluster parameters.
Results. We observed a correlation between the BSS specific frequency and the binary fraction. The significance of the correlation increases by including a further dependence on the cluster central velocity dispersion.
Conclusions. We conclude that the unperturbed evolution of primordial binaries could be the dominant BSS formation process, at least in low-density environments.
Key Words.:
Techniques: photometric – binaries: general – blue stragglers – Stars: Population II – globular cluster: general1 Introduction
Blue Straggler Stars (BSSs) are objects that, in the color-magnitude diagram (CMD) of evolved stellar populations, lie along an extension of the Main Sequence (MS), in a region which is brighter and bluer than the Turn-off (TO). First discovered by Sandage (1953) in M3, they have been observed in all Galactic globular clusters (GCs; Piotto et al. 2004), in the field population (Carney et al. 2005), and in dwarf galaxies of the local group (Momany et al. 2007).
Their location in the CMD suggests that BSSs have masses of , significantly larger than those of normal stars in old stellar systems (like GCs). Thus, they are thought to have increased their mass during their evolution. Two mechanisms have been proposed for their formation: the merger of two stars induced by stellar collision (COL-BSSs; Hills & Day 1976) and coalescence or mass-transfer between two companions in a binary system (MT-BSSs; McCrea 1964). The two formation channels are thought to act with different efficiencies according to the cluster structural parameters (Fusi Pecci et al. 1992) and they can work simultaneously within the same cluster in different radial regions, corresponding to widely different stellar densities (Ferraro et al. 1997; Mapelli et al. 2006). Indeed, collisions are more frequent in the central region of GCs, because of the high stellar density, while MT-BSSs mainly populate the cluster periphery, where binary systems can more easily evolve in isolation without suffering exchange or ionization due to gravitational encounters. The whole scenario is further complicated by the cluster dynamical evolution that leads massive systems (like binaries and BSSs) to sink toward the cluster center in a time-scale comparable to the cluster relaxation time.
A possible tool for distinguishing COL-BSSs from MT-BSSs is based on high-resolution spectroscopic analysis. In fact, anomalous chemical abundances are expected at the surface of BSSs resulting from mass-transfer activity (Sarna & de Greve 1996), while they are not predicted for COL-BSSs (Lombardi et al. 1995). However, such studies have just become feasible and they are limited to only a small number of BSSs in just one cluster (47 Tucanae; Ferraro et al. 2006).
As an alternative way for getting insights on the relative efficiency of the two formation mechanisms, here we investigate possible correlations between the BSS population and the host cluster properties.
2 Observations and Data Reduction
The photometric database considered here is the same used in Sollima et al. (2007; hereafter S07) for measuring the frequency of binary systems in the core of thirteen low-density Galactic GCs. It consists of a set of high-resolution images, obtained with the ACS on board HST, through the F606W () and F814W () filters. As described in S07, the target clusters are characterized by high Galactic latitude (), low reddening () and low projected central density (, where is in units of ). These selection criteria have been chosen in order to limit the effects of field contamination, differential reddening and crowding on the determination of the binary fractions. The selected target clusters and their main physical parameters are listed in Table 1. The central luminosity density and the absolute band magnitude are from Djorgovski (1993), the age is from Salaris & Weiss (2002)111Since NGC 6981 is not included in the list of Salaris & Weiss (2002), we converted the ages measured by De Angeli et al. (2005) into the Salaris & Weiss (2002) scale., and the projected central velocity dispersion is from McLaughlin & Van der Marel (2005). A detailed description of the data reduction and calibration procedure can be found in S07 together with the resulting CMDs for all the target clusters.
As discussed in S07, the binary sequence is well defined and distinguishable from the MS and the fraction of binary systems () found within the cluster core radius ranges from about 10 to (the value of are listed in Table 1). Moreover, a number of BSSs populating the bright part of the CMD is also evident in the data sample. In the following section we describe the adopted procedure to derive the BSS frequencies in the core of the target clusters.
3 BSS population selection
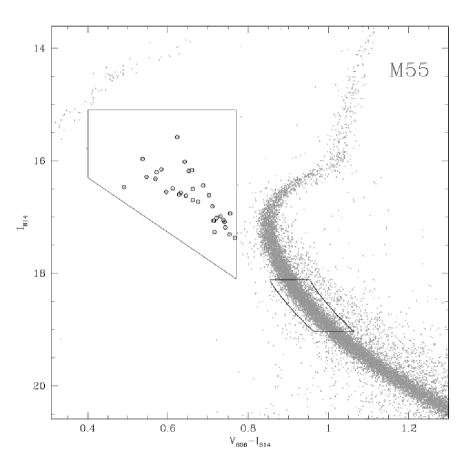
Our primary criterion for the definition of the BSS sample is based on the location of stars in the () CMD. Since the considered GCs have different distances, reddening, ages and metallicities, in order to define a homogeneous criterion for the BSS selection, we shifted in magnitude and color the CMD of each cluster to match that of M55 (see also Ferraro et al. 1995). For minimizing the contamination from sub-giant branch, horizontal branch (HB) and field stars, we limited the analysis to colors bluer than and magnitudes in the range . The adopted BSS selection box (the same for all clusters) is shown in Figure 1 and the number of selected BSSs () in each target cluster is reported in Table 1.
In order to compare the frequency of BSSs in different GCs, the size of the total cluster population must be taken into consideration. Commonly, the number of BSSs is normalized to the number of stars belonging to a given evolutive sequence (usually the HB, or the Red Giant Branch, RGB; Ferraro et al. 1995; Piotto et al. 2004; Leigh et al. 2007). Unfortunately, in some clusters of our sample the number of HB and RGB stars is very small, which would make the derived BSS frequency highly uncertain. We therefore normalized the number of selected BSSs, to the number of MS stars () in the magnitude range and with colors comprised within from the cluster MS mean ridge line. Stars in this magnitude range are bright enough to have the same completeness level of BSSs () and cover a similar mass range in all clusters: following the theoretical stellar isochrones by Cariulo et al. (2004) and taking into account the differences in age and metallicities among the selected GCs, the TO mass varies between . Hence, we considered a good indicator of the size of the sampled cluster population.
The possible effect of background and foreground field star contamination on the BSS and MS selections has been estimated by using the Galaxy model of Robin et al. (2003). For this purpose a synthetic catalog covering an area of 0.5 square degree centered on each cluster (with the centers taken from Djorgovski & Meylan 1993) has been retrieved, both in the and the Johnson-Cousin bands. A sub-sample of stars scaled to the size of the ACS field of view () has been randomly extracted, and the Johnson-Cousin magnitudes have been converted into the ACS photometric system by using the transformations of Sirianni et al. (2005). The number of contaminating field stars turns out to be neglegible (2) in all the clusters of our sample. Then, we counted the number of field stars included in the BSS and MS selection boxes ( and , respectively), and we computed the BSS specific frequency as:
| (1) |
The resulting values for the thirteen target clusters are listed in Table 1. In order to check the suitability of the adopted normalization criterion, we compared the derived BSS specific frequencies with those measured by Leigh et al. (2007, and uptdated by Sills 2008, private communication) for the four clusters in common with our sample (namely, NGC 4590, NGC 6362, NGC 6723 and NGC 6981). These authors normalized the number of BSSs in the cluster cores to that of red giant branch stars in the same magnitude range. In spite of the different normalization criterion, the specific frequencies calculated for the four clusters in common correlate very well (with a correlation coefficient ).
| Name | |||||||
|---|---|---|---|---|---|---|---|
| Gyr | Km s-1 | % | % | ||||
| NGC 288 | 1.80 | -6.63 | 11.3 | 2.79 | 11.6 | 43 | 1.9 |
| NGC 4590 | 2.52 | -7.73 | 11.2 | 3.59 | 14.2 | 62 | 1.5 |
| NGC 5053 | 0.51 | -7.07 | 10.8 | 1.79 | 11.0 | 15 | 1.0 |
| NGC 5466 | 0.68 | -6.83 | 12.2 | 1.86 | 9.5 | 39 | 1.7 |
| NGC 5897 | 1.32 | -7.27 | 12.3 | 2.94 | 13.2 | 53 | 1.3 |
| NGC 6101 | 1.57 | -6.82 | 10.7 | 2.91 | 15.6 | 60 | 1.1 |
| NGC 6362 | 2.23 | -6.69 | 11.0 | 3.83 | 11.8 | 42 | 1.5 |
| NGC 6723 | 2.71 | -7.95 | 11.6 | 5.52 | 16.1 | 35 | 0.5 |
| NGC 6981 | 2.26 | -7.16 | 9.5 | 3.66 | 28.1 | 65 | 1.5 |
| M55 | 2.12 | -7.47 | 12.3 | 3.73 | 9.6 | 32 | 0.8 |
| Arp 2 | -0.35 | -5.30 | 9.7 | 0.72 | 32.9 | 33 | 2.3 |
| Terzan 7 | 1.97 | -5.99 | 7.4 | 2.55 | 50.9 | 33 | 3.4 |
| Palomar 12 | 0.68 | -4.78 | 6.4 | 0.76 | 40.8 | 9 | 2.5 |
4 Correlations between BSS specific frequency and cluster parameters
With the aim of shading light on the BSS formation mechanisms, we correlated the BSS specific frequency () calculated above with the core binary fraction () obtained by S07 and with various other physical parameters of the thirteen GCs of the sample. In particular, we searched for possible correlations with the cluster central density, total magnitude, age, and central velocity dispersion (see Table 1), as well as with the stellar collision rate (defined as ; Pooley & Hut 2006), the global metallicity ([M/H], from Ferraro et al. 1999222For NGC 6101, NGC 6362, NGC 6723 and Palomar 12 not included in the list of Ferraro et al. (1999) we transformed the metallicity [Fe/H] from Zinn & West (1984) into the global metallicity [M/H] following the prescriptions of Ferraro et al. (1999).), the cluster evaporation rate (, from Gnedin & Ostriker 1997), concentration (, from Trager et al. 1995), half-mass relaxation time () and half-mass radius (, from Djorgovski 1993).
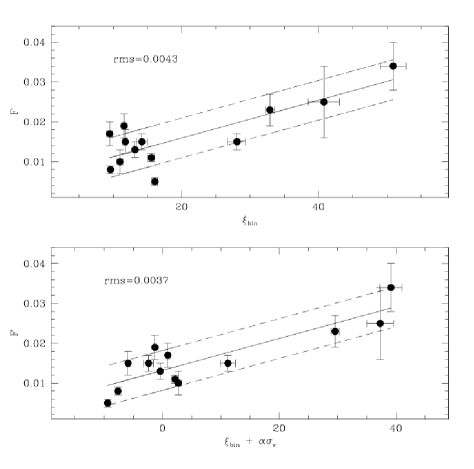
The Pearson’s linear correlation coefficients and confidence levels for the considered parameter pairs are listed in Table 2. The strongest correlation is found between the BSS specific frequency and the binary fraction. A noticeable correlation with the absolute magnitude and anticorrelations with the cluster age and central velocity dispersion are also apparent. Considering that the age estimates are quite uncertain and span a narrow range of values in our sample, any firm conclusion about the possible dependence of on the cluster age is premature at the moment. However, if confirmed, such an anticorrelation might be a consequence of the analogous anticorrelation between binary fraction and age already discussed by S07, and would suggest that binary disruption processes in the core of GCs become more efficient with time, thus reducing the fraction of both binaries and BSS in the core of the oldest clusters (as suggested by Ivanova et al. 2005, but at odds with Hurley et al. 2007). In any case, even if the anticorrelation between (or ) and is not confirmed, the correlation between the BSS specific frequency and the binary fraction still holds. The latter is shown in the upper panel of Figure 2 and it suggests that the main formation channel of BSS in these clusters is the unperturbed evolution of primordial binary systems.
We stress that, since the considered parameters do not constitute an orthonormal basis, most of the less significant correlations could be artificially induced by primary correlations among other parameters. In order to investigate the possible dependence of on more than one cluster parameter, we applied the Bayesian Information Criterion (BIC) test (Schwarz 1978) to our dataset. We assumed the BSS specific frequency to be a linear combination of a sub-sample of parameters () selected among those listed above:
| (2) |
and we calculated the quantity
| (3) |
where is the likelihood and is the dimension of the sample ( in our case). The likelihood is calculated as , where
| (4) |
with being the BSS fraction of cluster , and being the residual of the fit. The parameters that maximize the quantity are the most probable correlators with . For our dataset the maximum value of is obtained with , and . The correlation between , and is shown in Figure 2, together with the best fit line. All the other 3-variate or higher-order correlations turn out to be non-significant.
A note of caution is worth: as can be seen, these correlations are essentially due to the four clusters (namely Terzan 7, Palomar 12, Arp 2 and NGC 6981) with the largest () binary fraction, while the other GCs in our sample define a group with an average binary content and a BSS frequency . In particular, all the correlations that we have found are mainly driven by Terzan 7, Palomar 12 and Arp 2, which are the GCs not only with the largest binary and BSS fractions, but also with the lowest absolute magnitudes and the lowest ages. These three clusters are also the most distant from the Sun and they are thought to belong to the Sagittarius Stream (Bellazzini et. al 2003). Thus, they might be stellar systems with intrinsically different origins and properties, and the correlations found here might not be appropriate for the overall class of ”genuine” Galactic GCs (GGCs). By excluding these three clusters from the sample, the anticorrelation with the total luminosity still holds (even if with lower significance), in agreement with what already found by Piotto et al. (2004), Sandquist (2005) and Leigh et al. (2007) for larger samples of GCs with different characteristics, and for BSS populations selected and normalized with different criteria. Instead, the anticorrelation with the age disappears, thus bringing our results in agreement with those of Leigh et al. (2007; see also De Marchi et al. 2006). The correlation between the BSS and the binary fractions also disappears excluding the three ”Sagittarius” clusters (SgrGCs), with the range in spanned by the remaining sample being very small. Note however that both the average BSS and binary frequencies are higher in SgrGCs ( and ) than in GGCs ( and ). Thus, even assuming that SgrGCs were born with different initial conditions from GGCs, the observational facts presented here allow to draw (at least) the ”conservative” conclusion that binary-rich enviroments tend to produce more BSS in the low-density cluster regime (where collisions are expected to play a minor role in the formation/destruction of binaries).
| Parameter | P | |
|---|---|---|
| 0.820 | 0.9998 | |
| 0.774 | 0.9985 | |
| -0.758 | 0.998 | |
| -0.594 | 0.98 | |
| 0.403 | 0.92 | |
| -0.311 | 0.85 | |
| 0.299 | 0.84 | |
| -0.158 | ||
| 0.129 | ||
| 0.099 | ||
| 0.020 |
5 Conclusions
We measured the BSS specific frequency in the core of thirteen low-density Galactic GCs and investigated its correlation with different dynamical and general cluster parameters. We found evidences that, at least in this density regime, binary-rich environments are more efficient in producing BSS. No correlations have been found with the cluster central density, concentration, stellar collision rate, and half-mass relaxation time, in agreement with the results of Piotto et al. (2004) and Leigh et al. (2007). These evidences indicate that the collisional channel for the BSS formation has a very small efficiency in low-density GCs, while the mechanisms involving the unperturbed evolution of binary systems are dominant.
The higher significance of the trivariate correlation among the BSS frequency, the binary fractions and the cluster velocity dispersion, indicates that, for a given binary fraction, the BSS specific frequency decreases with increasing velocity dispersion. This finding might be connected with the effect of the cluster velocity dispersion in the dynamical evolution of binary systems. In fact, a small cluster velocity dispersion corresponds to a lower energy limit between soft and hard binaries333A binary is defined soft (hard) if its binding energy (, with being the orbital separation of the two components) is smaller (larger) than the mean kinetic energy of normal cluster stars (, with being the average mass of cluster stars)., i.e., to a larger fraction of hard binary systems. Since the natural evolution of hard binaries is to increase their binding energy (i.e. decrease their orbital separation; Heggie 1975), this implies that low velocity dispersion GCs should host a larger fraction of hard (and close) binaries, able to both survive possible stellar encounters, and activate mass-transfer and/or merging processes between the companions. A larger fraction of BSSs formed by the evolution of primordial binaries is therefore expected in lower velocity dispersion GCs (see also Davies et al. 2004). Such an effect of (in terms of both hardening and shrinking the binary systems) might be, in turn, at the origin of the inverse correlation between the BSS frequency and the cluster total luminosity (mass) observed in open clusters (De Marchi et al. 2006), low density GCs (Sandquist 2005), as well as high density GCs (Piotto et al. 2004; Leigh et al. 2007). Indeed, the more massive GCs have larger central velocity dispersions (as a consequence of the virial theorem for systems with similar radii, as GCs; see Fig. 1 of Djorgovski 1995). For most of these clusters, however, the binary fraction is still unknown and the trivariate correlation between , and cannot be derived. If its significance and its interpretation in terms of the velocity dispersion effect is confirmed also in high-density clusters, then stellar collisions might play a secondary role in the production of BSSs, and the evolution of primordial binaries should always be the dominant process. For the moment, however, these conclusions remain speculative, since the sample of GCs analyzed here, in spite of being the largest to date with known binary fraction, is still too small for statistically reliable assessments. Enlarging the sample of GCs with known binary and BSS fraction is therefore essential and urgent to verify the findings presented in this paper on a more robust statistical basis.
Acknowledgements.
This research was supported by the Ministero dell’Istruzione, Università e Ricerca and the Agenzia Spaziale Italiana. This research is part of the Progetti strategici di Ateneo 2006 granted by the Bologna University. We warmly thank Paolo Montegriffo for assistance during catalogs cross-correlation. We also thank Alison Sills, the referee of our paper, for her helpful comments and suggestions.References
- Bellazzini et al. (2003) Bellazzini, M., Ferraro, F. R., & Ibata, R. 2003, AJ, 125, 188
- Cariulo et al. (2004) Cariulo, P., Degl’Innocenti, S., & Castellani, V. 2004, A&A, 421, 1121
- (3) Carney, B. W., Latham, D. W., Laird, J. B. 2005, AJ, 129, 466
- (4) Davies, M. B., Piotto, G., De Angeli, F., 2004, MNRAS, 348, 129
- (5) De Angeli, F., Piotto, G., Cassisi, S., et al. 2005, AJ, 130, 116
- (6) De Marchi, F., de Angeli, F., Piotto, G., Carraro, G., & Davies, M. B. 2006, A&A, 459, 489
- (7) Djorgovski, S., 1993, in ASP Conf. Ser.50, Structure and Dynamics of Globular Clusters, ed. S. Djorgovski and G. Meylan, 373
- (8) Djorgovski, S., & Meylan, G. 1993, in ASP Conf. Ser.50, Structure and Dynamics of Globular Clusters, ed. S. Djorgovski and G. Meylan, 325
- (9) Djorgovski, S. 1995, ApJ, 438, L29
- (10) Ferraro, F. R., Fusi Pecci, F., & Bellazzini, M.1995, A&A, 294, 80
- Ferraro et al. (1997) Ferraro, F. R., Paltrinieri, B., Fusi Pecci, F. et al. 1997, A&A, 324, 915
- (12) Ferraro, F. R., Messineo, M., Fusi Pecci, F., et al. 1999, AJ, 118, 1738
- (13) Ferraro, F. R., Sabbi, E., Gratton, R., et al. 2006, ApJ, 647, L53
- (14) Fusi Pecci, F., Ferraro, F. R., Corsi, C. E., Cacciari, C., & Buonanno, R. 1992, AJ, 104, 1831
- (15) Gnedin, O. Y.,& Ostriker, J. P. 1997, ApJ, 474, 223
- (16) Heggie, D. C. 1975, MNRAS, 173, 729
- (17) Hills, J. G., Day, C. A., 1976, ApL, 17, 87
- (18) Hurley, J. R., Aarseth, S. J.;, & Shara, M. M. 2007, ApJ 665, 707
- (19) Ivanova, N., Belczynski, K., Fregeau, J. M., & Rasio, F. A. 2005, MNRAS, 358, 572
- (20) Leigh, N., Sills, A., & Knigge, C. 2007, ApJ, 661, 210
- (21) Lombardi, J. C., Jr., Rasio, F. A., & Shapiro, S. L. 1995, ApJ, 445, L117
- (22) Mapelli, M., Sigurdsson, S., Ferraro, et al. 2006, MNRAS, 373, 361
- (23) McCrea, W. H. 1964, MNRAS, 128, 147
- (24) McLaughlin, D. E.,& Van der Marel, R. P. 2005, ApJS, 161, 304
- (25) Momany, Y., Held, E. V., Saviane, et al. 2007, A&A, 468, 973
- Piotto et al. (2004) Piotto, G., De Angeli, F., King, I. R., et al. 2004, ApJ, 604, L109
- Pooley & Hut (2006) Pooley, D., & Hut, P. 2006, Apj, 646, L143
- (28) Robin, A. C., Reilé, C., Derrière, S.,& Picaud, S. 2003, A&A, 409, 523
- (29) Salaris, M.,& Weiss, A. 2002, A&A, 388, 492
- (30) Sandage, A. R. 1953, AJ, 58, 61
- (31) Sandquist, E. L. 2005, ApJ, 635, L73
- (32) Sarna, M. J., & de Greve, J.-P. 1996, QJRAS, 37, 11
- (33) Schwarz, G., 1978, Annals of Statistics, 6, 461
- (34) Sirianni, M., Jee, M. J., Benítez, N., et al. 2005, PASP, 117, 1049
- (35) Sollima, A., Beccari, G., Ferraro, F. R., Fusi Pecci, F., & Sarajedini, A. 2007, MNRAS, 380, 781
- Trager et al. (1995) Trager, S. C., King, I. R., & Djorgovski, S. 1995, AJ, 109, 218
- (37) Zinn, R.,& West, M. J. 1984, ApJS, 55, 45