AGB Variables and the Mira Period-Luminosity Relation
Abstract
Published data for large amplitude asymptotic giant branch variables in the Large Magellanic Cloud are re-analysed to establish the constants for an infrared () period-luminosity relation of the form: . A slope of and a zero point of are found for oxygen-rich Miras (if a distance modulus of is used for the LMC). Assuming this slope is applicable to Galactic Miras we discuss the zero-point for these stars using the revised Hipparcos parallaxes together with published VLBI parallaxes for OH Masers and Miras in Globular Clusters. These result in a mean zero-point of for O-rich Galactic Miras. The zero-point for Miras in the Galactic Bulge is not significantly different from this value.
Carbon-rich stars are also discussed and provide results that are consistent with the above numbers, but with higher uncertainties. Within the uncertainties there is no evidence for a significant difference between the period-luminosity relation zero-points for systems with different metallicity.
keywords:
stars:AGB and post-AGB – stars: oscillations – stars: carbon – stars: variables: other1 Introduction
Large amplitude Asymptotic Giant Branch (AGB) variables (Miras) are important distance indicators for old and intermediate age populations. They are luminous, both bolometrically and in the near-infrared, and easily identified by their late spectral types (Me, Ce, Se or very rarely Ke), large amplitudes ( mag, mag) and long periods (). The increasing use of adaptive optics on large telescopes at near-infrared wavelengths to study stellar populations (e.g. Da Costa 2004) at large distances will require confidence in the calibration of the AGB variables as distance indicators. Alternatively, if the distance is known the luminosities of the brightest AGB stars provide insight into the intermediate age populations, e.g. Menzies et al. (2008).
Wood et al. (1999) demonstrated that, within the LMC, AGB variables fall on a series of, approximately parallel, period-luminosity (PL) relations at , (see also Cioni et al. 2001, Ita et al. 2004, Fraser et al. 2005, Soszyǹski et al. 2007). The large amplitude variables, i.e. the Miras, however, lie only on a singe PL() relation. The existence of a Mira PL() relation has been known for some while (Feast et al. 1989; Hughes & Wood 1990) and is now generally thought to represent the relation for fundamental pulsation. While some of the low amplitude variables also pulsate in the fundamental, others show various overtones. Low amplitude variables are of limited use for distance scale studies as it is not simple to establish upon which of the various PL relations they lie. Complications do arise at periods in excess of about 400 d where some Miras in the LMC have higher luminosities, possibly as a consequence of hot bottom burning (e.g. Whitelock et al. 2003). Feast (2004) provides a recent discussion of AGB stars as distance indicators and of the zero-point of the PL relation.
Following a brief re-examination of the Mira PL() relation in the LMC, we take advantage of the new analysis of the Hipparcos data (van Leeuwen 2007a and 2007b, see also van Leeuwen 2005 and van Leeuwen & Fantino 2005) to re-examine the distance scale for large amplitude AGB variables within the Galaxy. Analysis of the original Hipparcos data was discussed by van Leeuwen et al. (1997), Whitelock & Feast (2000 - henceforth Paper I) and Knapp et al. (2003).
In the last part of this paper we put together all the available information on Mira parallaxes to establish the best value for the zero-point of the Mira PL() relation for the Galaxy and compare this with values for elsewhere.
| name | P | note | |
|---|---|---|---|
| (d) | (mag) | ||
| O-rich stars | |||
| 0517–6551 | 116 | 12.25 | |
| C38 | 130 | 12.12 | |
| 0512–6559 | 141 | 12.13 | |
| W132 | 156 | 11.67 | |
| 0526–6754 | 157 | 11.79 | |
| W151 | 174 | 11.74 | |
| W148 | 183 | 11.82 | |
| W158 | 194 | 11.77 | |
| 0528–6531 | 195 | 11.48 | |
| C11 | 202 | 11.51 | |
| GR13 | 202 | 11.59 | |
| SHV05220–7012 | 205 | 11.73 | 1 |
| 0507–6639 | 208 | 11.57 | |
| C20 | 210 | 11.54 | |
| W77 | 213 | 11.25 | S |
| R120 | 217 | 11.38 | |
| W94 | 220 | 11.28 | |
| W74 | 231 | 11.49 | |
| WBP74 | 233 | 11.50 | 1 |
| W1 | 235 | 11.48 | |
| W140 | 243 | 11.19 | |
| 0533–6807 | 247 | 11.38 | |
| R141 | 258 | 10.99 | |
| R110 | 261 | 11.29 | |
| W48 | 279 | 10.99 | |
| 0537–6607 | 284 | 11.02 | |
| 0505–6657 | 307 | 10.67 | |
| 0524–6543 | 315 | 10.71 | |
| W126 | 318 | 10.89 | K |
| SHV05305–7022 | 362 | 10.57 | |
| R105 | 413 | 10.33 | |
| C-rich stars | |||
| 0530–6437 | 157 | 12.08 | |
| 0515–6617 | 226 | 11.16 | |
| 0528–6520 | 229 | 11.08 | |
| 0520–6528 | 233 | 11.28 | |
| 0519–6454 | 242 | 11.09 | |
| W220 | 281 | 10.83 | |
| 0529–6759 | 283 | 10.91 | |
| 0515–6451 | 284 | 10.81 | |
| SHV05027–6924 | 298 | 10.82 | |
| 0514–6605 | 308 | 10.64 | |
| 0534–6531 | 308 | 10.98 | |
| 0529–6739 | 319 | 10.60 | |
| 0502–6711 | 322 | 10.53 | |
| C7 | 327 | 10.69 | |
| 0541–6631 | 342 | 10.50 | |
| R153 | 347 | 10.52 | |
| WBP14 | 351 | 10.62 | |
| W103 | 363 | 10.78 | |
| 0515–6438 | 365 | 10.90 | |
| 0537–6740 | 367 | 10.47 | |
| SHV05003–6817 | 369 | 10.58 | |
| SHV05260–7011 | 373 | 10.54 | |
| notes 1. Period taken from MACHO; | |||
| S and K are spectral types | |||

2 The LMC PL() relation
Table 1 lists the data for the LMC stars, with periods less than 420 d, which we use here to establish the PL() relation. The starting point is the material from Feast et al. (1989) for large amplitude variables with multiple observations. This is modified in light of Glass & Lloyd Evans (2003) who used MACHO data to refine the periods for the same group of stars and to eliminate three of them (W19, W30, W46) as semi-regular (SR), rather than Mira, variables. To this is added the observations from Whitelock et al. (2003) for three new O-rich and four C-rich Miras within our period range, as well as additional material for two O-rich stars (R105, 0517–6551) already in the sample. The changes introduced by the two 2003 papers are minor and this data-set is only marginally different from that used by Feast et al. (1989).
Twenty nine M-type Miras together with one S-type and one K-type Mira are analysed together as O-rich stars. An interstellar extinction correction of mag (Feast et al. 1989) was applied to the data in Table 1. The PL() relation is fitted in the form:
| (1) |
Where is the absolute mag, the pulsation period of the Mira and the zero-point of the PL() relation, which has a slope . In previous work, by ourselves and others, zero-points have been derived at , far outside the range of Mira periods. The distance modulus of the LMC is taken to be (van Leeuwen et al. 2007)
Table 2 lists the values of the slope and zero-point found by least squares fitting separately to the O-rich stars and to the C-rich stars as well as to both groups together; is the standard deveation of the best fit. The results are illustrated in Fig. 1. There is no significant difference in the slope determined for the O- and C-rich Miras. If we use the slope found for the O-rich sample and apply it to the C-rich sample we find a zero point of . Thus the difference between the zero-points for the C- and O-rich Miras is .
The slope determined above for the LMC O-rich Miras, i.e. can be compared with the value of obtained by Ita et al. (2004) for LMC stars close to PL() sequence C and selected by colour to be O-rich. While the error shows this number is well defined, Ita et al. include some low amplitude, i.e. non-Mira, variables in the fit. Furthermore, it seems tautological to define the PL relation in terms of stars that were selected because they fell on sequence C. Rejkuba (2004) found a very similar slope, , for colour selected Miras in Cen A, supporting the assumption that this PL() relation is universal.
| typ | No. | ||||
|---|---|---|---|---|---|
| O- | 31 | 0.14 | |||
| C- | 22 | 0.15 | |||
| all | 53 | 0.15 |
3 The Revised Hipparcos Sample and Associated Data
Of the sample selected in Paper I there are astrometric data in the revised Hipparcos catalogue (van Leeuwen 2007) for 184 O-rich Miras, 15 O-rich semi-regulars and 40 C-rich variables.
In Paper I a number of non-Mira variables were included in the selection on the basis of their spectra, which were Mira-like in that they showed the emission lines that are characteristic of the shock waves associated with pulsations in Miras. For the O-rich stars 4 of the 15 semi-regular variables included in the sample have large amplitudes ( mag, where is the broadband visual mag measured by Hipparcos) and it is probably only these 4, T Ari, T Cen, W Hya and TV And, that we should include with the Miras in the parallax analysis. For the C-rich stars it is actually very difficult to distinguish between Miras and non Miras (see also Whitelock et al. 2006).
The infrared and associated data used in the following analysis are listed in the Appendix (Table LABEL:dist), which also includes all details which differ from Paper I.
3.1 The SP-red and SP-blue stars
Whitelock et al. (2000) divided the stars with periods below 225 d into two groups on the basis of their colour, and called them the short period red (SP-red) and short period blue (SP-blue) groups. The analysis of Paper I suggested that the SP-reds were more luminous, at a given period, than the SP-blues. Most critically a kinematic analysis (Feast & Whitelock 2000) indicated that the SP-reds were younger than the SP-blues which were more akin to the Globular Cluster Miras and a natural extrapolation of the Miras with d to shorter periods.
4 Analysis of Hipparcos Data
We follow the same procedure as in Paper I and the details are not repeated here, but it is useful to give the formulae which differ slightly due to the reformulation of the PL() relation described in section 2. We assume throughout that the the slope derived above from the O-rich LMC Miras will be the same for the Galaxy. Thus equation 1 with, , is solved for , as previously, in the form:
| (2) |
where is the parallax in milliarcsec (mas) and is the mean mag corrected for interstellar extinction (see Appendix). The right hand side of equation 2 is weighted by the following expression:
| (3) |
where
| (4) |
with the error on the parallax as quoted in the revised Hipparcos catalogue, the photometric parallax derived from the PL() relation, the standard deviation from the PL() relation (0.14 and 0.15 for the O- and C-rich stars respectively, see Table 2), and is the uncertainty associated with individual mags. The latter term is evaluated as follows: (where observations were used to derive the mean ). For further details refer to Paper I.
Due to uncertainties in the adopted slope, the error in a predicted absolute magnitude at any is, in the case of the O-Mira solution of Table 2:
| (5) |
and similar relations apply in other cases.
R Leo has a parallax measured by the Allegheny Observatory at mas (Gatewood 1992). For the analysis this is combined with the Hipparcos value, , to give .
4.1 Zero-point from the Hipparcos parallaxes
4.1.1 O-rich stars
The first part of Table 3 lists various values of , from equation (2) [weighted according to equations (3) and (4)], derived from different subgroups of the Hipparcos data. In examining these results it is crucial to remember that most of the weight resides with a small number of stars.
Solution 1 shows the result of using all of the O-rich stars for completeness and comparison with Paper I, although it is quite clear that this is not a useful solution as there are stars included in the full group that are not large amplitude variables and which certainly lie on one of the PL()s relations above the one for Miras (see also Glass & van Leeuwen 2007). W Cyg is the most obvious example and solution 2 shows the effect of leaving it out. In fact solution 2 is very close to the best solution we obtain.
Solutions 3 and 4 are for large amplitude variables and Mira variables respectively; the results are very similar as might be expected.
Solutions 5 to 8 show the results of separating out the SP-red and SP-blue stars (see Section 3.1). In fact there is no evidence here for a significant difference between the groups, provided that W Cyg is omitted, with the revised Hipparcos data.
Solution 9 omits the small amplitude variables and the SP-red stars and can be compared with ( for a slightly different slope for the PL() relation), the solution of choice from Paper I. Solution 10 rejects the low amplitude non-Miras and takes only the 42 stars with . If we were to decide that the SP-reds should be included, despite their kinematic differences from the SP-blues, then this solution, with its marginally smaller error, might be preferred, but it makes very little practical difference.
Solutions 11 and 12 show that much the same value of is derived from the longer period stars alone. It is important to note there is thus no reason to suspect that they are brighter or fainter than their short period counterparts (see also sections 5.1.1 and 5.1.2).
Solution 13 was derived in a different way and is discussed below (section 4.1.3).
4.1.2 C-rich stars
Solutions 14 to 24 apply to subsets of the data for C-rich stars. We note again that it is difficult to distinguish between Mira and non-Mira C-stars and that the amplitudes of the C-rich stars are on average distinctly lower than those of their O-rich counterparts. As in Paper I we note that WZ Cas and WX Cyg are lithium rich and therefore likely to differ from other stars in the sample. WZ Cas has a high weight and is clearly more luminous than the bulk of the sample. WX Cyg makes little difference, but we leave both stars out for most of the solutions (17 to 24).
The errors are high and it is difficult to deduce much about the sub-groupings of C stars. The non-Miras may have a lower value of (solution 23) than the Miras (solution 17) or the large amplitude variables (solution 18); this is to be expected if some of the low amplitude variables lie on overtone sequences, but cannot be claimed with confidence. Solution 24 is probably the best, including only the higher weight stars with large amplitudes. V Hya is in a binary system (see Olivier, Whitelock & Marang (2001) and references therein), although its normal variations are due to pulsation. Solution 19 was derived leaving out V Hya.
These various solutions indicate that within the errors the C- and O-rich stars obey the same PL relation at , which is consistent with earlier findings from the LMC (section 2 and Feast et al. 1989).
| Soln. | No. | weight | stars included in the analysis | ||
| No. | stars | (mag) | |||
| Oxygen-rich stars from Hipparcos | |||||
| 1 | 199 | 710 | –7.46 | 0.11 | all |
| 2 | 198 | 572 | –7.24 | 0.11 | all but W Cyg |
| 3 | 182 | 453 | –7.27 | 0.13 | mag |
| 4 | 184 | 385 | –7.22 | 0.14 | Mira variables |
| 5 | 183 | 460 | –7.28 | 0.13 | all but SP-red stars |
| 6 | 37 | –7.59 | 0.46 | SP-blue stars | |
| 7 | 16 | 259 | –7.81 | 0.22 | SP-red stars |
| 8 | 15 | 112 | –7.11 | 0.14 | SP-red stars not W Cyg |
| 9 | 168 | 434 | –7.27 | 0.14 | not SP-red stars; mag |
| 10 | 42 | 415 | –7.32 | 0.10 | Miras; non-Miras with mag; weight |
| 11 | 146 | 433 | –7.26 | 0.14 | day |
| 12 | 21 | 84 | –7.04 | 0.27 | Miras & non-Miras with mag; |
| 13 | 6 | –7.11 | 0.17 | , Miras, non-Miras with mag; | |
| Carbon-rich stars from Hipparcos | |||||
| 14 | 40 | 97 | –7.91 | 0.41 | all |
| 15 | 39 | 72 | –7.55 | 0.40 | omitting WZ Cas |
| 16 | 38 | 72 | –7.55 | 0.40 | omitting WZ Cas and WX Cyg |
| Carbon-rich stars omitting WZ Cas and WX Cyg | |||||
| 17 | 23 | 24 | –7.21 | 0.65 | Miras only |
| 18 | 31 | 33 | –7.14 | 0.50 | mag |
| 19 | 30 | 30 | –7.03 | 0.50 | mag, omitting V Hya |
| 20 | 24 | 46 | –7.74 | 0.60 | |
| 21 | 14 | 26 | –7.24 | 0.50 | |
| 22 | 35 | 70 | –7.57 | 0.43 | |
| 23 | 15 | 48 | –7.73 | 0.45 | non Miras |
| 24 | 16 | 32 | –7.18 | 0.37 | mag, |
| Values derived in other ways | |||||
| 25 | 5 | –7.08 | 0.17 | VLBI parallaxes for OH-Miras (section 5.1.1, Table 5) | |
| 26 | 11 | –7.34 | 0.13 | Globular Cluster Miras (section 5.2) | |
| 27 | 31 | –7.15 | 0.06 | LMC O-rich Miras (section 2) | |
| 28 | 22 | –7.24 | 0.07 | LMC C-rich Miras (section 2) | |
| 29 | 54 | –7.04 | 0.11 | Miras in the Galactic Bulge (section 5.3) | |
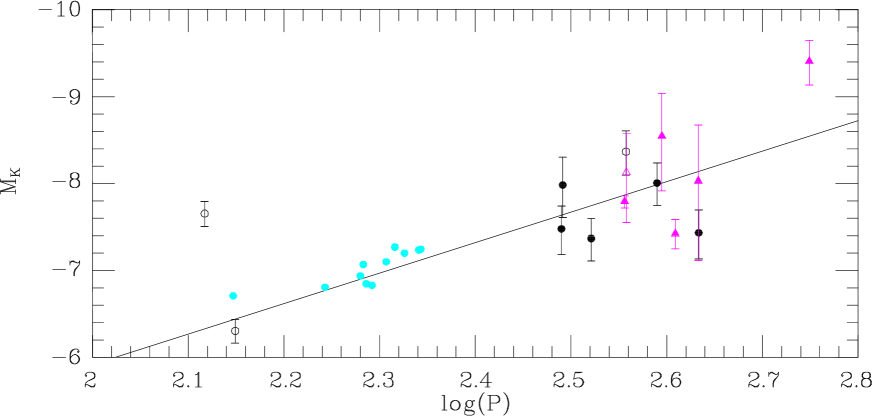
4.1.3 Individual stars with low uncertainty
As an alternative approach, because there are a few stars with good signal-to-noise ratios, we selected stars with positive Hipparcos parallaxes for which (Table 4). These are the same stars which dominate the various solutions discussed in section 4.1.1, as the 8 stars involved have 62 percent of the weight of the complete sample of 199 O-rich stars. There are no C-stars with . The 8 include 3 non-Mira variables, W Cyg, L2 Pup and W Hya, of which only the latter is a large amplitude variable. In view of the fact that these stars were selected on the basis of their ratio a Lutz-Kelker correction has been applied to their apparent magnitudes. This is evaluated (on the model used by Benedict et al. (2007)) as:
and it makes them up to 0.2 mag brighter than they would otherwise be. The corrections are listed in Table 4.
These stars are shown in the PL() diagram, Fig. 2, where they are compared with the stars discussed below. The PL() relation zero point derived from the six stars W Hya, R Hya, R Cas, R Car, Cet and R Leo, , is listed as solution 13 in Table 3. Note that the two low amplitude semi-regulars, W Cyg and L2 Pup, which have and are shown in the figure are omitted from this solution for consistency.
| name | type | |||||
|---|---|---|---|---|---|---|
| Cet | –2.45 | –0.10 | M | 2.521 | ||
| L2 Pup | –2.24 | –0.03 | SR | 2.149 | ||
| R Car | –1.35 | –0.13 | M | 2.490 | ||
| R Leo | –2.55 | –0.20 | M | 2.491 | ||
| R Hya | –2.47 | –0.10 | M | 2.590 | ||
| W Hya | –3.16 | –0.11 | SR | 2.558 | ||
| W Cyg | –1.40 | –0.04 | SR | 2.117 | ||
| R Cas | –1.79 | –0.14 | M | 2.633 |
5 Other Miras with Accurate Distances
5.1 Miras with VLBI parallaxes
Parallaxes for the OH and H2O masers associated with Miras promise to provide accurate distances for significant numbers of AGB stars. These techniques will be particularly important in establishing the distances to stars with high mass-loss rates, for which circumstellar extinction makes optical measurements extremely difficult.
5.1.1 Miras with OH parallaxes
Vlemmings et al. (2003) and Vlemmings & van Langevelde (2007) have published the results of astrometry for 5 stars, which are listed in Table 5 together with mean mags from SAAO photometry or the literature after correcting for interstellar extinctions determined as described in the Appendix. The Hipparcos and VLBI parallaxes agree within the quoted uncertainties.
The parallaxes of these 5 OH Masers, alone, give a zero-point for the PL() relation of . As Vlemmings & van Langevelde (2007) pointed out, the results for U Her seem to be different from the others, but taken with the Hipparcos results the difference is not obviously significant.
van Langevelde, van der Heiden & van Schooneveld (1990) measured phase-lag distances to more than 12 OH/IR sources (essentially Miras with high mass-loss rates and therefore thick dust shells). The magnitudes of these stars experience significant circumstellar extinction and they cannot therefore easily be presented in a PL() relation. Their position in a PL( relation was discussed by Whitelock, Feast & Catchpole (1991 their fig. 10) from which they appear to be consistent with the PL() relation extrapolated from shorter periods. Phase-lag distances might still prove useful for the longest period objects although it will be difficult to bring the errors down so that they can compete with VLBI parallaxes.
| name | typ | ref | |||||
| S CrB | 0.32 | M | 2.556 | V07 | |||
| U Her | –0.30 | M | 2.609 | V07 | |||
| RR Aql | - | 0.46 | M | 2.595 | V07 | ||
| W Hya | –3.17 | SR | 2.558 | V03 | |||
| R Cas | –1.80 | M | 2.663 | V03 | |||
| UX Cyg | - | 1.93 | M | 2.749 | K05 | ||
| refs: V07 Vlemmings & van Langevelde (2007); | |||||||
| V03 Vlemmings et al. (2003); | |||||||
| K05 Kurayama et al. (2005). | |||||||
5.1.2 Mira with H2O parallax
Kurayama, Sasao & Kobayashi (2005) published an accurate H2O maser parallax for UX Cyg which is given in Table 5 and illustrated in Fig. 2. It lies distinctly above the Mira PL() relation. This may indicate that it is an overtone pulsator and that it therefore lies on one of the other period-luminosity relations discussed by Wood (2000), although it has a longer period than any of the LMC stars on those sequences. The stars that define the other PL() relations are low amplitude semi-regular variables, and it would be surprising to find a star like UX Cyg in this position. However, the PL() sequences were defined for stars in the Magellanic Clouds, all of which are at the same distance, and very little is actually know about the distances of stars with periods significantly longer than 400 days in the Galaxy (except close the the Galactic Centre, where interstellar extinction is very high and patchy). Note that solution 12 (Table 3) for the 21 Hipparcos stars with days gives a zero-point completely consistent with them lying on the same PL() relation as the shorter period objects.
The alternative explanation is that UX Cyg is more luminous than those on the PL() relation as a result of hot bottom burning (HBB), and is therefore akin to the luminous Magellanic Cloud Miras discussed by Whitelock et al. (2003). This could be confirmed by the detection of abundance anomalies associate with HBB, which include a measurable lithium content. Note that the long period O-rich LMC Miras that Whitelock et al. (2003) thought lay close to the extrapolated bolometric PL relation, would actually lie below a PL() relation because the significant circumstellar reddening would effect their apparent luminosities.
UX Cyg is not included in evaluating the mean PL() relation zero-point below.
5.2 Globular Clusters
Feast et al. (2002) discussed the PL relation for globular cluster Miras, using a distance scale based on Hipparcos parallaxes for subdwarfs (from Carretta et al. (2000) who estimate the total uncertainty at mag). Re-analysing those data using equation 1 with we find a PL() relation zero-point of (internal error), or allowing for the uncertainty in the cluster scale. The points for the individual Miras are illustrated in Fig. 2.
5.3 The Galactic Bulge
Glass et al. (1995) discussed long period variables in the Sgr I window of the Galactic Bulge and derived a similar slope for the PL() relation to the one found here (section 2) for the LMC. Re-analysing these, as above, gives . Using the Eisenhauer et al. (2005) distance to the centre, with the relativistic correction suggested by Zucker et al. (2006), gives , and provides a zero-point of for these Galactic Bulge Miras. The similarity of this to the other values found here suggests that any abundance effects on the PL() relation zero-point must be small.
In the conclusion below we do not average this Bulge distance along with the other values to get a mean zero-point for the Galaxy. If we did so the agreement of the Galactic mean with the LMC would be even closer. However, there are systematic uncertainties associated with the Bulge (including its shape and structure) that suggest it should not be treated in the same way.
6 Conclusions
In Paper I (section 2.2) we noted a caveat with regard to temporal changes in the light distribution across the stellar disk as problematic for the interpretation of the parallaxes. This is particularly so because the angular diameters of the Miras are two or three times larger than their parallaxes. More recent work (e.g. Ragland et al. 2006; Woodruff et al. 2008) confirms that the diameters are large, variable and non-uniform. These same references further highlight the disagreement between observation and theory, emphasizing our very limited understanding of the atmospheres of these stars or their variations. This is clearly a real problem, but the agreement on the distance scale achieved by the different methods summarized above may indicate that the net effect is small.
As noted, the various results discussed above are in good agreement with each other. UX Cyg, is brighter than we would expect from the PL() relation and this may be because of hot bottom burning. We take a simple mean of solutions 10, 25, 26 from Table 3, to set a mean value of for the O-rich Mira variables in the Galaxy. This is in reasonable agreement with the LMC value of .
Solution 24, for the C-rich Miras, of is in agreement with the above result for O-rich Miras and with the LMC value for C-stars of This supports an identical PL() relation for O- and C-rich variables.
The O-rich result represents the best value for large amplitude variables, but it should be used with caution on stars with periods in excess of 400 days. The parallaxes offer the most likely significant improvement in this result in the near future.
Acknowledgments
We are grateful to Fred Marang and Francois van Wyk for making the new infrared observation reported in the appendix.
This publication makes use of data products from the Two Micron All Sky Survey (2MASS), which is a joint project of the University of Massachusetts and the Infrared Processing and Analysis Center/California Institute of Technology, funded by the National Aeronautics and Space Administration and the National Science Foundation.
This paper utilizes public domain data obtained by the MACHO Project, jointly funded by the US Department of Energy through the University of California, Lawrence Livermore National Laboratory under contract No. W-7405-Eng-48, by the National Science Foundation through the Center for Particle Astrophysics of the University of California under cooperative agreement AST-8809616, and by the Mount Stromlo and Siding Spring Observatory, part of the Australian National University.
References
- [] Benedict G. F., McArthur B. E., Feast M. W., Barnes T. G., Harrison T. E., Patterson R. J., Menzies, J. W., Bean J. L., Freedman W. L., 2007, AJ, 133, 1810
- [] Carpenter, J. M. 2001, AJ, 121, 2851 (updates: http://www.astro.caltech.edu/j̃mc/2mass/v3/transformations/)
- [] Carretta E., Gratton R. G., Clementini G., Fusi Pecci F., 2000, ApJ, 533, 215
- [] Carter B. S., 1990, MNRAS, 242, 1
- [] Cioni M.-R., et al., 2001, A&A, 377, 945
- [] Chen P., Gao H., Zhang Y., Yang J., 1984, Chin. A&A, 8, 37
- [] Chen P. S., Gao H., Chen Y. K., Dong H. W., 1988, A&AS, 72, 239
- [] Cutri R. M., et al., 2003, The 2MASS All-Sky Catalog of Point Sources, University of Massachusetts and Infrared Processing and Analysis Center (IPAC)/ California Institute of Technology
- [] Da Costa G. S., 2004, Publ. Astr. Soc. Aust., 21, 366
- [] Drimmel R., Cabrera-Levers A., López-Corredoira M., 2003, A& A, 409, 205
- [] Eisenhauer F., 2005, ApJ, 628, 246
- [] Feast M. W., 2004, in: (eds.) Kurtz D. W. & Pollard K. R., Variable Stars in the Local Group, ASP Conf. Ser., 310, 304
- [] Feast M. W., Whitelock P. A., 2000, MNRAS, 317, 460
- [] Feast M. W., Glass I. S., Whitelock P. A., Catchpole R. M., 1989, MNRAS, 241, 375
- [] Feast M. W., Whitelock P. A., Menzies J.W., 2002, MNRAS, 329, L7
- [] Fraser O. J., Hawley S. L., Cook K. H., Keller S. C., 2005, AJ, 129, 768
- [] Gao H., Chen P., Zhang Y., 1985, Chin. A&A, 9, 150
- [] Gatewood G., 1992, PASP, 104, 23
- [] Gezari D. Y., Pitts P. S., Schmitz M., 1999, Catalog of Infrared Observations, Edition 5, unpublished
- [] Glass I. S., 1999, Handbook of Infrared Photometry, CUP
- [] Glass I. S., van Leeuwen F., 2007, MNRAS, 378, 1543
- [] Glass I. S., Lloyd Evans T., 2003, MNRAS, 343, 67
- [] Glass I. S., Whitelock P. A., Catchpole R. M., Feast M. W., 1995, MNRAS, 273, 383
- [] Hughes S. M. G., Wood P. R., 1990, AJ, 99, 784
- [] Ita Y., et al., 2004, MNRAS, 347, 720
- [] Kerschbaum F., Lebzelter T., Lazaro C., 2001, A&A, 375, 527
- [] Knapp G. R., Pourbaix D., Platais I., Jorissen, A., 2003, A&A, 403, 993
- [] Kholopov P. N. et al., 1985, General Catalogue of Variable Stars 4th edn. Nauka Publishing House, Moscow (GCVS)
- [] Kurayama T., Sasao T., Kobayashi H., 2005, ApJ, 627, L49
- [] Menzies J., Feast M., Whitelock P. A., Olivier E., Matsunaga N., Da Costa G., 2008, MNRAS, in press
- [] Noguchi K., Kawara K., Kobayashi Y., Okuda H., Sato S., Oishi M., 1981, PASJ, 33, 373
- [] Le Bertre T., Tanaka M., Yamamura I., Murakami H., 2003, A&A, 403, 943
- [] Olivier, E. A., Whitelock P. A., Marang F., 2001, MNRAS, 326, 490
- [] Ragland S., et al., 2006, ApJ, 652, 650
- [] Rejkuba M., 2004, A&A, 413, 903
- [] Smith B. J., Price S. D., Baker R. I., 2004, ApJS, 154, 673
- [] Soszyǹski I., et al., 2007, AcA, 57, 201
- [] Sun J., Zhang H., 1998, Chin. A&A, 22, 442
- [] Taranova O. G., Shenavrin V. I., 2004, Astro. Let., 30, 549
- [] van Langevelde H. J., van der Heiden R., van Schooneveld C., 1990, A&A, 239, 193
- [] van Leeuwen F., 2005, A&A, 439, 791
- [] van Leeuwen F., 2007a, Hipparcos: The new reduction of the raw data, Springer, Berlin
- [] van Leeuwen F., 2007b, A&A, 474, 653
- [] van Leeuwen F., Fantino E., 2005, A&A, 439, 791
- [] van Leeuwen F., Feast M. W., Whitelock P. A., Yudin B., 1997, MNRAS, 287, 955
- [] van Leeuwen F., Feast M. W., Whitelock P. A., Laney C. D., 2007, MNRAS, 379, 723
- [] Vlemmings W. H. T., van Langevelde H. J., 2007, A&A, 472, 547
- [] Vlemmings, W. H. T., van Langevelde H. J., Diamond P. J., Habing H. J., Schilizzi, R. T., 2003, A&A, 407, 213
- [] Whitelock P. A., Feast M. W., 2000, MNRAS, 319, 759 (Paper I)
- [] Whitelock P. A., Feast M. W., Catchpole R. M., 1991, MNRAS, 248, 276
- [] Whitelock P. A., Marang F., Feast M. W., 2000, MNRAS, 319, 728
- [] Whitelock P. A., Feast M. W., van Loon J. Th., Zijlstra A. A., 2003, 342, 86
- [] Whitelock P. A., Feast M. W., Marang F., Groenewegen M. A. T., 2006, MNRAS, 369, 751
- [] Wood P. R. et al., 1999, in Le Bertre T., Lébre A., Waelkens C., eds, IAU Symp. 191, Asymptotic Giant Branch Stars. Astron. Soc. Pac., San Francisco, p. 151
- [] Wood P. R., 2000, Publ. Astr. Soc. Aust., 17, 18
- [] Woodruff H. C., Tuthill P. G., Monnier J. D., Ireland, M. J., Bedding T. R., Lacour S., Danchi W. C., Scholz M., 2008, ApJ, in press, (arXiv:0709.3878)
- [] Zucker S., Alexander T., Gillessen S., Eisenhauer F., Genzel R., 2006, ApJ, 639, L21
APPENDIX: Infrared Photometry and Basic Data
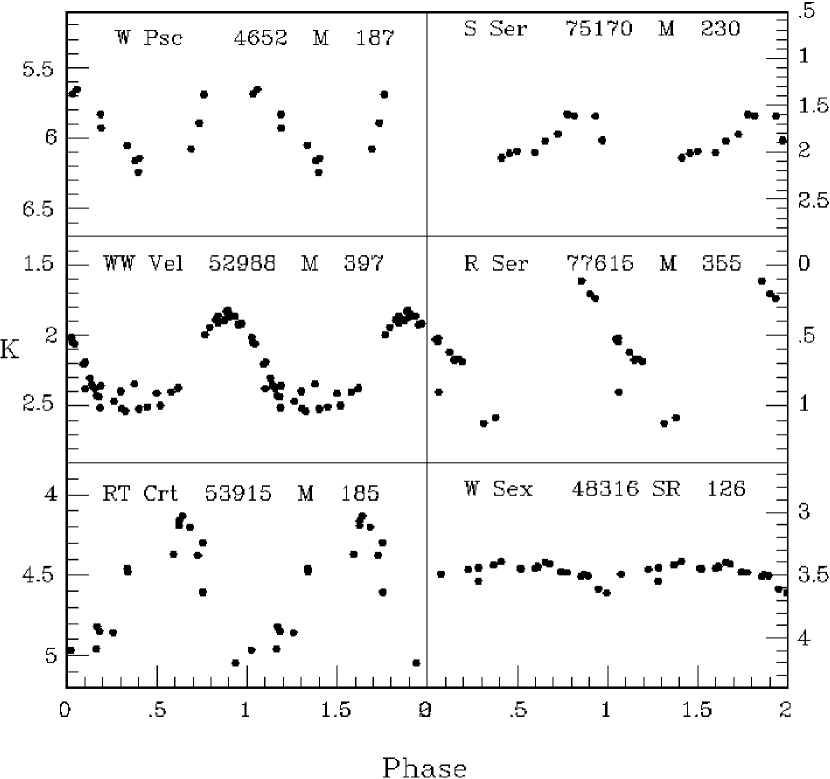
The infrared magnitudes used here are largely those used in Paper I, with updates where significant quantities of new data are available. New infrared photometry has been obtained from SAAO for 10 stars: W Psc, WW Vel, RT Crt, S CrB, S Ser, BG Ser, R Ser, RU Her, T Her and W Sex. This is listed in Table A1 (the full table is available on-line) together with previously published data for the same stars. Six of these stars have sufficient data to derive periods (more than 9 observations) and their light curves are illustrated in Fig. A1. A description of the photometer, telescope etc. was given in Whitelock et al. (2000).
6.1 Interstellar Extinction
The interstellar extinction corrections used here are derived in a different way from those used in Paper I. A first estimate is made of the distance to the Mira assuming no interstellar extinction and equation 1 of section 2 with and . The extinction is then estimated using the Drimmel et al. (2003) three dimensional Galactic extinction model, including the rescaling factors that correct the dust column density to account for small scale structure seen in the DIRBE data, but not described explicitly by the model. The measured mean mag is then corrected for extinction following the reddening law given by Glass (1999) and the procedure iterated; two iterations usually suffice.
This procedure gives significantly different, in many cases larger, extinctions for individual stars from the statistical method applied by Whitelock, Marang & Feast (2000) and used in Paper I. The biggest difference among the O-rich stars is for UX Oph which has mag according to the method used here, in contrast to the mag used in Paper I. Nevertheless, the net effect on the derived zero-point is negligible, first because the reddening at is low, and secondly, because the stars with the highest weight are the closest and have the least reddening.
6.2 Pulsation periods and amplitudes
Pulsation periods, , and peak-to-peak amplitudes, , were derived for the stars with 9 or more SAAO observations. These are listed in Table A2 along with Fourier mean magnitudes, , for all of the stars with new observations (see also Fig. A1).
In general we use the pulsation periods tabulated in the General Catalogue of Variable Stars (GCVS, Kholopov et al. 1985) for the parallax analysis, as these are usually based on large data sets. However, Whitelock et al. (2000) noted the very significant difference between the GCVS and Hipparcos periods for RT Crt, WW Vel and W Sex (their fig. 1). We now have sufficient infrared data to be confident that the Hipparcos periods are correct for RT Crt and WW Vel. W Sex is a low amplitude variable C-star and its period is not well determined from the IR observations although the Hipparcos value of 200 d seems better than the 134 d GCVS value. We therefore use the Hipparcos values for all three stars in the parallax analysis, in preference to the GCVS values (see also Fig. A1).
Note that although the period derived from the infrared data, , for S Ser, 230 days, is significantly different from the 372 days given in the GCVS (Hipparcos derived 376), we use the GCVS value in the analysis as there are insufficient IR data to be confident in any period derived from them. Note also that although BG Ser is classified as a Mira, its amplitude, is low and more typical of a semi-regular variable. The values used in the analysis are listed in Table LABEL:dist.
6.3 The Data
Table LABEL:dist contains the material used in, and derived from,
the analysis
related to the infrared magnitudes. The columns are as follows:
(1) the GCVS variable star name;
(2) the Hipparcos catalogue number;
(3) the variability type: Mostly Mira (M) or semi-regular (SR) variables,
with two slow irregulars (L or LB) among the C-stars;
(4) P, the period used in the analysis, which is generally that
tabulated in the GCVS (see section 6.2 for RT Crt, WW Vel and W Sex);
(5) , the peak-to-peak amplitude of the
variations in the Hipparcos mag; stars with large amplitudes, i.e.,
mag (O-rich) or mag (C-rich),
are considered to be very similar to the Miras for most purposes;
(6) , the mean mag, before correcting for interstellar
extinction;
(7) the number of observations used to derive the mean in column (6)
- where there are 9 or more observations the value will probably be
close to the true mean (see below for more details of the non-SAAO photometry);
(8) , the interstellar extinction at (see above), but note
that this depends on the distance and the reddening should be regarded as
a lower limit if it is uncertain that the star lies on
the Mira PL() relation, i.e. if there is no entry in the “dist” column
(because almost all of the non-Mira variables lie on PL() relations
above the Mira one);
(9) dist, the distance in kpc derived from equation 1, with
and
(the identical relation was used for O- and C-rich
stars), dist is not given for stars which do not, or may not, lie
on the Mira PL() relation, i.e. low amplitude variables.
Where there were more than 5 observations contributing to the mean mag listed by Whitelock et al. (2000), or new SAAO photometry, these values were used. Otherwise mags were taken from the literature and particularly from the compilation by Gezari, Pitts & Schmitz (1999). The following references which were not cited by Gezari et al., or which are more recent, were also used: 2MASS (Cutri et al. 2003), DIRBE (Smith, Price & Baker 2004), Noguchi et al. (1981), Taranova & Shenavrin (2004), Chen et al. (1984), Gao, Chen & Zhang (1985), Kerschbaum, Lebzelter & Lazaro (2001), Sun & Zhang (1998), Chen et al. (1988)111The Chen et al. value for R Lyn () was not used as it is inconsistent with other measurements., Le Bertre et al. (2003).
Where necessary and practical observations from the literature were transformed to the SAAO system (e.g. Carter 1990, Carpenter 2001). Most of the stars discussed here were sufficiently bright to be saturated in 2MASS and are quoted in the catalogue (Cutri et al. 2003) with large errors, these values were only used where little else was available. While there should be no problem with saturation of the DIRBE photometry (Smith et al. 2004), there is some risk of confusion with other sources in the large aperture. More importantly there is very little information available on the calibration or transformation for the DIRBE system; following Beverly Smith (2007 private communication) we assume that a mag star has a flux of 630 Jy. Although the DIRBE photometry was integrated over a period of days or weeks, a DIRBE mag was only given the same weight as any other measurement when the mean was established for Table LABEL:dist.
| JD–2440000 | ||||
|---|---|---|---|---|
| (day) | (mag) | |||
| W Psc Hip 4652 | ||||
| 9356.26 | 6.91 | 6.01 | 5.69 | 5.34 |
| 10053.29 | 6.96 | 6.02 | 5.69 | 5.24 |
| 10295.64 | 6.92 | 6.01 | 5.65 | 5.26 |
| 10320.57 | 7.22 | 6.33 | 5.93 | 5.44 |
| 10360.46 | 7.44 | 6.57 | 6.14 | 5.80 |
| 10414.31 | 7.28 | 6.41 | 6.08 | 5.52 |
| 10721.47 | 7.34 | 6.47 | 6.05 | 5.69 |
| 10796.28 | 7.13 | 6.21 | 5.89 | 5.38 |
| 11068.27 | 7.13 | 6.22 | 5.83 | 5.41 |
| 11104.27 | 7.47 | 6.58 | 6.16 | 5.72 |
| 12977.29 | 7.55 | 6.66 | 6.24 | 5.77 |
| Hip | name | no. | typ | |||||||
|---|---|---|---|---|---|---|---|---|---|---|
| No. | (mag) | (d) | ||||||||
| 4652 | W Psc | 7.18 | 6.28 | 5.92 | 5.47 | 0.62 | 11 | 188 | 187 | M |
| 48316 | W Sex | 5.09 | 3.94 | 3.48 | 3.05 | 0.11 | 21 | 200 | 126 | SR |
| 52988 | WW Vel | 3.72 | 2.70 | 2.23 | 1.71 | 0.69 | 38 | 392 | 397 | M |
| 53915 | RT Crt | 5.88 | 5.04 | 4.58 | 3.96 | 0.88 | 16 | 183 | 185 | M |
| 75143 | S CrB | 1.69 | 0.74 | 0.22 | –0.32 | 0.64 | 8 | 360 | - | M |
| 75170 | S Ser | 3.45 | 2.42 | 1.88 | 1.31 | 0.41 | 10 | 372 | 230 | M |
| 77027 | BG Ser | 1.95 | 0.85 | 0.39 | –0.04 | 0.31 | 8 | 404 | - | M |
| 77615 | R Ser | 2.03 | 1.11 | 0.63 | 0.03 | 0.70 | 13 | 356 | 355 | M |
| 79233 | RU Her | 1.96 | 0.88 | 0.34 | –0.25 | 0.73 | 9 | 485 | 482 | M |
| 88923 | T Her | 4.46 | 3.67 | 3.35 | 2.91 | 0.42 | 4 | 165 | - | M |
| Name | Hip | type | P | no. | dist | |||
|---|---|---|---|---|---|---|---|---|
| no. | (d) | (mag) | (mag) | (kpc) | ||||
| Data for O-rich variables | ||||||||
| Z Peg | 8 | M | 335 | 4.01 | 1.09 | 7 | 0.11 | 0.59 |
| SV And | 344 | M | 316 | 3.96 | 2.45 | 4 | 0.26 | 1.05 |
| SW Scl | 516 | SR | 146 | 1.30 | 3.72 | 4 | 0.04 | |
| RU Oct | 703 | M | 373 | 2.23 | 2.68 | 14 | 0.26 | 1.30 |
| SS Cas | 781 | M | 141 | 3.00 | 3.48 | 2 | 0.41 | 0.95 |
| S Scl | 1236 | M | 362 | 4.50 | 0.31 | 122 | 0.04 | 0.43 |
| T Cas | 1834 | M | 445 | 2.16 | –1.04 | 8 | 0.15 | 0.27 |
| R And | 1901 | M | 409 | 4.27 | 0.01 | 7 | 0.17 | 0.41 |
| T Scl | 2286 | M | 202 | 2.88 | 3.74 | 9 | 0.06 | 1.39 |
| TU And | 2546 | M | 317 | 3.52 | 2.11 | 5 | 0.11 | 0.90 |
| W Psc | 4652 | M | 188 | 2.61 | 5.92 | 11 | 0.17 | 3.60 |
| U Per | 9306 | M | 320 | 2.36 | 0.89 | 5 | 0.27 | 0.51 |
| Y Eri | 9767 | M | 303 | 2.10 | 1.79 | 14 | 0.07 | 0.75 |
| R Ari | 10576 | M | 187 | 3.61 | 3.94 | 12 | 0.20 | 1.44 |
| W And | 10687 | M | 396 | 5.10 | 0.43 | 5 | 0.11 | 0.49 |
| Cet | 10826 | M | 332 | 4.39 | –2.45 | 104 | 0.04 | 0.11 |
| R Cet | 11350 | M | 166 | 4.25 | 2.54 | 30 | 0.10 | 0.70 |
| S Tri | 11423 | M | 242 | 1.46 | 3.86 | 3 | 0.21 | 1.66 |
| U Cet | 11910 | M | 235 | 3.88 | 2.77 | 25 | 0.06 | 0.99 |
| R Tri | 12193 | M | 267 | 3.96 | 0.97 | 13 | 0.13 | 0.47 |
| T Ari | 13092 | SR | 317 | 1.66 | 0.17 | 23 | 0.23 | 0.37 |
| R Hor | 13502 | M | 408 | 4.48 | –0.93 | 52 | 0.07 | 0.27 |
| T Hor | 14042 | M | 218 | 3.29 | 3.32 | 14 | 0.06 | 1.21 |
| X Cet | 15465 | M | 177 | 2.68 | 4.23 | 15 | 0.16 | 1.59 |
| RT Eri | 16647 | M | 371 | 2.60 | 0.39 | 5 | 0.28 | 0.45 |
| T Eri | 18336 | M | 252 | 3.73 | 2.42 | 23 | 0.09 | 0.89 |
| W Eri | 19567 | M | 377 | 4.04 | 1.51 | 16 | 0.16 | 0.77 |
| RS Eri | 20045 | M | 296 | 3.05 | 1.22 | 5 | 0.12 | 0.57 |
| R Ret | 21252 | M | 278 | 3.42 | 1.74 | 22 | 0.09 | 0.69 |
| RX Tau | 21600 | M | 332 | 2.12 | 1.21 | 10 | 0.39 | 0.61 |
| R Cae | 21766 | M | 391 | 3.56 | 0.59 | 116 | 0.05 | 0.52 |
| X Cam | 22127 | M | 144 | 3.69 | 3.64 | 1 | 0.28 | 1.04 |
| SU Dor | 22256 | M | 236 | 3.44 | 5.09 | 11 | 0.03 | 2.90 |
| T Lep | 23636 | M | 368 | 2.89 | 0.09 | 16 | 0.06 | 0.39 |
| U Dor | 24055 | M | 394 | 3.38 | 1.17 | 35 | 0.11 | 0.68 |
| S Pic | 24126 | M | 428 | 4.37 | 0.72 | 93 | 0.05 | 0.59 |
| T Pic | 24468 | M | 201 | 4.04 | 4.26 | 14 | 0.07 | 1.77 |
| R Aur | 24645 | M | 458 | 3.72 | –0.69 | 4 | 0.16 | 0.32 |
| T Col | 24824 | M | 226 | 2.79 | 1.96 | 14 | 0.06 | 0.66 |
| R Oct | 25412 | M | 405 | 4.00 | 0.75 | 6 | 0.38 | 0.57 |
| S Ori | 25673 | M | 414 | 3.05 | –0.07 | 101 | 0.73 | 0.39 |
| S Col | 27286 | M | 326 | 3.22 | 1.59 | 12 | 0.07 | 0.73 |
| U Ori | 28041 | M | 368 | 4.90 | –0.75 | 56 | 0.14 | 0.27 |
| RS Aur | 28714 | SR | 171 | 0.73 | 3.10 | 2 | 0.33 | |
| X Aur | 29441 | M | 164 | 2.86 | 3.43 | 3 | 0.32 | 1.03 |
| V Mon | 30326 | M | 340 | 4.20 | 1.08 | 20 | 0.29 | 0.59 |
| RV Pup | 32115 | M | 188 | 2.96 | 3.62 | 17 | 0.30 | 1.25 |
| X Gem | 32512 | M | 264 | 3.10 | 1.86 | 7 | 0.05 | 0.71 |
| X Mon | 33441 | SR | 156 | 1.17 | 2.87 | 20 | 0.39 | |
| R Lyn | 33824 | M | 379 | 4.29 | 2.14 | 4 | 0.14 | 1.04 |
| R Gem | 34356 | M | 370 | 4.31 | 1.67 | 4 | 0.04 | 0.82 |
| L2 Pup | 34922 | SR | 141 | 0.71 | –2.24 | 71 | 0.04 | |
| V Gem | 35812 | M | 275 | 3.31 | 2.81 | 9 | 0.14 | 1.12 |
| TT Mon | 36043 | M | 323 | 3.86 | 1.95 | 7 | 0.38 | 0.84 |
| VX Aur | 36314 | M | 322 | 3.07 | 1.53 | 3 | 0.14 | 0.70 |
| RX Mon | 36394 | M | 346 | 3.72 | 2.67 | 6 | 0.11 | 1.24 |
| S Vol | 36423 | M | 395 | 3.67 | 2.41 | 3 | 0.59 | 1.18 |
| Z Pup | 36669 | M | 509 | 3.89 | 1.33 | 72 | 0.44 | 0.87 |
| S CMi | 36675 | M | 333 | 3.85 | 0.48 | 11 | 0.05 | 0.44 |
| U CMi | 37459 | M | 413 | 3.41 | 2.61 | 9 | 0.32 | 1.36 |
| W Pup | 37893 | M | 120 | 3.28 | 3.54 | 20 | 0.44 | 0.87 |
| SU Pup | 38772 | M | 340 | 5.45 | 2.58 | 11 | 0.34 | 1.16 |
| AS Pup | 39967 | M | 325 | 2.59 | 0.27 | 6 | 0.69 | 0.38 |
| R Cnc | 40534 | M | 362 | 3.32 | –0.62 | 19 | 0.07 | 0.28 |
| SV Pup | 40593 | M | 167 | 3.78 | 3.59 | 4 | 0.24 | 1.13 |
| S Hya | 43653 | M | 257 | 4.08 | 2.85 | 11 | 0.16 | 1.09 |
| T Hya | 43835 | M | 299 | 3.98 | 2.36 | 14 | 0.09 | 0.97 |
| W Cnc | 44995 | M | 393 | 3.90 | 1.04 | 5 | 0.10 | 0.64 |
| R Car | 46806 | M | 309 | 4.27 | –1.35 | 74 | 0.10 | 0.18 |
| X Hya | 47066 | M | 301 | 3.73 | 0.65 | 13 | 0.18 | 0.44 |
| R LMi | 47886 | M | 372 | 3.58 | –0.34 | 10 | 0.04 | 0.33 |
| R Leo | 48036 | M | 310 | 3.46 | –2.55 | 53 | 0.03 | 0.10 |
| S LMi | 48520 | M | 234 | 4.37 | 3.81 | 3 | 0.04 | 1.60 |
| V Leo | 49026 | M | 273 | 3.90 | 3.17 | 6 | 0.06 | 1.32 |
| X Ant | 49524 | M | 162 | 3.41 | 5.41 | 6 | 0.20 | 2.56 |
| S Car | 49751 | M | 149 | 2.79 | 1.87 | 34 | 0.18 | 0.47 |
| W Vel | 50230 | M | 395 | 3.62 | 0.56 | 13 | 0.42 | 0.51 |
| V Ant | 50697 | M | 303 | 3.97 | 2.10 | 9 | 0.30 | 0.86 |
| S Sex | 51791 | M | 265 | 2.72 | 3.42 | 12 | 0.21 | 1.44 |
| R UMa | 52546 | M | 302 | 4.18 | 1.37 | 13 | 0.07 | 0.62 |
| WX Vel | 52887 | M | 412 | 3.72 | 1.81 | 8 | 0.66 | 0.92 |
| WW Vel | 52988 | M | 392 | 2.77 | 2.23 | 38 | 0.58 | 1.08 |
| CI Vel | 53853 | M | 143 | 2.38 | 6.38 | 7 | 0.89 | 3.58 |
| RT Crt | 53915 | M | 183 | 3.20 | 4.58 | 16 | 0.12 | 1.91 |
| DN Hya | 57009 | M | 182 | 3.20 | 5.37 | 5 | 0.24 | 2.73 |
| X Cen | 57642 | M | 315 | 3.60 | 1.10 | 14 | 0.32 | 0.56 |
| W Cen | 58107 | M | 202 | 3.45 | 1.95 | 17 | 0.44 | 0.60 |
| R Com | 58854 | M | 363 | 4.35 | 2.21 | 8 | 0.06 | 1.04 |
| R Crv | 60106 | M | 317 | 4.10 | 1.88 | 19 | 0.17 | 0.81 |
| XZ Cen | 60502 | M | 291 | 1.95 | 1.51 | 4 | 0.23 | 0.64 |
| T CVn | 61009 | M | 290 | 1.41 | 2.04 | 6 | 0.04 | 0.82 |
| U Cen | 61286 | M | 220 | 3.53 | 3.13 | 8 | 0.61 | 1.09 |
| T UMa | 61532 | M | 257 | 4.13 | 2.74 | 6 | 0.03 | 1.04 |
| R Vir | 61667 | M | 146 | 3.27 | 2.05 | 10 | 0.06 | 0.51 |
| S UMa | 62126 | M | 226 | 3.00 | 3.04 | 3 | 0.04 | 1.09 |
| U Vir | 62712 | M | 207 | 3.80 | 4.01 | 7 | 0.07 | 1.61 |
| BZ Vir | 63501 | M | 151 | 2.15 | 5.35 | 4 | 0.24 | 2.37 |
| V CVn | 65006 | SR | 192 | 1.13 | 1.12 | 6 | 0.10 | |
| R Hya | 65835 | M | 389 | 2.71 | –2.47 | 53 | 0.12 | 0.13 |
| S Vir | 66100 | M | 375 | 4.25 | 0.33 | 13 | 0.10 | 0.45 |
| T Cen | 66825 | SR | 90 | 1.79 | 2.50 | 27 | 0.12 | 0.45 |
| RT Cen | 67359 | M | 255 | 1.40 | 2.69 | 18 | 0.23 | 1.01 |
| R CVn | 67410 | M | 329 | 3.36 | 0.45 | 5 | 0.03 | 0.43 |
| W Hya | 67419 | SR | 361 | 2.02 | –3.16 | 24 | 0.05 | 0.09 |
| RX Cen | 67626 | M | 328 | 4.99 | 2.77 | 16 | 0.25 | 1.24 |
| RU Hya | 69346 | M | 332 | 3.81 | 1.57 | 15 | 0.16 | 0.72 |
| R Cen | 69754 | M | 546 | 2.63 | –0.70 | 66 | 0.21 | 0.36 |
| U UMi | 69816 | M | 331 | 2.51 | 0.71 | 2 | 0.06 | 0.49 |
| S Boo | 70291 | M | 271 | 3.89 | 3.11 | 2 | 0.02 | 1.28 |
| RW Lup | 70590 | M | 331 | 1.07 | 2.52 | 9 | 0.44 | 1.11 |
| RS Vir | 70669 | M | 354 | 3.71 | 1.10 | 30 | 0.09 | 0.61 |
| R Boo | 71490 | M | 223 | 3.82 | 2.11 | 6 | 0.06 | 0.71 |
| RR Boo | 72300 | M | 195 | 3.70 | 5.19 | 2 | 0.02 | 2.66 |
| Y Lib | 74350 | M | 276 | 4.17 | 3.29 | 15 | 0.24 | 1.40 |
| RT Boo | 74802 | M | 274 | 2.04 | 2.56 | 3 | 0.06 | 1.00 |
| S CrB | 75143 | M | 360 | 4.09 | 0.32 | 22 | 0.05 | 0.43 |
| S Lib | 75144 | M | 193 | 2.32 | 4.51 | 14 | 0.48 | 1.90 |
| S Ser | 75170 | M | 372 | 2.69 | 1.88 | 10 | 0.13 | 0.91 |
| RS Lib | 75393 | M | 218 | 2.58 | –0.07 | 35 | 0.26 | 0.25 |
| S UMi | 75847 | M | 331 | 2.61 | 3.04 | 3 | 0.08 | 1.43 |
| R Nor | 76377 | M | 508 | 4.53 | 1.27 | 55 | 0.59 | 0.84 |
| BG Ser | 77027 | M | 404 | 2.04 | 0.39 | 8 | 0.36 | 0.48 |
| T Nor | 77058 | M | 241 | 3.93 | 2.16 | 6 | 0.49 | 0.75 |
| X CrB | 77460 | M | 241 | 3.59 | 3.42 | 2 | 0.06 | 1.36 |
| R Ser | 77615 | M | 356 | 4.54 | 0.63 | 13 | 0.12 | 0.49 |
| RZ Sco | 78746 | M | 157 | 1.93 | 4.19 | 15 | 0.60 | 1.41 |
| Z Sco | 78872 | M | 343 | 1.78 | 1.48 | 15 | 0.82 | 0.69 |
| RU Her | 79233 | M | 485 | 4.46 | 0.36 | 20 | 0.19 | 0.54 |
| U Her | 80488 | M | 406 | 3.88 | –0.29 | 20 | 0.14 | 0.36 |
| R Dra | 81014 | M | 246 | 3.85 | 2.26 | 4 | 0.08 | 0.81 |
| SS Her | 81026 | M | 107 | 2.68 | 5.08 | 8 | 0.24 | 1.64 |
| AS Her | 81506 | M | 269 | 3.44 | 1.94 | 5 | 0.16 | 0.74 |
| S Her | 82516 | M | 307 | 4.39 | 1.30 | 5 | 0.20 | 0.60 |
| Z Ara | 82695 | M | 289 | 3.46 | 3.20 | 4 | 0.59 | 1.37 |
| RS Sco | 82833 | M | 320 | 4.45 | 0.40 | 13 | 0.25 | 0.41 |
| RR Sco | 82912 | M | 281 | 3.34 | –0.23 | 54 | 0.22 | 0.28 |
| SY Her | 83304 | M | 117 | 3.04 | 4.33 | 7 | 0.16 | 1.24 |
| UX Oph | 83582 | M | 117 | 3.15 | 4.71 | 3 | 1.51 | 1.40 |
| Z Oph | 84763 | M | 349 | 3.80 | 4.01 | 5 | 0.57 | 2.27 |
| RS Her | 84948 | M | 220 | 3.25 | 2.92 | 4 | 0.16 | 1.01 |
| Z Oct | 86836 | M | 335 | 2.48 | 2.72 | 2 | 0.45 | 1.22 |
| T Her | 88923 | M | 165 | 3.74 | 3.36 | 8 | 0.19 | 1.01 |
| R Pav | 89258 | M | 229 | 3.65 | 2.90 | 12 | 0.25 | 1.02 |
| W Lyr | 89419 | M | 198 | 3.37 | 3.22 | 5 | 0.10 | 1.08 |
| RY Oph | 89568 | M | 150 | 3.00 | 2.96 | 8 | 0.51 | 0.77 |
| AL Dra | 90474 | M | 330 | 3.20 | 2.99 | 4 | 0.23 | 1.38 |
| RV Sgr | 90493 | M | 316 | 4.44 | 1.62 | 18 | 0.35 | 0.71 |
| RS Dra | 91316 | SR | 283 | 0.61 | 1.96 | 3 | 0.27 | |
| R Aql | 93820 | M | 284 | 3.11 | –0.76 | 45 | 0.13 | 0.22 |
| SS Lyr | 94438 | M | 346 | 2.80 | 1.94 | 3 | 0.17 | 0.88 |
| RW Sgr | 94489 | SR | 187 | 0.61 | 3.06 | 9 | 0.32 | |
| R Sgr | 94738 | M | 270 | 4.28 | 2.06 | 13 | 0.28 | 0.78 |
| DD Cyg | 96031 | M | 148 | 2.90 | 6.29 | 1 | 0.61 | 3.55 |
| RT Aql | 96580 | M | 327 | 3.22 | 1.12 | 9 | 0.27 | 0.58 |
| BG Cyg | 96647 | M | 288 | 1.19 | 1.06 | 3 | 0.24 | 0.52 |
| RT Cyg | 97068 | M | 190 | 3.68 | 3.23 | 3 | 0.19 | 1.05 |
| chi Cyg | 97629 | M | 408 | 5.51 | –1.91 | 11 | 0.10 | 0.17 |
| T Pav | 97644 | M | 244 | 4.31 | 2.87 | 9 | 0.31 | 1.06 |
| RR Sgr | 98077 | M | 336 | 4.56 | 0.69 | 14 | 0.28 | 0.49 |
| RU Sgr | 98334 | M | 240 | 3.93 | 2.18 | 5 | 0.24 | 0.76 |
| BQ Pav | 98447 | M | 110 | 3.01 | 6.58 | 16 | 0.17 | 3.35 |
| R Del | 99802 | M | 285 | 3.20 | 1.93 | 5 | 0.41 | 0.76 |
| RT Sgr | 100033 | M | 306 | 3.99 | 1.33 | 7 | 0.14 | 0.61 |
| CN Cyg | 100048 | M | 199 | 2.99 | 4.05 | 1 | 0.61 | 1.56 |
| V865 Aql | 100599 | M | 367 | 3.20 | 1.60 | 7 | 0.42 | 0.78 |
| U Mic | 101063 | M | 334 | 3.55 | 1.84 | 21 | 0.15 | 0.83 |
| R Mic | 101985 | M | 139 | 3.58 | 3.66 | 7 | 0.18 | 1.03 |
| S Del | 102246 | M | 278 | 2.18 | 2.08 | 4 | 0.22 | 0.81 |
| V Aqr | 102546 | SR | 244 | 1.13 | 0.58 | 3 | 0.23 | |
| AM Cyg | 102732 | M | 371 | 2.42 | 1.88 | 2 | 0.44 | 0.89 |
| T Aqr | 102829 | M | 202 | 3.17 | 3.24 | 14 | 0.19 | 1.10 |
| RX Vul | 103069 | M | 457 | 1.54 | 1.06 | 2 | 0.34 | 0.71 |
| R Vul | 104015 | M | 164 | 3.60 | 3.24 | 2 | 0.44 | 0.94 |
| V Cap | 104285 | M | 276 | 3.51 | 3.48 | 11 | 0.15 | 1.53 |
| T Cep | 104451 | M | 388 | 3.45 | –1.76 | 6 | 0.33 | 0.17 |
| T Cap | 105498 | M | 269 | 3.20 | 3.24 | 18 | 0.22 | 1.35 |
| W Cyg | 106642 | SR | 131 | 0.62 | –1.40 | 4 | 0.06 | |
| RU Cyg | 107036 | SR | 233 | 0.75 | –0.29 | 3 | 0.14 | |
| TU Peg | 107390 | M | 321 | 2.97 | 1.10 | 4 | 0.30 | 0.57 |
| RS Peg | 109610 | M | 415 | 3.14 | 1.20 | 7 | 0.17 | 0.71 |
| DH Lac | 109619 | M | 289 | 2.83 | 4.56 | 1 | 0.43 | 2.58 |
| X Aqr | 110146 | M | 312 | 3.65 | 2.96 | 18 | 0.10 | 1.32 |
| UU Tuc | 110451 | M | 335 | 3.08 | 3.53 | 66 | 0.08 | 1.80 |
| RT Aqr | 110509 | M | 246 | 1.46 | 2.17 | 20 | 0.08 | 0.78 |
| T Gru | 110697 | M | 136 | 2.35 | 5.24 | 14 | 0.04 | 2.10 |
| S Gru | 110736 | M | 402 | 4.38 | 0.68 | 14 | 0.03 | 0.55 |
| S Lac | 110972 | M | 242 | 3.40 | 2.42 | 4 | 0.47 | 0.85 |
| SS Peg | 111385 | M | 425 | 3.94 | 1.15 | 6 | 0.12 | 0.71 |
| T Tuc | 111946 | M | 250 | 3.84 | 3.22 | 7 | 0.06 | 1.28 |
| SX Peg | 112784 | M | 304 | 3.53 | 3.15 | 7 | 0.22 | 1.41 |
| TV And | 113405 | SR | 114 | 1.71 | 3.50 | 1 | 0.53 | 0.82 |
| RT Oct | 113652 | M | 180 | 4.22 | 5.72 | 3 | 0.43 | 3.16 |
| R Peg | 114114 | M | 378 | 4.11 | 0.52 | 10 | 0.20 | 0.49 |
| V Cas | 114515 | M | 229 | 3.17 | 0.86 | 4 | 0.22 | 0.40 |
| TY And | 114757 | SR | 260 | 0.79 | 1.62 | 4 | 0.25 | |
| W Peg | 115188 | M | 346 | 2.58 | –0.02 | 6 | 0.19 | 0.36 |
| S Peg | 115242 | M | 319 | 3.48 | 1.42 | 12 | 0.16 | 0.66 |
| R Aqr | 117054 | M | 387 | 3.82 | –1.02 | 104 | 0.06 | 0.25 |
| R Cas | 118188 | M | 430 | 4.24 | –1.79 | 13 | 0.10 | 0.19 |
| Data for C-rich variables | ||||||||
| WZ Cas | 99 | SR | 186 | 0.44 | 0.61 | 8 | 0.17 | |
| W Cas | 4284 | M | 399 | 2.02 | 2.77 | 14 | 0.64 | 1.44 |
| R Scl | 6759 | SR | 375 | 1.13 | –0.09 | 157 | 0.07 | 0.37 |
| X Cas | 9057 | M | 420 | 1.44 | 2.37 | 4 | 0.59 | 1.24 |
| R For | 11582 | M | 385 | 3.30 | 1.21 | 100 | 0.04 | 0.68 |
| Y Per | 16126 | M | 238 | 0.61 | 3.64 | 1 | 0.48 | 1.50 |
| SY Per | 19931 | SR | 474 | 1.11 | 1.82 | 5 | 0.51 | 1.05 |
| AU Aur | 22796 | M | 400 | 1.46 | 2.87 | 1 | 0.64 | 1.51 |
| R Ori | 23165 | M | 377 | 2.37 | 4.07 | 14 | 0.31 | 2.53 |
| R Lep | 23203 | M | 438 | 1.65 | 0.05 | 71 | 0.24 | 0.44 |
| S Cam | 26753 | SR | 327 | 1.15 | 2.61 | 1 | 0.28 | 1.16 |
| Y Tau | 27181 | SR | 242 | 0.22 | 0.26 | 6 | 0.17 | |
| V Aur | 30449 | M | 349 | 1.72 | 2.99 | 1 | 0.33 | 1.45 |
| CR Gem | 31349 | SR | 250 | 0.54 | 1.36 | 1 | 0.27 | |
| R CMi | 34474 | M | 338 | 2.38 | 2.54 | 11 | 0.41 | 1.16 |
| VX Gem | 34859 | M | 391 | 1.87 | 3.13 | 9 | 0.03 | 1.68 |
| T Lyn | 41058 | M | 409 | 2.07 | 3.02 | 23 | 0.13 | 1.65 |
| R Pyx | 42975 | M | 369 | 1.70 | 2.50 | 11 | 0.36 | 1.20 |
| UW Pyx | 43123 | LB | 423 | 1.50 | 2.62 | 5 | 0.65 | 1.40 |
| IQ Hya | 45266 | SR | 397 | 1.77 | 2.84 | 15 | 0.52 | 1.49 |
| W Sex | 48316 | SR | 200 | 0.54 | 3.47 | 20 | 0.15 | |
| V Hya | 53085 | L | 532 | 2.15 | –0.71 | 75 | 0.13 | 0.36 |
| BH Cru | 59844 | M | 421 | 1.71 | 1.49 | 54 | 0.65 | 0.83 |
| RU Vir | 62401 | M | 444 | 1.73 | 1.79 | 46 | 0.08 | 0.99 |
| V Cru | 63175 | M | 380 | 1.84 | 2.80 | 96 | 0.94 | 1.41 |
| RV Cen | 66466 | M | 447 | 1.25 | 1.40 | 87 | 0.82 | 0.83 |
| V CrB | 77501 | M | 358 | 2.05 | 1.27 | 48 | 0.04 | 0.67 |
| RR Her | 78721 | SR | 240 | 1.61 | 3.22 | 3 | 0.08 | 1.24 |
| V Oph | 80550 | M | 297 | 1.54 | 1.56 | 11 | 0.86 | 0.67 |
| SZ Ara | 84059 | M | 222 | 1.38 | 4.41 | 8 | 0.47 | 2.03 |
| TT Cyg | 96836 | SR | 118 | 0.38 | 1.95 | 2 | 0.21 | |
| RS Cyg | 99653 | SR | 417 | 1.40 | 1.00 | 4 | 0.50 | 0.66 |
| WX Cyg | 100113 | M | 399 | 1.48 | 2.29 | 1 | 0.78 | |
| U Cyg | 100219 | M | 460 | 2.18 | 1.11 | 7 | 0.59 | 0.74 |
| V Cyg | 102082 | M | 417 | 1.91 | 0.02 | 1 | 0.38 | 0.42 |
| YY Cyg | 105539 | SR | 388 | 0.51 | 2.58 | 1 | 0.73 | |
| S Cep | 106583 | M | 486 | 1.79 | –0.10 | 1 | 0.38 | 0.44 |
| RV Cyg | 107242 | SR | 263 | 0.25 | 0.37 | 2 | 0.29 | |
| RZ Peg | 109089 | M | 439 | 3.12 | 2.48 | 2 | 0.44 | 1.35 |
| ST And | 116681 | SR | 328 | 1.65 | 3.37 | 16 | 0.28 | 1.65 |