Long-term observations of Uranus and Neptune at 90 GHz with the IRAM 30m telescope
)
Abstract
Context. The planets Uranus and Neptune with small apparent diameters are primary calibration standards.
Aims. We investigate their variability at GHz using archived data taken at the IRAM 30m telescope during the 20 years period 1985 to 2005.
Methods. We calibrate the planetary observations against non-variable secondary standards (NGC 7027, NGC 7538, W3OH, K3-50A) observed almost simultaneously.
Results. Between 1985 and 2005, the viewing angle of Uranus changed from south-pole to equatorial. We find that the disk brightness temperature declines by almost 10% () over this time span indicating that the south-pole region is significantly brighter than average. Our finding is consistent with recent long-term radio observations at 8.6 GHz by Klein & Hofstadter (2006). Both data sets do moreover show a rapid decrease of the Uranus brightness temperature during the year 1993, indicating a temporal, planetary scale change. We do not find indications for a variation of Neptune’s brightness temperature at the 8% level.
Conclusions. If Uranus is to be used as calibration source, and if accuracies better than 10% are required, the Uranus sub-earth point latitude needs to be taken into account.
Key Words.:
Planets - Uranus - Neptune1 Introduction
At mm-wavelengths, the planets Uranus and Neptune with small apparent diameter are frequently used for calibration of astronomical sources and telescope parameters. In this context it is often tacitly assumed that they are constant radiators, at least at short term intervals. Observations over a decade or a longer period, preferably with the same telescope and receivers and traceable modifications, may reveal a long–term variability of Uranus and Neptune.
For a long time, Uranus and Neptune have been separated by a distance of 22o or less in the sky and thus allow precise comparative measurements. Griffin & Orton (1993) observed Uranus and Neptune in 1990 and 1992 to derive their brightness temperature in the millimeter and submillimeter regime. However, recent microwave as well as observations at visible and near-infrared wavelengths indicate that Uranus is variable on time scales of several years (see e.g. Klein & Hofstadter 2006, KH06 in the following). Due to Uranus’ large obliquity of , measurements from the earth alternate between observations of the poles and the equator, i.e. the sub-earth point (SEP) latitude varies. KH06 argue that the variations they observed at 3.5 cm (8.6 GHz) are partly caused by the geometrical effect, but partly also by temporal variations deep inside the Uranus troposphere. However, this variability has not yet been studied at millimeter wavelengths.
We investigate whether these long-term variations described above are noticeable in 20 years pointing observations 111This collection of pointing measurements provided also the basis for several compilations of quasar flux densities published by Steppe et al. (1988, 1992, 1993) and Reuter et al. (1997). Unfortunately, most of the data of 1988 and 1989 are lost, for unknown reason. made with the IRAM 30m telescope at 90 GHz. By relating the observations of the planets to nearly simultaneous observations of the constant secondary calibrators NGC 7027, NGC 7538, W3OH and K3–50A, the measurements of the planets are free from changes of the telescope performance (reflector adjustments, receiver upgrades, etc.) but contain, on the other hand, the errors of the secondary measurements. The secondaries are small relative to the half power beam width (HPBW) of at 90 GHz.
2 Observations, selection criteria
We use heterodyne observations (0.5 and 1 GHz bandwidth) made between 1985 and 2005 with the IRAM 30m telescope (Pico Veleta, Spain) at 86 – 90 GHz (3.4 mm). Most of the data were obtained during pointing measurements, or extended pointing sessions during the earlier years (see Greve et al. 1996). The data are scans across the planets, and other sources, including the fitted Gaussian profiles, their halfwidths, their pointing offsets, and their peak antenna temperature , separately determined for the azimuth (Az) and elevation (El) directions. An archived measurement is accepted for this analysis if the Az and El pointing offsets do not exceed 3 – 5′′, i.e. being small compared to the HPBW, and if the Az and El full width at half maximum (FWHM) are within 3 – 5′′ of the source convolved value. Under these conditions the antenna temperatures obtained from the Az and El scans agree within 10 , and their average value is used.
The hot-cold-sky calibration method used at the 30m telescope corrects for atmospheric attenuation and gives the antenna temperature [K] of the beam convolved source.
The aperture efficiency and forward efficiency (see Downes 1989; Greve et al. 1998a) are regularly determined ( to within , to within ) and the flux density of a point source per beam is [Jy] (with the geometrical area of the 30m reflector, and k the Boltzmann constant). It is impossible to recover the actual value for a certain day in order to derive the flux density from the archived antenna temperature . However, from simultaneous observations of the constant sources NGC 7027, NGC 7538, W3OH and K3–50A (see for instance Steppe et al. 1993; Reuter & Kramer 1998; Sandell 1994), with flux densities given in Table 1, we derived the gain which we applied to the measurements of the planets . The derived flux densities of the planets contain also the errors of the measurements of the standard sources.
We assume that any time variance of the four secondary calibrators is negligible. NGC 7538, K3-50A, and W3OH are ultra-compact H ii regions which are stable. Due to the flat spectrum of the planetary nebula NGC 7027 (Sanchez Contreras et al. 1998) the reported flux density variation at 1.4 GHz of 0.24 % per year (Perley et al. 2006) is expected to occur, approximately, also at mm-wavelengths. This amounts to a change of in 20 years. We note that we usually observed several secondaries per day, using their average to calculate the planetary fluxes, thereby reducing this slight effect.
One pointing measurement consists of 2 Az and 2 El scans. The error of a pointing measurement, used in the following, is the rms-value of the four scans. Almost all observations were made in the elevation range 20 – 70. In this range, the gain-elevation correction at 90 GHz is less than 2 % (cf. Table 2 in Greve et al. 1998b). We did not correct for this minor effect.
This procedure does not allow the derivation of absolute flux densities of the planets since their flux densities were used to derive the flux densities of the standards. In the following we therefore study relative changes of the planet’s flux densities and disk-averaged brightness temperatures.
We show in Fig. 1 the measurements of the four secondary calibrators over the entire observing period and list their mean temperatures in Table 1. An accuracy of better than 10% is achieved for all secondaries illustrating the precision of repeated pointing measurements made by many visiting observers usually for their own programs. The observed scatter of antenna temperatures includes possible changes of the telescope efficiencies from day to day and over the years. Such changes are calibrated out when studying relative temperature variations measured on the same day.

From the relation between the observed flux density , the Planck function at temperature , the beam pattern , and the solid angle of the planet subtended at the time of observation
| (1) |
we obtain when assuming a constant brightness temperature across the disk () of the planet
| (2) |
and with the Rayleigh-Jeans temperature
| (3) | |||||
| (4) |
The first-order Planck correction at 90 GHz is
.
In the above equations, we use for the beam pattern a Gaussian profile of 27′′ HPBW (Greve et al. 1998a), as it remained constant throughout the years by using receivers of similar illumination taper. Using the IRAM in-house program planets we derive from the flux densities the corresponding disk-averaged brightness temperature [K]. This program takes into account the apparent diameter of the planets and the HBPW. In Eq. 4, the correction factor for a non-pointlike planetary disk is (cf. Eq. 12 in Baars 1973):
| (5) |
where is called beam dilution factor.
The apparent surface area of Uranus changed by 2.5% over the 20 years observing period discussed here. This is due to its oblateness, coupled with its high obliquity. We take this geometrical effect into account when discussing possible temporal changes of its disk averaged temperature in Sec. 3.1. The variations due to Neptune’s oblateness are much smaller and ignored.
| Source | rms | ||||
|---|---|---|---|---|---|
| [K] | [] | [Jy] | [′′] | ||
| W3OH(2,3) | 0.63 | 8.2 | 517 | 3.77 | 14 10 |
| NGC 7538 | 0.41 | 10.1 | 351 | 2.37 | 20 18 |
| K3–50A(3) | 1.06 | 8.7 | 451 | 6.00 | 10 5 |
| NGC 7027(2) | 0.77 | 7.9 | 455 | 4.58 | 10 |
References: Steppe et al. (1993), for comparison: W3OH: 4.08 0.12 Jy, NGC 7027: 5.27 0.15 Jy (Ulich 1981); W3OH: 3.93 Jy, K3–50A: 6.31 Jy (Table 3 in Reuter & Kramer 1998); approximate dimensions at mm-wavelengths from Sandell (1994), for comparison: Reuter & Kramer (1998) give at 90 GHz, W3OH: 6′′ and K3–50A: 2′′.
3 Uranus and Neptune
Because of their small apparent diameters of 2′′, Uranus and Neptune are good calibration standards, at least for the larger and more sensitive mm–wavelength telescopes. In addition, they were never far apart in the sky during the past 20 years (distance ) and are therefore ideal for comparative measurements.
Griffin & Orton (1993) determined Uranus and Neptune brightness temperatures in the 0.35 to 3.3 mm region, using Mars as the primary standard. From measurements made in 1990 and 1992 they derive brightness temperatures of Uranus and Neptune at 90 GHz of (Uranus) = 136 K and (Neptune) = 131 K.
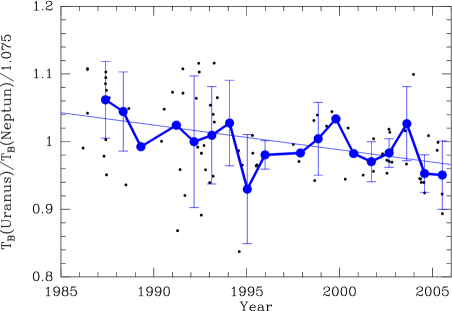
Since Uranus and Neptune are close together on the sky, a plot of the ratio of their brightness temperatures derived from simultaneous measurements made with the same telescope, may reveal also a relative change of their brightness temperatures. Such measurements of Uranus and Neptune made at frequencies between 86 and 90 GHz during 1986 and 2005, are shown in Fig. 2. These data were partly observed without complementary observations of the secondaries. However, only their relative ratios are discussed in this paragraph.
Calculating the brightness temperature ratio from the ratio of antenna temperatures, we took into account the Uranus (U) and Neptune (N) apparent diameters at the time of the observation: , with the beam dilution factor (cf. Eq. 5). The average planetary diameter was calculated from the equatorial and polar radii (JPL’s HORIZONS system). In the case of Uranus, we took into account that the effective polar diameter changes with viewing geometry (see below).
The ratio is expected to be constant at 1.04 (Griffin & Orton 1993). The average ratio derived from the IRAM observations is 1.07, only slightly larger. We are, however, interested in the relative changes. The rms of the observed ratios is only 6%.
A linear least-squares fit to the data (Bevington & Robinson 1992) shown in Figure 2 results in a slope of per year, i.e. a drop by 8% between 1985 and 2005. However, the statistical error of the slope is very large and the linear-correlation coefficient is small (). In order to study where this variation may come from, we present in the following the Uranus and Neptune data independently. These data were observed near simultaneously with the secondary calibrators to derive their brightness temperatures.
3.1 Uranus
Uranus has a 84 year orbital period of which we have observed approximately one season (Fig. 3), between solstice in the mid 1980 s and almost equinox which will take place in 2007. Uranus is slightly oblate, the polar radius of 24973 km is 2.4% smaller than its equatorial radius of 25559 km (Lindal 1987, 1992). In addition, Uranus has an obliquity of . In 1985, Uranus showed its south pole to the earth-bound observer, the sub-earth point (SEP) latitude was , the apparent radius was nearly the equatorial radius. It showed its equator in 2005 when the SEP latitude was (cf. Fig. 4). In summary, Uranus showed different regions and the disk area changed by over the past 20 years. The change of disk area has been taken into account in the following.
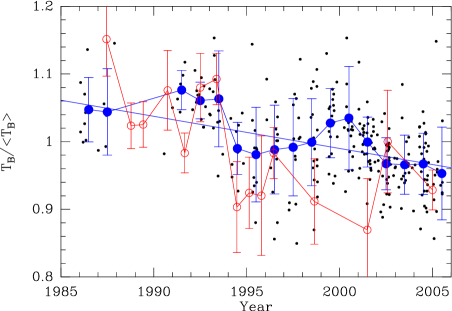
The secular change in normalized brightness temperature of Uranus between 1985 and 2005 at 90 GHz is shown in Fig. 3. These data show an overall scatter (rms) of, again, 6%. A linear least-squares fit to the data results in a slope of per year, i.e. a drop by 9% between 1985 and 2005. Again, the statistical error of the slope is large and the linear-correlation coefficient is small (). The yearly averages vary between in 1991 and in 2005 (cf. also Table 3). Note that this drop is consistent within the errors with the change found when studying the ratio of Uranus and Neptune brightness temperatures (Fig. 2), however with much fewer data. This indicates that Neptune temperatures are constant.
Figure 3 also shows the results of Klein & Hofstadter (2006) who studied Uranus at 8.6 GHz (3.5 cm) (see also Hofstadter & Butler 2003) over the last 36 years and find significant variability. In late 1993, they find a strong temperature decrease, indicating a rapid, planetary-scale change. And indeed, the 90 GHz data also show a temperature-drop at this time. Here, the decrease is by .
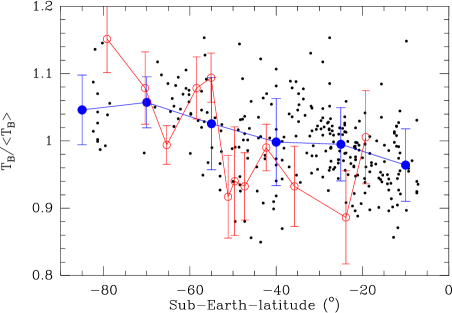
A plot of the 90 GHz temperature variation against SEP latitude (Fig. 4) shows an almost monotononic decrease of almost 10%, from about at SEP latitudes of about to at SEP latitudes of about , indicating that Uranus brightness temperature depends on the viewing angle. This decrease is detected at the -level as the binned data have an average rms of (Table 3). 222Using the equatorial radius for the calculation of the disk area at all times, i.e. not taking into account the change of disk area with viewing angle, would lead to a slightly steeper slope and a decrease of at SEP latitudes of . On average, the 8.6 GHz data of KH06 show a similar dependence with year and SEP latitude, however with larger scatter.
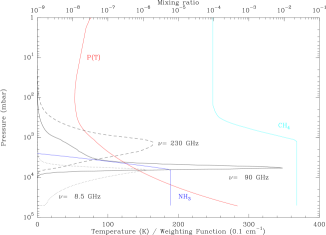
Figure 5 shows that higher frequencies probe successively higher layers of the Uranus atmosphere. The continuum at 8.5 GHz stems from the high pressure zone, i.e. 11.0 to 5.7 bar at low altitudes, where the opacity is sensitive to the NH3 vertical distribution and the thermal structure. In contrast, 90 GHz emission probes the region of pressures between 6.1 and 4.7 bar, higher in the atmosphere, where the opacity is also a function of NH3, but much more sensitive to the thermal structure. At still higher frequencies, the 230 GHz continuum emission arises from still higher atmospheric levels (3.5-0.8 bar), near the tropopause. The continuum at 230 GHz is mainly sensitive to the thermal structure, and only slightly to the CH4 vertical distribution, but not to NH3.
It is important to note that between 8.5 and 90 GHz, the difference of the opacity sensitivity to NH3 and to the thermal structure, may explain the differences of the relative changes of Uranus’ brightness temperature between 8.5 and 90 GHz shown in Figures 3 and 4.
| Year | rms | ||
|---|---|---|---|
| [%] | |||
| 1986 | 1.05 | 4.6 | 8 |
| 1987 | 1.04 | 6.1 | 5 |
| 1991 | 1.08 | 2.7 | 6 |
| 1992 | 1.06 | 2.6 | 12 |
| 1993 | 1.06 | 6.7 | 14 |
| 1994 | 0.99 | 3.9 | 10 |
| 1995 | 0.98 | 7.1 | 11 |
| 1996 | 0.99 | 6.6 | 14 |
| 1997 | 0.99 | 7.3 | 16 |
| 1998 | 1.00 | 6.4 | 18 |
| 1999 | 1.03 | 5.0 | 19 |
| 2000 | 1.03 | 7.4 | 21 |
| 2001 | 1.00 | 3.7 | 38 |
| 2002 | 0.97 | 4.0 | 32 |
| 2003 | 0.97 | 4.5 | 19 |
| 2004 | 0.97 | 4.7 | 28 |
| 2005 | 0.95 | 7.2 | 14 |
| SEP | Year | rms | ||
|---|---|---|---|---|
| Latitude | [K] | [] | ||
| -85.0 | 1986.70 | 1.05 | 5.0 | 13 |
| -70.0 | 1991.92 | 1.06 | 3.6 | 13 |
| -55.0 | 1994.16 | 1.03 | 6.7 | 44 |
| -40.0 | 1998.17 | 1.00 | 6.5 | 57 |
| -25.0 | 2001.67 | 0.99 | 5.5 | 108 |
| -10.0 | 2004.55 | 0.96 | 5.6 | 51 |
3.2 Neptune
Figure 6 shows the brightness temperatures of Neptune, normalized to the average temperature of of 128.3 K. A linear least-squares fit indicates a very small drop of only 2% between 1985 and 2005. In addition, the statistical uncertainty of the fitted slope is large, 80%. We conclude that Neptune temperatures are constant within the 8% observational error.

4 Summary
By careful selection of data from the archived pointing measurements made at the IRAM 30m telescope during the period 1985 to 2005, we have been able to study the long-term behaviour of Uranus and Neptune at 90 GHz. The large number of selected observations allowed a statistically meaningful analysis.
-
1.
We obtained 286 observations of Uranus. The scatter of the derived normalized brightness temperatures is 6%.
We find a systematic variation of the Uranus brightness temperature of % with sub-earth point (SEP) latitude when the orientation of Uranus changes from south-pole view to equator view. This effect is detected at the level, the mean scatter of the data averaged in bins is 5%. A similar change is indicated by the 8.6 GHz observations of KH06. The year 1993 shows a rapid decrease of brightness temperatures at 90 GHz of , which corresponds to a similar decrease seen by KH06, indicating a temporal change of a large fraction of the Uranus atmosphere. More observations at other frequencies and improved models of the Uranus atmosphere, taking into account its latitude structure, are needed to better determine the variations with SEP. If Uranus is to be used as calibration source at 90 GHz, the latitude dependence of its brightness temperature needs to be taken into account.
-
2.
For Neptune, we only obtained 71 observations tied to secondary calibrators and 81 simultaneous observations with Uranus. Both show that its brightness temperature stays constant at a level of better than 8%.
Acknowledgements.
We would like to thank our referee Mark Hofstadter for helpful comments. During the 20 years 1985 - 2005, many astronomers and operators of the 30m telescope contributed to the pointing measurements. We thank the many colleagues for their contribution which, unnoticed by most of them, allowed the collection of these data. The computer division, J. Peñalver (IRAM, Spain), and M. Bremer (IRAM, Grenoble) helped efficiently in the retrieval and transfer of the data. M. Ruiz (IRAM, Spain) provided the Linux version of the program planets.References
- Baars (1973) Baars, J. 1973, IEEE Trans. Ant. Propagat., AP-21, 461
- Bevington & Robinson (1992) Bevington, P. & Robinson, D. 1992, Data reduction and error analysis for the physical sciences (McGraw-Hill, Inc.)
- Downes (1989) Downes, D. 1989, in LNP Vol. 333: Evolution of Galaxies: Astronomical Observations, ed. I. Appenzeller, H. J. Habing, & P. Lena, 351
- Greve et al. (1998a) Greve, A., Kramer, C., & Wild, W. 1998a, A&AS, 133, 271
- Greve et al. (1998b) Greve, A., Neri, R., & Sievers, A. 1998b, A&AS, 132, 413
- Greve et al. (1996) Greve, A., Panis, J.-F., & Thum, C. 1996, A&AS, 115, 379
- Griffin & Orton (1993) Griffin, M. J. & Orton, G. S. 1993, Icarus, 105, 537
- Hofstadter & Butler (2003) Hofstadter, M. D. & Butler, B. J. 2003, Icarus, 165, 168
- Klein & Hofstadter (2006) Klein, M. J. & Hofstadter, M. D. 2006, Icarus, 184, 170 (KH06)
- Lindal (1987) Lindal, G. 1987, JGR, 92, A13, 14987
- Lindal (1992) Lindal, G. 1992, AJ, 103, 967
- Moreno et al. (2001) Moreno, R., Marten, A., Biraud, Y., et al. 2001, Planet. Space Sci., 49, 473
- Perley et al. (2006) Perley, R. A., Zijlstra, A., & van Hoof, P. 2006, in Bulletin of the American Astronomical Society, Vol. 38, Bulletin of the American Astronomical Society, 1028
- Reuter & Kramer (1998) Reuter, H.-P. & Kramer, C. 1998, A&A, 339, 183
- Reuter et al. (1997) Reuter, H.-P., Kramer, C., Sievers, A., et al. 1997, A&AS, 122, 271
- Sanchez Contreras et al. (1998) Sanchez Contreras, C., Alcolea, J., Bujarrabal, V., & Neri, R. 1998, A&A, 337, 233
- Sandell (1994) Sandell, G. 1994, MNRAS, 273, 75
- Steppe et al. (1992) Steppe, H., Liechti, S., Mauersberger, R., et al. 1992, A&AS, 96, 441
- Steppe et al. (1993) Steppe, H., Paubert, G., Sievers, A., et al. 1993, A&AS, 102, 611
- Steppe et al. (1988) Steppe, H., Salter, C. J., Chini, R., et al. 1988, A&AS, 75, 317
- Ulich (1981) Ulich, B. L. 1981, AJ, 86, 1619