The X-ray luminosity function of galaxies and its evolution
Abstract
We compile one of the largest ever samples to probe the X-ray normal galaxy luminosity function and its evolution with cosmic time. In particular, we select 207 galaxies (106 late and 101 early-type systems) from the Chandra Deep Field North and South surveys, the Extended Chandra Deep Field South and the XBOOTES survey. We derive the luminosity function separately for the total (early+late), the early and the late-type samples using both a parametric maximum likelihood method, and a variant of the non-parametric method. Although the statistics is limited, we find that the total (early+late) galaxy sample is consistent with a Pure Luminosity evolution model where the luminosity evolves according to . The late-type systems appear to drive this trend while the early-type systems show much weaker evidence for evolution. We argue that the X-ray evolution of late-type systems is consistent with that of blue galaxies in the optical. In contrast there is a mismatch between the X-ray evolution of early-type systems and that of red galaxies at optical wavelengths.
1 Introduction
The Chandra and XMM missions have led to great progress in our understanding of X-ray emission processes in normal galaxies (see review by Fabbiano, 2005). The X-ray emission in the most luminous early-type systems comes mainly from hot gas, while in the less luminous ones, Low-Mass X-ray binaries (LMXRB) prevail. On the other hand, in late-type systems the X-ray binaries dominate the X-ray emission. In the most actively star-forming ones, it is the High-Mass X-ray binaries (HMXRB) in particular which dominate the X-ray energy budget. In star-forming galaxies, the total galaxy X-ray luminosity is an excellent indicator of star-formation (e.g. Ranalli et al. 2003, Gilfanov et al. 2004).
The study of the galaxy luminosity function at X-ray wavelengths provides the opportunity to study, as an ensemble, the evolution of these systems over cosmological timescales. For example, it is important to investigate whether the evolution of the X-ray emission for star-forming systems is the same as in optical and infrared wavelengths. Ghosh & White (2001) suggest that there may be a time-lag because of the onset of the LMXRB, a few Gyr after the star-burst event. In this respect the X-ray luminosity function has important implications for the evolution of X-ray binaries.
One predicament, in the construction of X-ray selected galaxy samples is that, galaxies are intrinsically X-ray faint sources. This implies that we need to probe either very deep in flux or over a wide field-of-view to gather sufficiently large samples. The deep Chandra observations in the area of the Hubble Deep Field North provided the first X-ray selected galaxy sample (Hornschemeier et al. 2003). Norman et al. (2004) derived the X-ray luminosity function finding hints for pure luminosity evolution. The study of Norman et al. (2004) pertains to the total galaxy sample i.e. including both early and late type. At the same time XMM surveys with their large field-of-view, have helped to constrain the galaxy luminosity function in the local Universe at a median redshift of (Georgakakis et al. 2004, Georgantopoulos et al. 2005, Georgakakis et al. 2006). The luminosity function is well represented by either a Schechter or a log-norm form.
Here, we present the galaxy luminosity function derived from the analysis of a large Chandra sample of galaxies consisting both of Deep Fields and wide area surveys. and are adopted.
2 Data and Method
2.1 The Data
We compile our sample from the Chandra Deep Field North and South surveys, CDF-N and CDF-S, the Extended Chandra Deep Field South (ECDF-S) and the XBOOTES survey. The 2Ms exposure of the CDF-N (Alexander et al. 2003) represents the deepest observations of the X-ray Universe ever, reaching a flux depth of in the 0.5-2 keV band but only over a small area (). The CDF-S (Giaconni et al. 2002) reaches a flux limit of while the ECDF-S (Lehmer et al. 2006) covers four ACIS-S fields at a flux limit about one order of magnitude brighter than the CDF-N. Finally, the XBOOTES survey (Kenter et al. 2005) covers an area of about 10 but reaching a flux limit about 200 times brighter than the CDF-N. The optical photometric data for the CDF-N, CDF-S, ECDF-S and XBOOTES data come from Capak et al. (2004), Zheng et al. (2004), COMBO-17 (Wolf et al. 2003) and the SDSS survey respectively.
2.2 Selection Criteria
We use sources detected in the soft 0.5-2 keV band as galaxies are preferentially soft X-ray emitters (e.g. Levenson et al. 2001). We select galaxies using the following criteria:
-
•
Low X-ray to opical flux ratio, . We choose this limit in order to minimize any possible loss of early-type galaxies at high redshift. Ptak et al. (2007) have shown that the K-correction results in an increase of the ratio of early-type systems at high redshift;
-
•
Soft X-ray Spectrum. We choose the hardness ratio, HR=(H-S)/(H+S), where H and S are the count rates in the hard and soft bands respectively, to correspond to a spectrum with a photon index of ;
-
•
Low X-ray luminosity, ; but see Tzanavaris et al. 2006
-
•
Extended optical images. All star-like sources have been discarded.
We note that our criteria are very similar to those applied by Bauer et al. (2005) in their ‘pessimistic’ galaxy sample.
2.3 The Sample
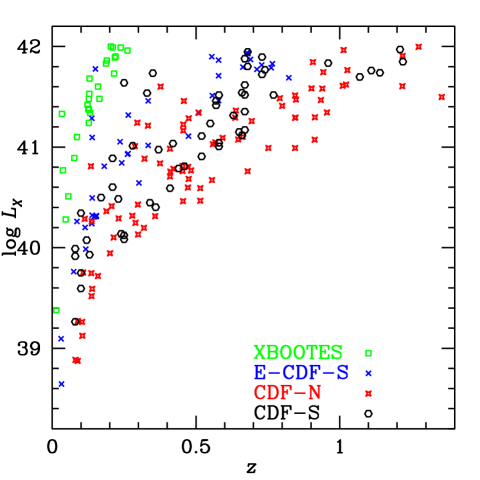
We end up with 207 sources classified as galaxies. The combination of the four surveys provides excellent coverage of the luminosity-redshift space (see Fig. 1), with the XBOOTES survey detecting luminous systems at nearby redshifts, whilst the Chandra deep fields yield less luminous systems at higher redshift. We classify our galaxies as early-type or late-type by means of the broad-band colours. We use template spectral energy distributions in HYPERZ (Bolzonella et al. 2000). HYPERZ performs a minimization to fit a template spectral energy distribution. We find 101 and 106 early and late-type galaxies, respectively.
2.4 AGN contamination
One of the most important aspects in the compilation of an X-ray galaxy sample is the possible contamination of the X-ray light from an AGN. Georgakakis et al. (2007) have explored in depth this problem. They suggest that the best approach, in the case of late-type systems, is to use mid-IR data. Then the AGN can be easily found as they present excess X-ray emission over their mid-IR emission. Unfortunately, we do not have mid-IR data available for all our fields. Nevertheless, from the CDF-N field, where Spitzer data are available, we can derive a rough estimate of the expected contamination. We find that the expected contamination is lower than 20%, for the selection criteria we used above i.e. , , .
3 The Luminosity Function
3.1 Derivation
We use the non-parametric method of Page & Carrera (2000), which is a variant of the classical method (Schmidt 1968), to produce the binned luminosity function. We also derive the luminosity function using the parametric maximum-likelihood method (Tammann et al. 1979). Although the maximum-likelihood method is usually prefered as it does not bin the data, it presents the disadvantage that the model has to be chosen a priori. Furthermore this method does not provide a goodness of fit. We fit a Schechter form to the luminosity function which is known to parameterize very well the optical luminosity function
| (1) |
where denotes the slope at faint luminosities. At bright luminosities the luminosity function drops exponentially. We assume that the characteristic luminosity evolves according to a Pure Luminosity Evolution model: where the evolution index is in the case of no evolution.
3.2 The total sample
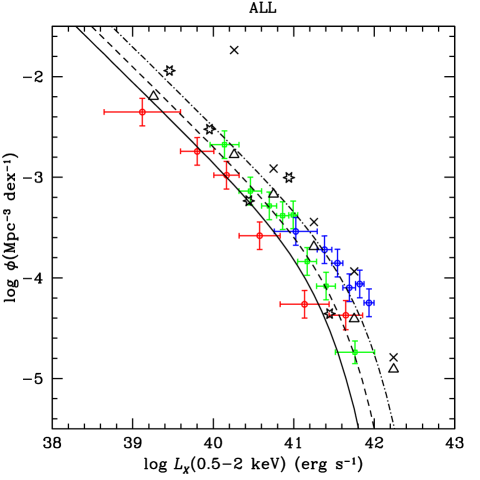
We first apply the above methods to the total sample, dividing into three redshift bins (see Fig. 2). The median redshifts for the three bins are 0.13, 0.38 and 0.78. The binned luminosity function shows a clear hint for evolution with redshift. The maximum likelihood method confirms this result. The free parameters are , and the evolution index . The evolution index derived is (see table 1).
| Sample | ||||
|---|---|---|---|---|
| Mpc-3 dex-1 | ||||
| Total | 1.24 | |||
| Early | 41.68 | 0.45 | ||
| Late | 41.23 | 0.39 |
3.3 The early and late-type samples
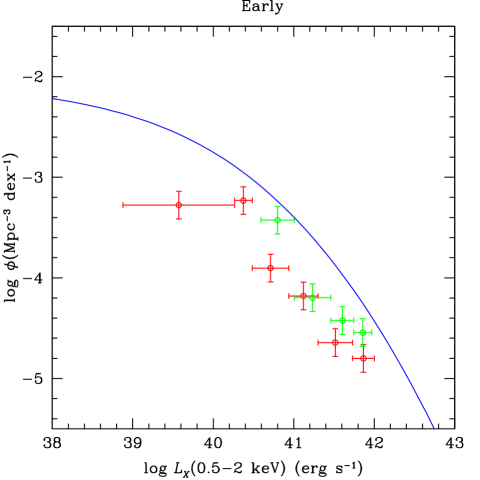
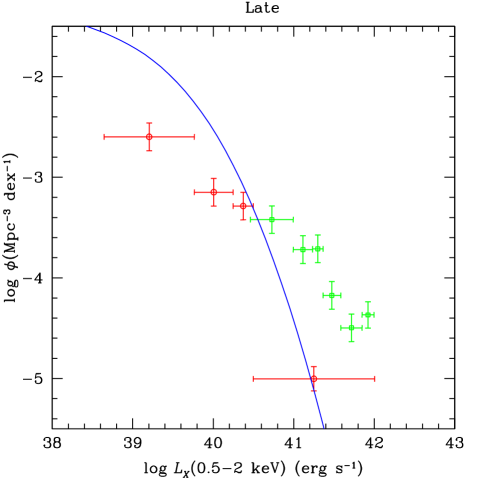
Here, we derive the luminosity function for the early and late-type samples. It is important to study the evolution separately for the two subsamples, as these may evolve in a different manner, exactly as it is the case in optical wavelengths. We divide into two redshift bins only, owing to small number statistics. The binned luminosity functions are shown in Fig. 3 both for early- and late-type galaxies. There is evidence for evolution in the late-type sample between the median redshifts of the two bins z=0.14 and z=0.67. In contrast, there is no clear evidence for evolution in the case of early-type galaxies. Admittedly, from the inspection of the binned luminosity function, it is very difficult to tell whether the evolution can be described by Pure Luminosity evolution alone. Some density evolution especially at bright luminosities may also be taking place.
The maximum-likelihood results (assuming Pure Luminosity evolution) are given in table 1. Note that because of small number statistics and the large number of free parameters, the characteristic luminosity was fixed to the value derived in the local luminosity function of Georgantopoulos et al. (2005).
It is interesting to compare our results with the X-ray luminosity function predicted from the optical data (solid line in Fig. 3). This predicted X-ray luminosity function can be estimated as the convolution of the optical luminosity function and the relation for the corresponding sample of galaxies (e.g. Georgantopoulos et al. 1999). We use the optical luminosity functions from the SDSS (Nakamura et al. 2004) and the relations in Shapley et al. (2001). It appears that the optical luminosity functions do not provide a good match to the actual X-ray data, at least in the case of the early-type sample. The optical luminosity function gives an excess of low luminosity late-type objects. On the other hand the optical luminosity function predicts a larger density of early-type galaxies than actually observed at all luminosities.
4 Discussion
4.1 The cosmic evolution
The X-ray luminosity function for galaxies has been derived for the first time by Norman et al. (2004). They used data from the Chandra Deep Fields (CDF-N and CDF-S) but without discriminating for early and late type systems. Norman et al. (2004) find strong pure luminosity evolution with an evolution index . Recently, Ptak et al. (2007) constructed again the luminosity function in the same fields. Their more conservative selection criteria result in a smaller sample compared to that of Norman et al. (2004). They derive the non-parametric luminosity function separately in various redshift bins, estimating the evolution index from the difference in the . Their late-type sample shows strong Pure Luminosity Evolution, with . In the case of the early-type sample they find some mild evolution , which however is not inconsistent with our results. Georgakakis et al. (2006) derived the evolution in the Chandra Deep Fields using number counts, again separately for early- and late-type samples. They found evolution only for late-type systems () while the early-type ones are consistent with no evolution (). Georgakakis et al. (2007) applying a very careful galaxy selection, aiming to minimize AGN contamination, find an evolution index of for the star-forming galaxies in the CDF-N. From the above, it appears then that the results are converging as far as the evolution is concerned: under the assumption of luminosity evolution the late-type systems evolve strongly, while the early-type ones show milder or possibly no evolution. However, clearly better statistics is needed to test whether more complex forms of evolution take place, as for example Luminosity Dependent Density Evolution.
4.2 Interpretation and Comparison with the optical
The optical luminosity function has been derived by Faber et al. (2007) for blue and red galaxies using DEEP2 data. They find that both blue systems evolve vigorously over cosmic time between a redshift of z=1 and today, following pure luminosity evolution with . The red galaxies evolve in a different manner. Although their luminosity function evolves in luminosity in a similar fashion,its normalization is higher at redshift z=0. Now assuming that roughly the blue galaxies correspond to our late-type systems and the red to the early-type ones, we can make a comparison between the galaxy evolution probed in X-ray and optical wavelengths. The late-type galaxies have a very similar evolution in both the optical and the X-ray regime. This suggests that the X-ray emission in these galaxies is dominated by HMXRB. Indeed HMXRB evolve on Myr scale and therefore they trace closely the bulk of the optical and IR emission coming from massive stars. In contrast, there is a mismatch in the evolution of early-type systems witnessed in optical and X-ray wavelengths. The absence of vigorous evolution in X-ray wavelengths between z=0.7 and today ( Gyr), is much longer than the expected lifetimes of LMXRBs (Gyr), placing interesting constraints on the formation of these systems.
References
- [1] Alexander, D.M. et al. 2003, AJ, 126, 539
- [2] Bauer, F. et al. 2004, AJ, 128, 2048
- [3] Bolzonella, M., Miralles, J.M., Pello, R., 2000, A&A, 363, 476
- [4] Capak, P. et al. 2004, AJ, 127, 180
- [5] Faber, S.M. et al. 2007, ApJ, 665, 265
- [6] Fabianno et al. 2006, ARA& A, 44, 323
- [7] Georgakakis, A. et al. 2004, MNRAS, 354, 123
- [8] Georgakakis, A., Georgantopoulos, I., Akylas, A., Zezas, A., 2006, ApJ, 641, L101
- [9] Georgakakis, A., Rowan-Robinson, M., Babbedge, T., Georgantopoulos, I., 2007, MNRAS, 377, 203
- [10] Georgantopoulos, I., Basilakos, S., Plionis, M., 1999, MNRAS, 305, L31
- [11] Georgantopoulos, I., Georgakakis, A., Koulouridis, E., 2005, MNRAS, 360, 782
- [12] Ghosh, P. & White, N.E., 2001, ApJ, 559, L97
- [13] Giaconni, R. et al. 2002, ApJS, 139, 369
- [14] Gilfanov, M., Grimm, H.-J., Sunyaev, R., 2004, MNRAS, 347, L57
- [15] Hornschemeier, A. et al. 2003, AJ, 126, 575
- [16] Kenter, A. et al. 2005, ApJS, 161, 9
- [17] Kim, D.-W., et al. 2006, ApJ, 644, 829
- [18] Levenson, N.A., Weaver, K.A., Heckmann, T., 2001, ApJ, 550, 230
- [19] Nakamura, O., Fukugita, M., Brinkmann, J., Schneider, D.P., 2004, AJ, 127, 2511
- [20] Norman, C. et al. 2004, ApJ, 607, 721
- [21] Page, M. & Carrera, F., 2000, MNRAS, 311, 433
- [22] Ptak, A., Mobasher, B., Hornschemeier, A., Bauer, F., Norman C., 2007, ApJ submitted (astro-ph/07061791)
- [23] Ranalli, P., Comastri, A., Setti, G., 2003, A&A, 399, 39
- [24] Schmidt, M. 1968, ApJ, 151, 393
- [25] Shapley, A., Fabbiano, G., Eskridge, P.B., 2001, ApJS, 137, 139
- [26] Tammann, G.A., Yahil, A., & Sandage, A., 1979, ApJ, 234, 775
- [27] Tzanavaris, P., Georgantopoulos, I., Georgakakis, A., 2006, A&A, 454, 447
- [28] Wolf, C. et al., 2003, A&A, 401, 73
- [29] Zheng, W. et al. 2004, ApJS, 155, 73