The galaxy luminosity function and its evolution with Chandra
Abstract
Aims. We have compiled one of the largest normal-galaxy samples ever to probe X-ray luminosity function evolution separately for early and late-type systems.
Methods. We selected 207 normal galaxies up to redshift , with data from four major Chandra X-ray surveys, namely the Chandra deep fields (north, south and extended) and XBootes, and a combination of X-ray and optical criteria. We used template spectral energy-distribution fitting to obtain separate early- and late-type sub-samples, made up of 101 and 106 systems, respectively.
For the full sample, as well as the two sub-samples, we obtained luminosity functions using both a non-parametric and a parametric, maximum-likelihood method.
Results. For the full sample, the non-parametric method strongly suggests luminosity evolution with redshift. The maximum-likelihood estimate shows that this evolution follows , . For the late-type sub-sample, we obtained . We detected no significant evolution in the early-type sub-sample. The distributions of early and late-type systems with redshift show that late types dominate at and hence drive the observed evolution for the total sample.
Conclusions. Our results support previous results in X-ray and other wavebands, which suggests luminosity evolution with .
Key Words.:
Surveys; Galaxies: luminosity function, mass function; X-rays: galaxies; X-rays: binaries1 Introduction
Non-AGN dominated (“normal”) galaxies have intrinsically weak X-ray luminosities and correspondingly faint fluxes. Thus, it is only with the most recent, new-generation X-ray missions, Chandra and XMM-Newton, that such galaxies have been detected in cosmologically significant redshifts (). The first such X-ray selected sample was obtained with the Chandra Deep Fields North and South (CDF-N, CDF-S; Alexander et al., 2003; Giacconi et al., 2002), reaching fluxes of erg cm-2 s-1(see also Hornschemeier et al., 2003). Based on these observations, Norman et al. (2004) obtained an X-ray luminosity function (XLF) of normal galaxies, characterised by luminosity evolution that follows .
A population of rapidly evolving, star-forming galaxies has been detected in recent years in other wavebands (e.g. Hopkins, 2004, and references therein). However, observations in the X-ray band provide unique insight into physical processes, complementing information obtained from other wavelength regions. In the most massive and luminous early-type galaxies, the X-ray emission is dominated by the hot interstellar medium (ISM) at keV, with a smaller fraction contributed by low-mass X-ray binaries (LMXBs) associated with the old stellar population. However, for fainter X-ray systems, the evidence suggests that LMXBs may well be the dominant X-ray emitting component (e.g. Sarazin et al., 2000; Kim & Fabbiano, 2003, and references therein).
On the other hand, the X-ray emission in late-type galaxies is mainly due to a mixture of low- and high-mass X-ray binaries (HMXBs) with a contribution from hot gas ( keV) (see Fabbiano, 2006, for a comprehensive review).
Understanding how these populations of binary stars and, consequently, their X-ray luminosity evolve with time is obviously closely linked to XLF normal-galaxy evolution. Considering LMXBs and HMXBs as the overall dominant component in X-ray emission from normal galaxies, Ghosh & White (2001) adopt a semi-empirical approach to link X-ray-binary lifetimes with star-formation rates (SFRs) in a cosmological context. They show that evolving SFRs significantly affect X-ray binary populations, hence, integrated X-ray galactic emission, with the possibility of significant evolution in X-ray luminosities even in relatively low redshifts (see also White & Ghosh, 1998). They predict different galaxy evolution rates at X-ray wavelengths, as compared to other wavelength regions, which depend on the star-formation history of the Universe, as well as evolutionary timescales for LMXBs and HMXBs. Conversely, if the X-ray evolution of normal galaxies is known, one may obtain insight into properties such as the characteristic timescales of LMXBs and HMXBs. For instance, if HMXBs tracing the instantaneous SFR dominate the integrated X-ray emission, the total X-ray luminosity is expected to follow the star-formation history of the Universe as observed in the optical and IR bands. On the contrary, LMXBs have much longer evolutionary timescales, and the integrated X-ray luminosity of normal galaxies would present a time delay of the order of Gyr compared to optical and IR observations. Constraining the number density and evolution of LMXBs is also relevant to the LISA gravitational wave mission, as this will be sensitive to gravitational radiation from binaries with periods shorter than 4 hours. Such sources are primarily LMXBs. Determining LMXB evolutionary timescales can thus provide information on the number of expected LISA detections.
As the relative contribution of LMXBs and HMXBs to the integrated X-ray luminosity of normal galaxies closely depends on galaxy type, it is imperative to disentangle XLF behaviour among different galaxy types. Unfortunately, because of the scarcity of X-ray-detected normal galaxies, it is not surprising that very few results have been obtained. Using moderate size samples, Georgantopoulos et al. (2005) and Georgakakis et al. (2006b) calculated XLFs separately for early-type/absorption-line and late-type/emission-line galaxies. By comparing the predictions of the latter XLF with observed normal-galaxy number counts, Georgakakis et al. (2006a) detected luminosity evolution proportional to for late types, driven by sources with . Georgakakis et al. (2007) then compared the predictions of this XLF with observed counts for galaxies selected by exploitation of the tight X-ray-IR correlation and detected luminosity evolution proportional to for their sample of star-forming galaxies. Recently, Ptak et al. (2007) have used the GOODS survey to obtain 40 early-type and 46 late-type galaxies up to a redshift . Their XLFs suggest luminosity evolution proportional to for early types and for late types.
In this paper we aim to substantially increase the numbers of X-ray detected normal galaxies, to be able to investigate XLF evolution separately for different galaxy types. We compiled one of the largest normal galaxy samples ever, and, for the first time, probed redshift evolution directly and independently for early and late-type systems.
The structure of this paper is as follows: In Sect. 2 we describe galaxy selection for our sample. In Sect. 3 we present our XLFs, obtained using two different methods. We present our results in Sect. 4, and discuss them in Sect. 5. We conclude with predictions related to future observations and missions in Sect. 6.
2 Sample selection
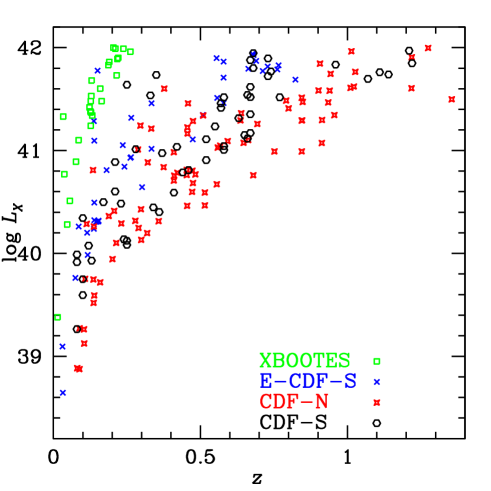
We compiled our galaxy sample by cross-correlating four major X-ray surveys with optical surveys overlapping in sky coverage. We used the Extended Chandra Deep Field South (E-CDF-S), the Chandra Deep Fields, North and South (CDF-N, CDF-S), as well as the XBootes survey. We first identified X-ray and optical counterparts and then used a number of selection criteria to sift out normal-galaxy candidates from AGN.
2.1 Galaxy selection criteria
To apply the selection criteria described below, we required X-ray luminosities in the soft band 0.52.0 keV, (0.52.0), as well as hardness ratios, defined by
| (1) |
Here, represents counts in the soft energy band, keV, and counts in the hard energy band, keV. We calculated the former by using the flux information in the X-ray catalogues and the redshift information in the optical catalogues. For E-CDF-S and CDF-N sources, we calculated hardness ratios by using the soft, 0.52.0 keV, and hard, 2.08.0 keV, count information in the catalogues. For CDF-S and XBootes, we used the harndess ratios given in the catalogues.
To separate NGs from AGN, we used all of the following criteria in conjunction:
-
•
We demanded that X-ray sources be detected in the 0.5-2.0 keV X-ray band, as non-AGN are preferentially soft X-ray emitters (e.g., Levenson et al., 2001).
-
•
We imposed upper limits to
-
–
the logarithmic X-ray-to-optical flux ratio, so that . The optical flux was calculated separately using the filter function for filters used in each survey. This choice was motivated by the fact that some massive ellipticals will be missed by a choice like (Tzanavaris et al., 2006), combined with the observation by Georgakakis et al. (2006a) that it is the galaxies that drive XLF evolution. The choice also took the increasing importance of -correcting with redshift into account.
-
–
the X-ray luminosity, so that erg s-1;
-
–
the hardness ratio, so that HR (E-CDF-S and CDF-N), 0.0055 (CDF-S), or (XBootes). The last two values are due to the slightly different upper bounds of the hard band in these catalogues and correspond to HR=0 for a 2.08.0 keV hard band and a power law with ;
-
–
-
•
Finally, we used galaxy-type classification results from the optical surveys, and performed individual visual checks to keep sources that are clearly not stellar-like.
2.2 X-ray and optical counterparts
2.2.1 E-CDF-S
We cross-correlated the E-CDF-S (Lehmer et al., 2005) with the COMBO-17 survey (Wolf et al., 2004), identifying X-ray/optical counterpart pairs the members of which are within 3″ of each other. By applying the galaxy selection criteria described above, we identified 41 sources, with a median redshift = 0.264.
2.2.2 CDF-N
2.2.3 CDF-S
2.2.4 XBootes
We cross-correlated the XBootes X-ray point source catalogue (Kenter et al., 2005) with the Sloan Digital Sky Survey, Data Release 5 (SDSS, DR5), identifying X-ray/optical counterparts within 3″ of each other. We thus identified 28 sources, with = 0.128.
3 The luminosity function
3.1 Non-parametric method
We used the method of Page & Carrera (2000) to derive the binned normal galaxy XLF. This is a variant of the classical non-parametric method (Schmidt, 1968) and has the advantage of being least affected by systematic errors for sources close to the flux limit of the survey.
We estimated the function in a luminosity-redshift interval using the relation
| (2) |
where represents the number of sources with luminosities in the range to , and is the volume element for a redshift increment . For a given luminosity , and are the minimum and maximum redshifts for a source of that luminosity to remain both within the flux limits of the survey and the redshift interval. Note that the solid angle , available for a source with luminosity at redshift , corresponding to a given flux in the area curve, also enters the calculation via the volume element. The logarithmic bin size of the function varies so that each bin comprises approximately equal numbers of sources . From Poisson statistics, the uncertainty of each luminosity bin is
| (3) |
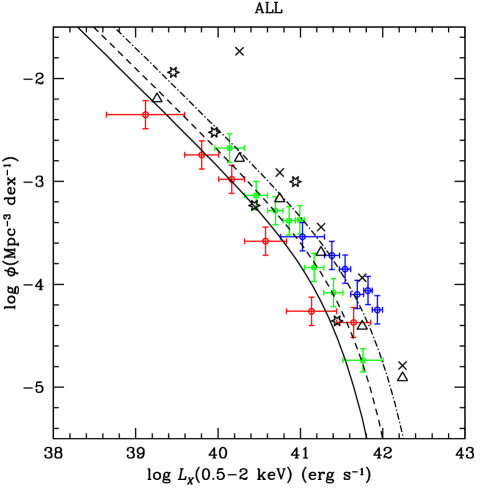
We first applied this method to our total sample. To investigate luminosity function evolution, we estimated the luminosity function independently in three different redshift intervals, given in Table 1 together with their corresponding median redshifts. These were chosen empirically to contain roughly equal numbers of galaxies and to bring out any evolutionary effects as clearly as possible. The results are shown in Fig. 3 where there is a clear hint of evolution with redshift. We also note redshift-dependent incompleteness because less luminous sources are missed at higher redshift.
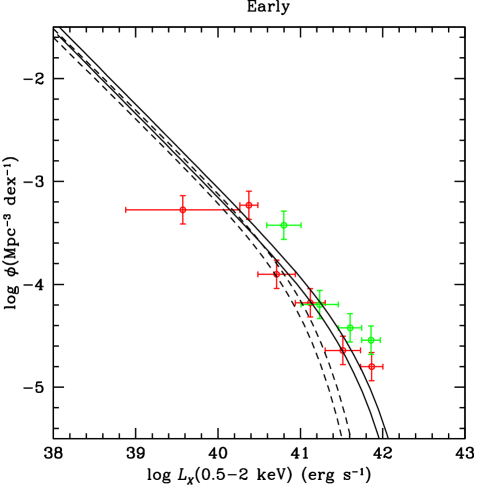
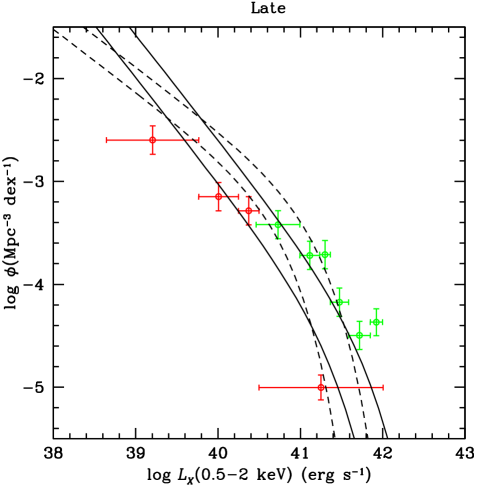
As explained, we were interested in investigating XLF behaviour as a function of not only redshift, but also of galaxy type. We separated our galaxies into early and late-type systems by using broad-band colour information in several filters, obtained from the optical catalogues. We used the software hyperz (Bolzonella et al., 2000), which performs minimisation to select a template spectral energy-distribution (SED), which provides the best fit to a source’s photometric SED. Although the primary goal of hyperz is to obtain redshift information, the best-fit template SED for a given source is equivalent to an early/late-type classification. We used 61 template SEDs, which were smoothly interpolated from four original galaxy SEDs, as described in Sullivan et al. (2004). These templates have indices that increase with galaxy type from early to late. We classified galaxies as early types, if the best-fit SED had index between 0 and 25, and as late types otherwise. We thus found that our total sample was split into two roughly equal sub-samples, comprising 101 early-type and 106 late-type systems. We then proceeded to estimate the binned non-parametric luminosity function as before for each sub-sample. As the number of galaxies was smaller by a factor of , we only used two redshift bins (Table 1).
3.2 Parametric method
We also derived the luminosity function by means of the parametric maximum-likelihood method (ML; Tammann et al., 1979). The advantage of this method is its independence from a sample’s homogeneity. It also allows us to quantify the observed evolution by means of an evolution index, , as explained below. Its disadvantage is that the function is assumed to have a certain form, with no possibility of checking the goodness of fit. We adopted a Schechter (1976) form for the luminosity function,
| (4) |
which is known to fit optical luminosity functions well. We parametrised the characteristic luminosity where the function changes from a power law with slope to an exponential drop at high luminosities as , where the evolution index if at all redshifts. The probability that a galaxy is detected with luminosity is given by . We constructed the likelihood function as and maximised in space, by varying , and . Errors (90%) were estimated from the regions about the ML fit where the likelihood changes by 1.3 (Avni, 1976). As the normalisation cancels out in this calculation, it was derived via
| (5) |
Here, is the number of galaxies in the redshift interval, where ML estimation had been performed.
To illustrate our ML fit results, we used the best-fit parameters to calculate the luminosity function for the median redshifts that correspond to the distinct redshift intervals used in the non-parametric method, as explained in the next section.
4 Results
We plot the results of the non-parametric method in Figures 3, 4, 5, 6, and 7. In the same plots we also show curves illustrating the results of the ML fits. These curves are produced using the ML results shown in Table 2 and the median redshifts of each redshift interval used in the non-parametric method (Table 1). Note that Figs. 4 and 5 show the same results as Figs. 6 and 7, the difference being that the first pair is for different galaxy types, whilst the second pair is for different redshift intervals.
The results of the non-parametric method for the full sample (Fig. 3) show an indication of evolution with redshift. Although some incompleteness inevitably sets in at higher redshift, the trend is unmistakable. ML fitting quantifies this evolution with an index . The results for the early sample (Fig. 4), however, tell a different story. First, taking the errors into account, the results of the non-parametric method offer no hint of evolution between the two redshift intervals. This agrees with the results from ML fitting, according to which the evolution index is consistent with zero. The late-type results (Fig. 5) complete the picture. There is an apparent gap between dark grey/red and light grey/green points, which are obtained with the non-parametric method for different redshift intervals. According to the ML method, this corresponds to an evolution index .
5 Discussion
5.1 Comparison with previous results
To probe XLF evolution for different galaxy types, large numbers are necessary. Georgantopoulos et al. (2005) used 46 galaxies to construct XLFs for emission- and absorption-line systems. However, their results were for a single redshift bin . Georgakakis et al. (2006b) had 67 galaxies, likewise limited to a single redshift bin . Although Norman et al. (2004) had a large sample of 210 galaxies, they constructed no galaxy-type specific sub-samples. It is thus the first time that XLFs were calculated directly for early and late-type normal galaxies. The large size of our total sample allows splitting into three redshift bins that, in turn, strongly suggest evolution with redshift. After repeating the procedure separately for early and late-type systems, we detected no evolution for early types and strong evolution for late types.
Our results are mostly in good agreement with related work in the literature. The results for 36 normal galaxies () by Kim et al. (2006) are shown by stars in Fig. 3. The results from Norman et al. (2004) for two redshift bins are also shown. When compared to our results, these show an apparent systematic shift to higher luminosities, which might suggest AGN contamination. Note, however, that for the sake of clarity we do not show errors from Norman et al. (2004), which would bring their points and, in particular, the apparently markedly discrepant point at into better agreement with ours.
In Figs. 4 and 5 we also show the results for early- and late-type galaxies by Georgakakis et al. (2006b). We constructed the XLF curves by using the function parameters quoted by these authors, but also imposed luminosity evolution following the values we found in the present paper. For early types we see that our largest sample cannot be adequately parametrised by their XLF, which shows too steep an exponential cutoff. The late-type XLF shows broad agreement with our non-parametric bins, but it is clearly not a good representation of our data. The discrepancies, especially for early types, may partly stem from these authors using a selection criterion , thus obtaining fewer luminous sources.
5.2 Evolution
The fact that late-type galaxies are driving the observed evolution of the total sample can be understood if we look at the redshift distributions of the two galaxy types. The histograms in Fig. 8 show the observed distributions: Early-types dominate in the lowest redshift bins, whilst late-types dominate at intermediate redshifts. A Kolmogorov-Smirnov (KS) test shows that the two distributions differ significantly. The probability that the value of the KS statistic obtained may be due to chance alone is very small, . The observed trend is also corroborated by theoretical distributions, shown by curves in the same figure, which we construct using our ML fit parameters together with the area curve information of our data. Qualitatively, this also agrees with the results of Bundy et al. (2005). These authors used a large sample from the Great Observatories Origins Deep Survey (GOODS) fields to probe mass assembly of morphologically distinct normal galaxies. They found an increasing proportion of early-type systems with decreasing redshift from to 0, which is similar to what we see in our redshift distribution.
Furthermore, we found that it is the late types with highest that are mostly responsible for the observed trend. In Fig. 8 we see that numbers for late-types appear to rise after . Out of 53 late-type systems at , 39, or 74%, have . This finding agrees with the claim by Georgakakis et al. (2006b) that their deduced evolution stems primarily from such sources. It also provides a posteriori justification of our upper-limit choice () in the selection criteria for the present sample. We cannot exclude that this observation is, at least partially, a consequence of a selection effect. Given the steep relation for spirals (Shapley et al., 2001), we might expect to preferentially detect intrinsically brighter galaxies at higher redshift, which would lead to a selection against low values. Even so, that we see bright late-types may still be significant. As Tzanavaris et al. (2006) have shown, at lower redshift, bright galaxies with are mostly early-type.
It is encouraging that our luminosity evolution estimates are in good agreement with results by other authors. Taken together, Norman et al. (2004), Hopkins (2004), Ranalli et al. (2005), Georgakakis et al. (2006a), Georgakakis et al. (2007), Ptak et al. (2007), as well as the present paper, lead to a broad consensus that the data are consistent with luminosity evolution with an index .
In particular, Hopkins (2004) investigates luminosity function evolution for a sample of radio-selected star-forming galaxies by combining constraints from the global SFR density evolution with those from the 1.4 GHz radio source counts at submillijansky levels. He finds luminosity evolution for star-forming galaxies. Given the tight correlation between radio, far infrared, and X-ray luminosity functions (Ranalli et al., 2003), the agreement of this result with our result for late-type systems is particularly significant for two reasons. Firstly, it supports our main result that late-type systems are driving the overall redshift evolution of normal galaxies in the local Universe. Secondly, as our normal galaxy selection criteria are independent of those for 1.4 GHz sources, it suggests that any AGN contamination is unlikely to have had significant impact on our XLFs.
Georgakakis et al. (2007) obtained essentially the same evolution index for late-types, , by employing methods largely independent of ours. Because they used X-ray-IR correlations which hold for normal galaxies, but not for AGN, their sample is virtually guaranteed to be free of AGN contamination. Although their sample is times smaller than ours, the agreement in the evolution index is, once more, significant. Ranalli et al. (2005) showed that the blue galaxy luminosity function for the 25,000-strong spiral galaxy sample of Wolf et al. (2003) requires a pure luminosity evolution index . This is also consistent with our results, under the assumption that blue galaxies are largely the same population as the late-type systems in our sample. Ptak et al. (2007) jointly fitted low and high-redshift XLFs, obtaining pure-luminosity evolution with and . These authors used Bayesian techniques and a Monte Carlo Markov chain analysis. The agreement, at least for late-types, is thus particularly encouraging.
Comparisons with results for red galaxies are less straightforward. Assuming that our early-type galaxies are the same population as red galaxies in optical surveys, with no significant dust contamination, that, unlike Ptak et al. (2007), we do not measure significant evolution for early-type galaxies, disagrees at face value with the observed evolution in optical wavebands (Brown et al., 2007; Wolf et al., 2003). However, this is consistent with models that predict a fast decline in luminosities at optical wavelengths, with X-ray luminosities remaining high for Gyr (Eracleous et al., 2006), in systems with a significant contribution from LMXBs. White & Ghosh (1998) predict that the combined effect of LMXBs and HMXBs may lead to a ‘twin peak’ in the evolving XLF of normal galaxies; due to HMXBs, the first peak would be expected to occur close to the SFR peak at . The second peak would be delayed until , due to delayed turn-on of LMXBs. To first order, our early-type systems are dominated by LMXBs, which could mean that we may approximately be witnessing this second peak. However, this approximation may be inadequate, even to first order, due to the caveat that the most luminous systems are dominated by the hot ISM. Similarly, our late-type systems are dominated by HMXBs, whose X-ray luminosity has peaked at high , and we are witnessing their dimming at lower redshifts. Indeed, an evolution index is consistent with ‘Peak-M’ models, which are characterised by longer evolutionary timescales for LMXBs (Ghosh & White, 2001, Table 2).
5.3 Comparison with AGN
It is not clear whether this scenario is consistent with results for the XLF evolution of AGN-dominated systems. Ueda et al. (2003) and La Franca et al. (2005) found that luminosity-dependent density evolution explains their XLFs best. They showed that XLFs for luminous AGN peak at higher redshifts than for less luminous ones. By assuming that SMBH growth is closely linked to starburst activity, Ueda et al. (2003) linked this to normal-galaxy evolution in a first-order scenario, where luminous AGN once lived in what later became early-type galaxies. Their AGN activity peaked at high , following strong starbursts, and decreased rapidly after . On the other hand, galaxies that hosted less luminous AGN at high have smaller spheroids, i.e. are of later type. Their star-formation peaks at lower , and so does their AGN activity, peaking at .
We did not specifically investigate luminosity-dependent density evolution in this paper. As explained in the previous section, our results supporting pure-luminosity evolution are corroborated by a number of different authors using a variety of data and techniques. This would then cast doubt on a general, unified evolutionary scheme, encompassing both AGN and normal galaxies.
Even so, it is possible to make our results broadly consistent with these AGN evolutionary models, at least in a qualitative sense. Thus early types that, presumably, correspond to bright AGN/high star-formation at high redshift would be expected to show declining luminosities at the redshifts we probe. That we detect no such evolution is already explained by the possibility of delayed LMXB evolution. For late types, we do detect declining luminosities. As the AGN peak redshift is within the range probed by our sample, our selection criteria naturally exclude any AGN, instead picking galaxies whose AGN is either switching off or makes a very low contribution to the total luminosity.
6 Predictions for deeper Chandra and XEUS observations
The CDFs have allowed us, for the first time, to obtain a couple of hundred X-ray-detected normal galaxies at cosmologically interesting redshifts. In turn, we are now starting to detect galaxy-type dependent evolution. However, compared to results in other (e.g. optical) wavelength bands, X-ray work still suffers severely from small numbers. Incompleteness at high redshift is evident, and uncertainties large. It is thus imperative to obtain larger and deeper samples for exploring normal galaxy evolution in greater detail.
In Fig. 9 we present results from various number count distributions as a function of soft X-ray flux including observed CDF counts, which come both from AGN and normal galaxies, observed galaxy counts, and a theoretical distribution, which we calculated using our MLE results. With data from a 4 Ms CDF-N exposure, sources per square degree would be detected with fluxes erg cm-2 s-1. Galaxies with luminosities log would then be detectable out to . The brightest galaxies, log would extend the redshift range to .
Such exposure-time requirements may well prove prohibitive in practice. ESA’s planned X-ray Evolving Universe Spectroscopy (XEUS) mission will be able to offer an impressive increase in detected number within realistic time constraints. Using our evolving luminosity function with no evolutionary break at high redshift, we estimate that, just with a single 1 Ms exposure, counts from normal galaxies (see Fig. 9) will exceed per square degree for sources with fluxes erg cm-2 s-1. In this case log galaxies will be detectable to and log ones to , thus finally paving the way for a study of the high-redshift normal-galaxy XLF. This is consistent with the fluctuation analysis results of Miyaji & Griffiths (2002), who show that soft-band counts for all sources (i.e. including AGN) continue growing with decreasing flux. As our analysis specifically targets normal galaxies, this result implies that counts from normal galaxies will overtake AGN at fluxes erg cm-2 s-1.
7 Summary
In this paper we have shown the importance of increasing numbers of X-ray-luminous normal galaxies for probing XLF behaviour as a function of both redshift and galaxy type. We selected 207 normal galaxies (101 early-type and 106 late-type) from the three Chandra deep fields and XBootes. Our major results are:
-
1.
Both methods of XLF estimation, parametric and non-parametric suggest that the full galaxy sample is consistent with pure luminosity evolution, which is driven exclusively by evolution of late-type systems.
-
2.
The evolution index , where , is for the full sample, for the late-type sample, and for the early-type sample.
-
3.
Our results agree broadly with results from other work.
-
4.
We estimate that, with a 1 Ms exposure with XEUS, counts from normal galaxies will overtake AGN at faint fluxes and will allow probing XLF evolution to high-redshift.
8 Acknowledgements
We thank Antonis Georgakakis for making his luminosity function fitting code available to us. This work is funded in part by the Greek National Secretariat for Research and Technology within the framework of the Greece-USA collaboration programme Study of Galaxies with the Chandra X-ray Satellite. We acknowledge the use of data from the XMM-Newton Science Archive at VILSPA, the Chandra-XAssist archive, and the 2dfGRS. This research has made use of data obtained from the High Energy Astrophysics Science Archive Research Center (HEASARC), provided by NASA’s Goddard Space Flight Center. This research made use of the NASA/IPAC Extragalactic Database (NED) operated by the Jet Propulsion Laboratory, California Institute of Technology, under contract with the National Aeronautics and Space Administration.
Funding for the Sloan Digital Sky Survey (SDSS) and SDSS-II is provided by the Alfred P. Sloan Foundation, the Participating Institutions, the National Science Foundation, the U.S. Department of Energy, the National Aeronautics and Space Administration, the Japanese Monbukagakusho, the Max Planck Society, and the Higher Education Funding Council for England. The SDSS Web site is http://www.sdss.org/. The SDSS is managed by the Astrophysical Research Consortium (ARC) for the Participating Institutions, which are are the American Museum of Natural History, Astrophysical Institute Potsdam, University of Basel, University of Cambridge, Case Western Reserve University, The University of Chicago, Drexel University, Fermilab, the Institute for Advanced Study, the Japan Participation Group, The Johns Hopkins University, the Joint Institute for Nuclear Astrophysics, the Kavli Institute for Particle Astrophysics and Cosmology, the Korean Scientist Group, the Chinese Academy of Sciences (LAMOST), Los Alamos National Laboratory, the Max-Planck-Institute for Astronomy (MPIA), the Max-Planck-Institute for Astrophysics (MPA), New Mexico State University, Ohio State University, University of Pittsburgh, University of Portsmouth, Princeton University, the United States Naval Observatory, and the University of Washington.
References
- Alexander et al. (2003) Alexander, D. M., Bauer, F. E., Brandt, W. N., et al. 2003, AJ, 126, 539
- Avni (1976) Avni, Y. 1976, ApJ, 210, 642
- Barger et al. (2003) Barger, A. J., Cowie, L. L., Capak, P., et al. 2003, AJ, 126, 632
- Bauer et al. (2004) Bauer, F. E., Alexander, D. M., Brandt, W. N., et al. 2004, AJ, 128, 2048
- Bolzonella et al. (2000) Bolzonella, M., Miralles, J.-M., & Pelló, R. 2000, A&A, 363, 476
- Brown et al. (2007) Brown, M. J. I., Dey, A., Jannuzi, B. T., et al. 2007, ApJ, 654, 858
- Bundy et al. (2005) Bundy, K., Ellis, R. S., & Conselice, C. J. 2005, ApJ, 625, 621
- Capak et al. (2004) Capak, P., Cowie, L. L., Hu, E. M., et al. 2004, AJ, 127, 180
- Eracleous et al. (2006) Eracleous, M., Sipior, M. S., & Sigurdsson, S. 2006, in IAU Symposium, Vol. 230, Populations of High Energy Sources in Galaxies, ed. E. J. A. Meurs & G. Fabbiano, 417–422
- Fabbiano (2006) Fabbiano, G. 2006, ARA&A, 44, 323
- Georgakakis et al. (2006a) Georgakakis, A., Georgantopoulos, I., Akylas, A., Zezas, A., & Tzanavaris, P. 2006a, ApJ, 641, L101
- Georgakakis et al. (2007) Georgakakis, A., Rowan-Robinson, M., Babbedge, T. S. R., & Georgantopoulos, I. 2007, MNRAS, 377, 203
- Georgakakis et al. (2006b) Georgakakis, A. E., Chavushyan, V., Plionis, M., et al. 2006b, MNRAS, 367, 1017
- Georgantopoulos et al. (2005) Georgantopoulos, I., Georgakakis, A., & Koulouridis, E. 2005, MNRAS, 360, 782
- Ghosh & White (2001) Ghosh, P. & White, N. E. 2001, ApJ, 559, L97
- Giacconi et al. (2002) Giacconi, R., Zirm, A., Wang, J., et al. 2002, ApJS, 139, 369
- Hopkins (2004) Hopkins, A. M. 2004, ApJ, 615, 209
- Hornschemeier et al. (2003) Hornschemeier, A. E., Bauer, F. E., Alexander, D. M., et al. 2003, AJ, 126, 575
- Kenter et al. (2005) Kenter, A., Murray, S. S., Forman, W. R., et al. 2005, ApJS, 161, 9
- Kim et al. (2006) Kim, D.-W., Barkhouse, W. A., Romero-Colmenero, E., et al. 2006, ApJ, 644, 829
- Kim & Fabbiano (2003) Kim, D.-W. & Fabbiano, G. 2003, ApJ, 586, 826
- La Franca et al. (2005) La Franca, F., Fiore, F., Comastri, A., et al. 2005, ApJ, 635, 864
- Lehmer et al. (2005) Lehmer, B. D., Brandt, W. N., Alexander, D. M., et al. 2005, ApJS, 161, 21
- Levenson et al. (2001) Levenson, N. A., Weaver, K. A., & Heckman, T. M. 2001, ApJ, 550, 230
- Miyaji & Griffiths (2002) Miyaji, T. & Griffiths, R. E. 2002, ApJ, 564, L5
- Norman et al. (2004) Norman, C., Ptak, A., Hornschemeier, A., et al. 2004, ApJ, 607, 721
- Page & Carrera (2000) Page, M. J. & Carrera, F. J. 2000, MNRAS, 311, 433
- Ptak et al. (2007) Ptak, A., Mobasher, B., Hornschemeier, A., Bauer, F., & Norman, C. 2007, arXiv:0706.1791v1
- Ranalli et al. (2003) Ranalli, P., Comastri, A., & Setti, G. 2003, A&A, 399, 39
- Ranalli et al. (2005) Ranalli, P., Comastri, A., & Setti, G. 2005, A&A, 440, 23
- Sarazin et al. (2000) Sarazin, C. L., Irwin, J. A., & Bregman, J. N. 2000, ApJ, 544, L101
- Schechter (1976) Schechter, P. 1976, ApJ, 203, 297
- Schmidt (1968) Schmidt, M. 1968, ApJ, 151, 393
- Shapley et al. (2001) Shapley, A., Fabbiano, G., & Eskridge, P. B. 2001, ApJS, 137, 139
- Sullivan et al. (2004) Sullivan, M., Hopkins, A. M., Afonso, J., et al. 2004, ApJS, 155, 1
- Szokoly et al. (2004) Szokoly, G. P., Bergeron, J., Hasinger, G., et al. 2004, ApJS, 155, 271
- Tammann et al. (1979) Tammann, G. A., Yahil, A., & Sandage, A. 1979, ApJ, 234, 775
- Tzanavaris et al. (2006) Tzanavaris, P., Georgantopoulos, I., & Georgakakis, A. 2006, A&A, 454, 447
- Ueda et al. (2003) Ueda, Y., Akiyama, M., Ohta, K., & Miyaji, T. 2003, ApJ, 598, 886
- White & Ghosh (1998) White, N. E. & Ghosh, P. 1998, ApJ, 504, L31+
- Wolf et al. (2004) Wolf, C., Meisenheimer, K., Kleinheinrich, M., et al. 2004, A&A, 421, 913
- Wolf et al. (2003) Wolf, C., Meisenheimer, K., Rix, H.-W., et al. 2003, A&A, 401, 73
- Zheng et al. (2004) Zheng, W., Mikles, V. J., Mainieri, V., et al. 2004, ApJS, 155, 73

| Sample | range | |
|---|---|---|
| Total | 0.13 | |
| 0.38 | ||
| 0.78 | ||
| Early | 0.17 | |
| 0.67 | ||
| Late | 0.14 | |
| 0.67 |
| Sample | log | |||
|---|---|---|---|---|
| (erg s-1) | Mpc-3 dex-1 | |||
| Total | ||||
| Early | ||||
| Late |