XMMU J134736.6+173403: an eclipsing LMXB in quiescence or a peculiar AGN?
Abstract
Aims. We report the discovery of a peculiar object observed serendipitously with XMM-Newton. We present its timing and spectral properties and investigate its optical counterpart.
Methods. The light curve of the X-ray source, its spectrum, and the spectrum of the best optical counterpart are presented and analyzed.
Results. The X-ray flux decreases by a factor of 6.5 within 1 h and stays in a low state for at least 10 h, thereby suggesting the presence of an eclipse. The spectrum is very soft, a power law with a slope of , and does not change significantly before and after the flux drop. The source is spatially coincident within few arc-seconds with a Seyfert 2 galaxy belonging to a galaxy pair.
Conclusions. Although the background AGN seems the best counterpart, neither the temporal nor the spectral properties of the X-ray source are compatible with it. We investigate the possibility of having a foreground low-mass X-ray binary in quiescence, where the companion is not detected in the optical wavelength.
Key Words.:
X-rays: general – X-rays: binaries – Galaxies: Seyfert1 Introduction
In this paper we report the discovery of an X-ray source for which the flux drops abruptly by a factor of 6.5 within one hour, and stays in this low state for at least 10 hours. The nature of the source described in this paper is very ambiguous. The X-ray light curve suggests the presence of an eclipse and hence a binary system. The detected optical counterpart is a pair of galaxies, one of which is a Seyfert 2 AGN. The X-ray spectrum is also very soft so as to be compatible with such an AGN. We suggest the possibility that we have a foreground low-mass X-ray binary in quiescence for which the optical counterpart is below detectability, but we do not exclude the presence of a peculiar AGN. In this section we introduce the general X-ray properties both of low-mass X-ray binaries in quiescence and of Seyfert 2 galaxies.
Low-mass X-ray binaries (LMXBs) are composed of a compact object, either a neutron star (NS) or a black hole (BH), accreting matter from a companion star with masses M⊙. These objects have typical X-ray luminosities of about 1037–1038 erg s-1 but can drop down to 1031–1033 erg s-1 during quiescence. At high luminosities, the disk is optically thick and geometrically thin, while a hot optically thin, advection-dominated accretion disk is expected for lower luminosities. In the advection-dominated accretion flow (ADAF) model, the radiative efficiency is very low (10-4–10-3) and most of the gravitational energy is stored as internal energy and advected towards the compact object with little X-ray emission (Narayan et al. 1996). A hot quasi-spherical flow is expected in the inner regions producing X-rays (Narayan et al. 1996).
The spectrum of NS-LMXBs in quiescence displays a soft (kT0.1 keV) thermal component (McClintock et al. 2004), probably associated with the stellar surface. Indeed, the observed X-ray luminosities, temperatures, and distance of these systems indicate that the thermal emission comes from a source with a radius of 10 km. On the other hand, for BH-LMXBs in quiescence, no thermal emission has been reported for the 15 sources reported by McClintock & Remillard (2004), since they possess an event horizon. Their spectra are well-fitted by a single power law with a photon index 1.52.1 (McClintock & Remillard 2004).
The brightest and best-studied NS-LMXBs in quiescence are Cen X-4 and Aql X-1. Spectral and temporal analysis of these sources during quiescence are reported, for example, by Campana et al. (2004) and Campana & Stella (2003), respectively. Both sources display a thermal component and a power law, as well as short-timescale temporal variability (Campana & Stella 2003; Rutledge et al. 2002). The X-ray Nova V 404 Cygni is, on the other hand, the brightest stellar-mass BH in quiescence. A recent review of its properties is reported by Bradley et al. (2007): the spectrum in quiescence is typically a power law with a , consistent with with what is expected for the advection-dominated accretion flow. In the low state, the source is also variable on a short time scale up to a factor of 20 during a 60 ks observation (Hynes et al. 2004).
We review in this paragraph some of the X-ray properties of Seyfert 2 galaxies. In the unified model for AGN (Antonucci 1993), Seyfert 2 galaxies are identical to the Seyfert 1, but observed at high inclination angle. The nucleus of Seyfert 2 galaxies is therefore not directly visible, and shows much higher column densities than in Seyfert 1 objects, blocking the soft X-ray flux below 2 keV. Risaliti et al. (1999) show that all sources of their sample of Seyfert 2 galaxies have , and 75% . Their spectra are relatively hard. Moran et al. (2001) show a composite spectrum for 29 Seyfert 2 galaxies observed with ASCA. The continuum is described by a double power law component: an unabsorbed component (energy index =0.84) dominates below 3 keV, and at higher energies the spectrum is dominated by a heavily absorbed component (, =0.46). An Fe K line is present at 6.4 keV, with an equivalent width of 420 eV. Small-amplitude, short-timescale variability is observed for Seyfert 2 galaxies, as Awaki et al. (2006). These authors report variation of a factor less than two for 13 Seyfert 2 galaxies observed with XMM-Newton, on a time scale of a few thousand seconds.
2 Observation and data reduction
2.1 XMM-Newton data
XMMU J134736.6+173403 was observed serendipitously by XMM-Newton on 2003 June 24 for 64 ksec, the target being Tau Boo. The EPIC-MOS (Turner et al. 2001) were operated in large window mode and EPIC-pn (Strüder et al. 2001) cameras in full frame mode with the thick filter for all instruments. The optical monitor was blocked throughout the full observation. After screening the MOS data for proton flares using standard procedures111http://xmm.esac.esa.int/external/xmm_user_support/documentation/sas_usg/USG/, a total of 60 and 56 ksec of low-background emission remained for the MOS and pn, respectively.
Using the XMM-Newton Software Analysis System (SAS) edetect_chain task, which performs maximum-likelihood source detection, XMMU J134736.6+173403, observed at off-axis, was detected with a maximum likelihood of . The best-fit coordinates were and with a statistical error of . Since the source is off-axis, however, the uncertainty on the statistical error might be much greater than what is provided by edetect_chain. Combining this error to the systematical shift expected between X-ray data and optical counterpart (typically few arcsec), the total estimated error is about
2.2 Optical counterpart spectra
Low-resolution spectroscopy was performed with ISIS at the William Herschel Telescope (ING, La Palma) in the night 2007 June 14 in service mode. The slit was aligned east-west to get the spectra of the galaxy and the AGN in the same frames. The blue and red spectra were acquired simultaneously on two different CCDs, thanks to a dichroic system. Two short exposures of 10 mn each were made to avoid cosmic rays.
The data reduction was performed in a standard way for both the blue and red spectrum parts. We wrote a dedicated and semi-automatic MIDAS batches for ISIS long-slit spectra essentially using the LONG package. We first performed the standard reductions, i.e. a bias substraction, a flat-fielding, and a cosmic rejection. Then we extracted the arcs at the object position, summed them if more than one, and from them we identified some lines and automatically performed a wavelength calibration. All the objects were calibrated in wavelength, corrected from the mean extinction, and calibrated in fluxes with 3 standards stars taken during the night. This instrumental response is very stable in time, regular checks are done monthly. Finally, from these 2D images we extracted the objects with an optimized spectrum extraction batch and a line-fitting to measure the line intensities and the redshift.
3 Timing and spectral analysis of XMMU J134736.6+173403
The combined EPIC-MOS and pn background-subtracted light curve is shown in Fig. 1 (top), with a time bin size of 500 sec. The corresponding hardness-ratio light curve is given at the bottom, with a time bin size of 2000 sec. Hard and soft bands are given by H=2–10 keV and S=0.2–2 keV, respectively. Times are given in hours from the start of the observation. Periods of high background at the end of the observation were excluded from the data. The straight lines show the average of the respective portion of the curves. In the first curve the flux drops by a factor of 6.5 within 1 hr. We searched for periodicities between 10 s and 6 hr in the light curve before the dip where the flux is visibly variable. We found a significant modulation at 1.8 h, but more data are needed to confirm the periodicity. On the other hand, no periodic signal was found in the low state. The fractional root mean-square variability amplitude, defined for example in Vaughan et al. (2003), , is 13.71.2% before the flux drop and 13.23.8% after it, showing that the short-term variability is roughly constant during the observation. The hardness-ratio light curve does not vary after the flux decline either.

Figure 2 shows the pn and MOS spectra of the source. The data are binned to have at least 25 counts in each energy bin. The source is described well by a power law model, yielding in the high state and in the low. Adding another component does not improve the fit. The best-fitting parameters of the absorbed power law model are shown in Table 1. Here, is the equivalent column density of neutral hydrogen and the photon index. The corresponding 0.2–10 keV flux is shown in the last row. Uncertainties are given at a 90% confidence level.
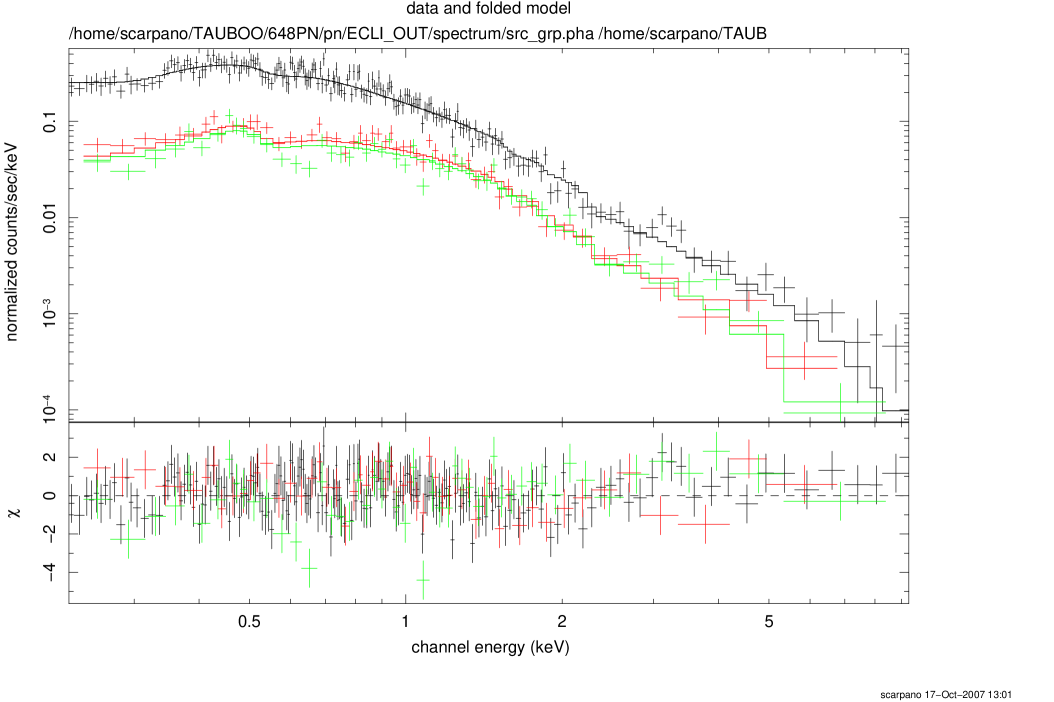
| High State | Low state | |
|---|---|---|
| 4.73 | 3.13 | |
| ( cgs) | 1.33 | 0.24 |
We searched for X-ray data for the source from other X-ray satellites: no observation has been performed with Chandra, and the source is detected in neither the all-sky survey nor in a short (600 s) PSPC observation from the ROSAT satellite, where the upper limit flux was of and erg s-1cm-2, respectively. The source was, however, visible in a 80 ks ASCA observation and reported in the catalogue of ASCA sources (Ueda et al. 2005). Their flux and hardness-ratios are compatible to the mean value measured by XMM-Newton. We extracted the ASCA light curve, and there does not seem to be any flux drop like the one observed in the XMM-Newton data, although the count rate is very low (5 cts ks-1).
4 The optical counterparts
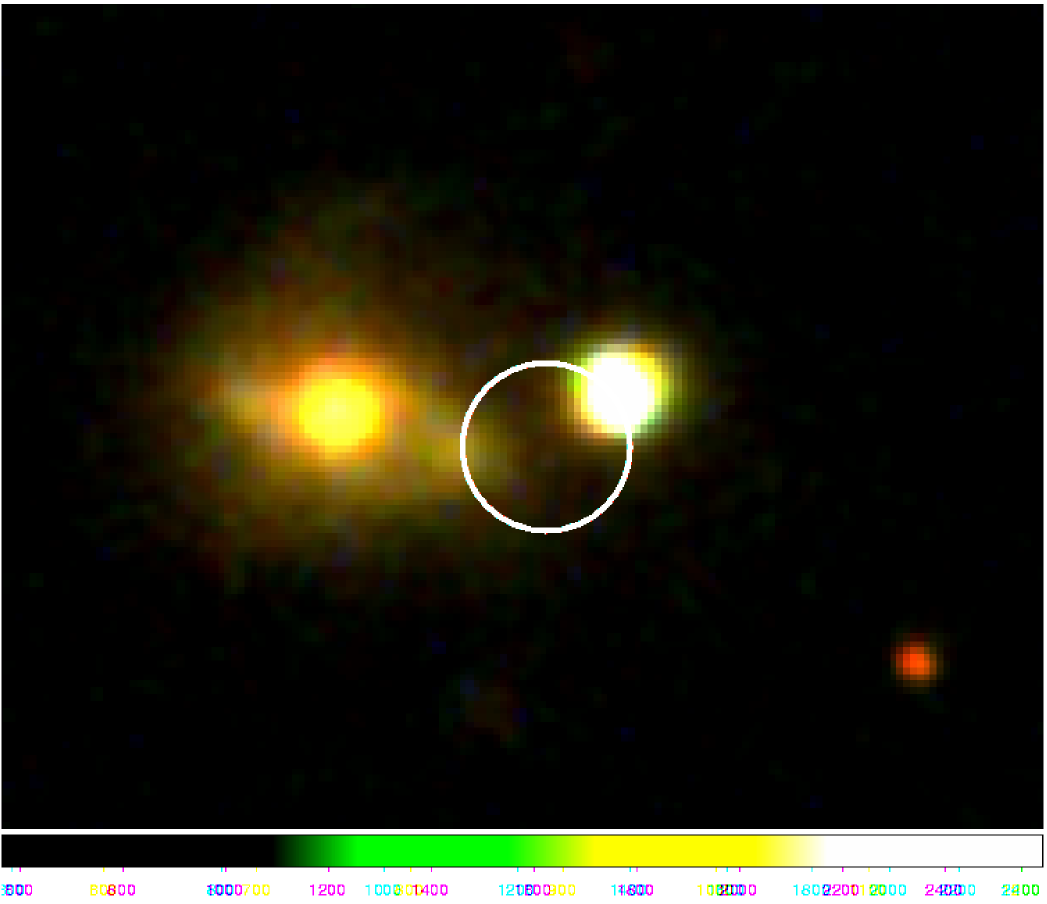
Figure 3 shows the optical counterpart image of the X-ray source. The circle is centered on the position of the X-ray source and the radius is 3′′. Both sources are extra-galactic objects with a redshift of z=0.045. From the image and the spectrum, the source on the left is a normal galaxy with some emission lines (not shown in this paper). The object on the right has a spectrum typical of a Seyfert 2 galaxy (narrow Hβ line and O/H3, see Fig. 4). At this distance the sources are separated by 10 kpc (corresponding to 10′′), suggesting that they form a pair of galaxies, maybe in interaction. The Seyfert 2 galaxy is also associated with a radio source with an intensity of 17.91 mJy at 1.4 Ghz (Becker et al. 2003).

5 Discussion
We reported the discovery of an X-ray source that presents a flux drop of a factor of 6.5 within 1 h and stays in a low state for at least 10 h, suggesting an eclipse. From optical archived images, there are two counterparts: the first an extended normal galaxy and the second a point source. A radio source is also associated to this last one. We got the optical spectrum of the two objects from the ING Telescope in La Palma. The extended object is indeed a redshifted object with emission lines consistent with a normal or slightly active galaxy. Surprisingly, the second object appeared at the same redshift (z=0.045) and has a spectrum typical for a Seyfert 2 galaxy. At that distance the objects are separated by 10 kpc, suggesting that they form a pair of galaxies, maybe in interaction.
Within this context, the X-ray source would be associated with the Seyfert 2 galaxy (generally strong X-ray sources) rather than the normal galaxy. At this distance, the observed luminosity in the 0.2-10 keV band is 6.5 erg s-1 in the high state and 1 erg s-1 in the low state. This kind of luminosity is typical of Seyfert 2 galaxies. The temporal and spectral properties of the X-ray object are unexpected, however, for such an AGN. A flux drop of a factor of 6.5 within 1 h has never been reported so far, especially for Seyfert 2 galaxies where the galaxy is observed edge-on. The spectrum, furthermore, is extremely soft for such a galaxy and does not present any K line at 6.4 keV.
We thus believe that the source is a foreground object within the line-of-sight of this pair of galaxies. The detection limit of the Sloan Digital Sky survey is 23.3 mag and 23.1 mag in the green and red bands, respectively (Willman et al. 2002). Since the size of the Galaxy towards the source is about 5 kpc, the companion must be type M2, M=9.9 (Cox 2000) or later to explain the non-detectability. Assuming the object is at 5 kpc, the luminosity is 41033 erg s-1 and becomes 61032 erg s-1 if the source is at only 2 kpc (implying therefore a M4/M5 dwarf companion). This is well within the range of what is expected for low-mass X-ray binaries in quiescence and is consistent with these objects having K or M companion stars. We exclude the presence of a cataclysmic variable, since their orbital periods are only a few hours, while here, if the flux drop is associated with an eclipse, it must be at least 1 day. We note that the spectrum is a bit too soft () for an BH-LMXB in quiescence and that a power law continuum in unexpected for a thermal emission from a neutron star surface.
If the X-ray source is a foreground object, then the X-ray flux of the background AGN should also be detected and both are probably confused. A deep Chandra observation of the system might represent the only solution for disentangling the LMXB picture or the peculiar AGN scenario. Thanks to its better spatial resolution, we might be able to resolve 2 hypothetical point sources in the first scenario, while one single source, associated with the AGN, should be observed in the second case.
Acknowledgements.
This paper is based on observations obtained with XMM-Newton, an ESA science mission with instruments and contributions directly funded by ESA Member States and NASA, and on observations made with the WHT telescope operated on the island of La Palma by the Isaac Newton Group in the Spanish Observatorio del Roque de los Muchachos of the Instituto de Astrofisica de Canarias. We acknowledge the following persons (in alphabetic order) for their help in the interpretation of the source nature: L. Ballo, A.-L. Longinotti, M. Guainazzi, A. Pollock, A. Read, R. Saxton, M.D. Trigo. Funding for the SDSS and SDSS-II has been provided by the Alfred P. Sloan Foundation, the Participating Institutions, the National Science Foundation, the U.S. Department of Energy, the National Aeronautics and Space Administration, the Japanese Monbukagakusho, the Max Planck Society, and the Higher Education Funding Council for England. The SDSS Web Site is http://www.sdss.org/. The SDSS is managed by the Astrophysical Research Consortium for the Participating Institutions. The Participating Institutions are the American Museum of Natural History, Astrophysical Institute Potsdam, University of Basel, University of Cambridge, Case Western Reserve University, University of Chicago, Drexel University, Fermilab, the Institute for Advanced Study, the Japan Participation Group, Johns Hopkins University, the Joint Institute for Nuclear Astrophysics, the Kavli Institute for Particle Astrophysics and Cosmology, the Korean Scientist Group, the Chinese Academy of Sciences (LAMOST), Los Alamos National Laboratory, the Max-Planck-Institute for Astronomy (MPIA), the Max-Planck-Institute for Astrophysics (MPA), New Mexico State University, Ohio State University, University of Pittsburgh, University of Portsmouth, Princeton University, the United States Naval Observatory, and the University of Washington.References
- Antonucci (1993) Antonucci, R. 1993, ARA&A, 31, 473
- Awaki et al. (2006) Awaki, H., Murakami, H., Ogawa, Y. & Leighly, K. M. 2006, ApJ, 645, 928
- Becker et al. (2003) Becker, R. H., Helfand, D. J., White, R. L., Gregg, M. D. & Laurent-Muehleisen, S. A. 2003, VizieR Online Data Catalog, 8071
- Bradley et al. (2007) Bradley, C. K., Hynes, R. I., Kong, A. K. H., Haswell, C. A. et al. 2007, ApJ, 667, 427
- Campana & Stella (2003) Campana, S. & Stella, L. 2003, ApJ, 597, 474
- Campana et al. (2004) Campana, S., Israel, G. L., Stella, L., Gastaldello, F. & Mereghetti, S. 2004, ApJ, 601, 474
- Cox (2000) Cox, A. N. 2000, Allen’s astrophysical quantities, 4th ed. Publisher: New York: AIP Press; Springer
- Fabbiano et al. (2003) Fabbiano, G., King, A. R., Zezas, A., Ponman, T. J., Rots, A. & Schweizer, F. 2003, ApJ, 591, 843
- Hynes et al. (2004) Hynes, R. I., Charles, P. A., Garcia, M. R., Robinson, E. L. et al. 2004, ApJ, 611, L125
- McClintock et al. (2004) McClintock, J. E., Narayan, R. & Rybicki, G. B. 2004, ApJ, 615, 402
- McClintock & Remillard (2004) McClintock, J. E. & Remillard, R. A. 2004, in Compact Stellar X-Ray Sources, ed. W. H. G. Lewin & M. van der Klis (cambridge: Cambridge Univ. Press), astro-ph/0306213
- Moran et al. (2001) Moran, E. C., Kay, L. E., Davis, M., Filippenko, A. V.& Barth, A. J. 2001, ApJ, 556, L75
- Narayan et al. (1996) Narayan, R., McClintock, J. E. & Yi, I. 1996, ApJ, 457, 821
- Risaliti et al. (1999) Risaliti, G., Maiolino, R. & Salvati, M. 1999, ApJ, 522, 157
- Rutledge et al. (2002) Rutledge, R. E., Bildsten, L., Brown, E. F., Pavlov, G. G. & Zavlin, V. E. 2002, ApJ, 577, 346
- Strüder et al. (2001) Strüder, L., Briel, U., Dennerl, K., et al. 2001, A&A, 365, L18
- Turner et al. (2001) Turner, M. J. L., Abbey, A., Arnaud, M., et al. 2001, A&A, 365, L27
- Ueda et al. (2005) Ueda, Y., Ishisaki, Y., Takahashi, T., Makishima, K. & Ohashi, T. 2005, ApJS, 161, 185
- Vaughan et al. (2003) Vaughan, S. and Edelson, R. and Warwick, R. S. and Uttley, P. 2003, MNRAS, 345, 1271
- Willman et al. (2002) Willman, B., Dalcanton, J., Ivezić, Ž., Jackson, T., Lupton, R., Brinkmann, J. , Hennessy, G. & Hindsley, R. 2002, AJ, 123, 848