High Precision Photometry of Extreme KBO 2003 EL61
Abstract
We present high precision, time-resolved visible and near infrared photometry of the large (diameter 2500 km) Kuiper belt object (136108) 2003 EL61. The new data confirm rapid rotation at period = 3.91550.0001 hr with a peak-to-peak photometric range = 0.290.02 mag. and further show subtle but reproducible color variations with rotation. Rotational deformation of 2003 EL61 alone would give rise to a symmetric lightcurve free of color variations. The observed photometric deviations from the best-fit equilibrium model show the existence of a large surface region with an albedo and color different from the mean surface of 2003 EL61. We explore constraints on the nature of this anomalous region set by the existing data.
Subject headings:
Kuiper belt — methods: data analysis — minor planets, asteroids — solar system: general — techniques: photometric1. Introduction
The known Kuiper belt objects (KBOs) extend in size from bodies so small as to be at the limits of sensitivity of the largest telescopes up to Pluto-sized bodies large enough to have body shapes controlled by self-gravity. The large objects are particularly amenable to physical study and a number of intriguing results have already been secured. The case of Pluto is well known: the main object rotates slowly (period 6 days) but the massive satellite Charon carries enough angular momentum that the system as a whole is near the critical threshold for breakup (McKinnon, 1989). Surface maps derived from mutual occultation events show a spatially variegated surface, with a wide range of local albedos (from 0.1 to 0.9: Buie et al., 1992; Young et al., 1999) that may be related to surface deposition of frosts from Pluto’s thin atmosphere (Trafton, 1989). Other KBOs have less well known physical properties but new data are beginning to reveal a startling range of surface types (Jewitt & Luu, 2004; Tegler et al., 2007; Trujillo et al., 2007) and rotational (Lacerda & Luu, 2006; Sheppard, 2007) properties. Notable examples of the latter include 900 km diameter (20000) Varuna, whose 6 hr period and 0.4 mag. photometric range are best explained as products of a rotationally deformed body shape and a bulk density of 1000 kg m-3 (Jewitt & Sheppard, 2002; Takahashi & Ip, 2004; Lacerda & Jewitt, 2007). The large amplitude (1.140.04 mag.), long rotation period (13.77440.0004 hr) and eclipsing binary-like lightcurve of 240 km diameter 2001 QG298 suggest an even more extreme interpretation as a contact or near-contact binary (Sheppard & Jewitt, 2004; Lacerda & Jewitt, 2007).
One of the most remarkable of the large KBOs yet to be identified is (136108) 2003 EL61 (hereafter “EL61”), whose rapid rotation (period3.91540.0002 hr), and lightcurve range (mag) and near-symmetric morphology together suggest a rotationally deformed body of density 2500 kg m-3 (Rabinowitz et al., 2006; Lacerda & Jewitt, 2007). EL61 is further interesting in its own right, as an extreme example of a large KBO with a rapid spin and also as the possible parent of a reported dynamical cluster of KBOs, perhaps produced by an ancient, shattering collision (Brown et al. 2007, Ragozzine and Brown 2007). Some members of this dynamical cluster share spectral features with EL61. Nearly all Pluto-sized KBOs have methane rich surfaces. EL61 is unusual in that it is covered in almost pure crystalline H2O ice (see Fig. 1; Trujillo et al. 2007). In this paper, we present new high-precision, time-resolved photometry taken to further explore the nature of EL61.
| UT Date | aaHeliocentric distance in AU; | bbGeocentric distance in AU; | ccPhase angle in degrees; | Tel. ddTelescope used; | Filt. eeFilters used; | Seeing ffTypical seeing in arcseconds; | Exp. Time ggTypical integration time per frame in seconds. |
|---|---|---|---|---|---|---|---|
| [°] | [″] | [s] | |||||
| 2007 Jun 11 | 51.1570 | 50.8037 | 1.07 | UH2.2m | 0.9 | 80 | |
| 2007 Jun 13 | 51.1567 | 50.8296 | 1.08 | UH2.2m | 1.0 | 80 | |
| 2007 Jun 15 | 51.1565 | 50.8576 | 1.09 | UH2.2m | 0.9 | 260 | |
| 2007 Jul 07 | 51.1536 | 51.1800 | 1.14 | UKIRT | 1.0 | 60 | |
| 2007 Jul 08 | 51.1535 | 51.1949 | 1.14 | UKIRT | 1.2 | 60 | |
| 2007 Jul 22 | 51.1517 | 51.4001 | 1.10 | UH2.2m | 1.5 | 300 | |
| 2007 Jul 24 | 51.1514 | 51.4286 | 1.09 | UH2.2m | , | 1.5 | 260, 80 |
2. Observations
Optical observations were taken using the 2.2-m diameter University of Hawaii telescope atop Mauna Kea, Hawaii. We used a Tektronix 20482048 pixel charge-coupled device (CCD) mounted at the f/10 Cassegrain focus, giving pixels each 0.219 arcsecond square. Observations were obtained through broadband filters approximating the Kron-Cousins photometric system. The data were instrumentally calibrated using bias frames and flat-field images obtained from dithered, median-combined images of the twilight sky. Photometric calibration was obtained from observations of standards PG1323-085C, 107 457, Markarian A1, and PG1633-099A from the list by Landolt (1992).
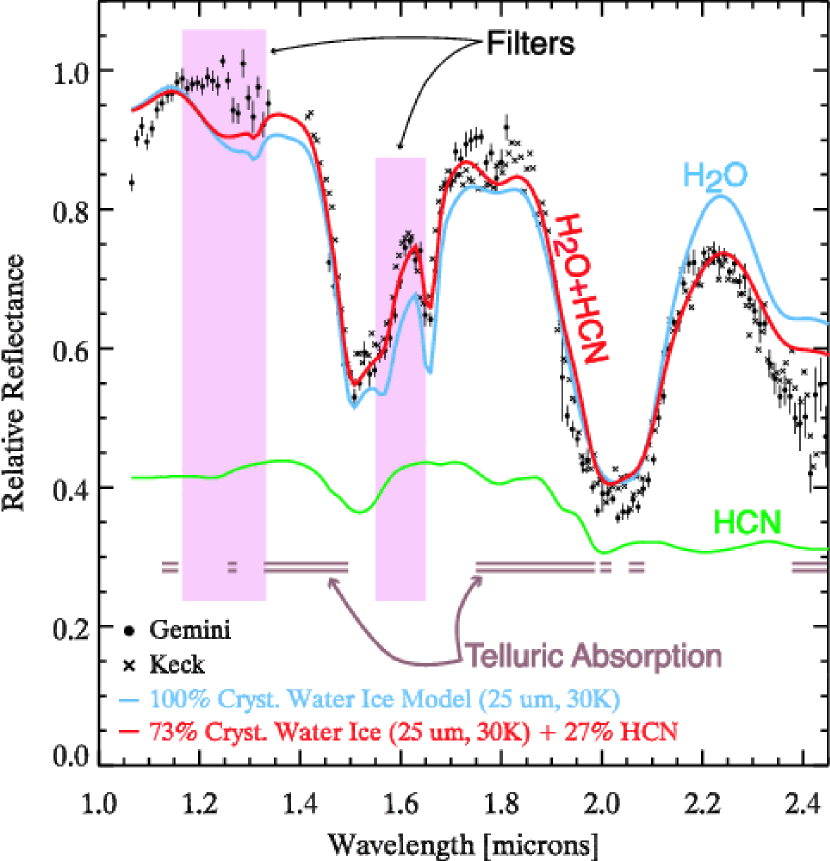
Near infrared observations were taken using the 3.8-m diameter United Kingdom Infrared Telescope (UKIRT), also located on Mauna Kea. We used the UIST imaging camera, which houses a 10241024 pixel array having image scale of 0.12 arcsec per pixel. Our principal aim was to use the near-infrared wavelengths to search for rotational variability of water ice on the surface of EL61. For this purpose, we elected to use two filters, one to measure the 1.5 m band of water ice and the other to sample the reflected continuum. Use of two filters, as opposed to a near infrared spectrometer, allowed us to maintain rapid sampling (important because of the short rotation period of EL61) and high signal-to-noise ratios. Given the available UKIRT filter set, we employed the “CH4s” filter (center 1.60m, full width at half maximum FWHM = 0.11m) to measure the water band (see Fig. 1). The Mauna Kea band filter (center 1.25m, FWHM = 0.16m) provided a suitable measure of the continuum. In the remainder of the text we refer to these filters as “1.6m” and “1.25m”. Photometric calibration of the UKIRT data was obtained from observations of standard stars S791-C and S813-D from Persson et al. (1998). The flux through each filter was measured relative to a field star and a second star was used to verify the regularity of the first. Since simultaneous measurements through the 1.25m and 1.6m filters were not possible, we cross-interpolated their fluxes to the same times and measured the ratio of the interpolated values. A summarized journal of observations can be found in Table 1, and the final calibrated broadband photometric measurements are shown in Tables 2 through 4. Table 5 shows the ratio of flux density at 1.6m to the continuum flux density at 1.25m, as a function of time.
3. Results and Discussion
Photometric measurements were obtained first relative to field stars, to provide protection from transient changes in the transparency of the Earth’s atmosphere and variations in the seeing (which can impact the accuracy of photometry obtained through discrete apertures). The resulting measurements were calibrated against standard stars using large aperture photometry. Internal accuracy of the lightcurve data in the and filters is good to about 0.01 mag. while, in the infrared, scatter in the photometry shows that the accuracy is at the 0.03 mag. level. We did not apply a phase angle correction to the data. The phase angle changed from 1.07 to 1.10 degrees in our and observations. In this 0.03 degree phase angle range, with a phase coefficient of 0.1 mag/deg (Rabinowitz et al., 2007), the effect of phase is only 0.003 mag. and therefore unimportant compared to the 0.01 mag. photometric accuracy. Furthermore, the color dependence of the phase coefficient is small for EL61 according to these authors, and the expected change in the color resulting from phase angle is only about 0.001 mag, which is again negligible.
The best-fit lightcurve period was determined from the -band data using phase-dispersion minimization (PDM; Stellingwerf 1978) as = 3.91550.0001 hr (two-peaked lightcurve). This period is in close agreement with = 3.91540.0002 hr determined independently (Rabinowitz et al., 2006). Photometry in the other filters was scaled to the -band lightcurve by subtracting the median colors and , as determined from our data. The color is again in good agreement with = 0.9690.030 reported by Rabinowitz et al; these authors did not measure .
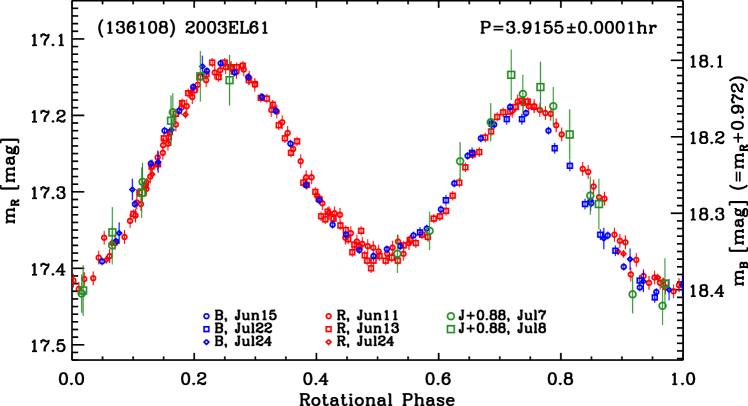
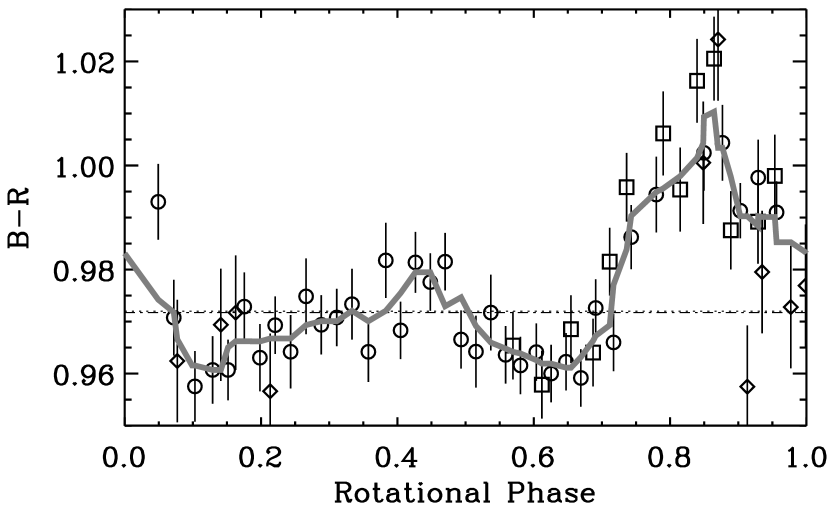
The resulting phased -, - and -band lightcurves of EL61 are shown in Fig. 2. Two main features are immediately apparent from the lightcurves. Firstly, the two peaks of the lightcurve are unequal. The total range (peak-to-peak) is 0.290.02 mag. but the second peak is smaller by roughly 0.08 mag. This asymmetry in the lightcurve peaks cannot be matched by simple equilibrium shape models of the type proposed by Rabinowitz et al. (2006), since the latter are symmetric (Chandrasekhar, 1969). Secondly, we note that, in the interval roughly from 0.7 to 1.0 in rotational phase (Fig. 2) the data fall systematically below the data. Although small, this effect appears in measurements from three different nights and hence we regard it as observationally secure. The color curve, computed from the data in Fig. 2, is shown separately in Fig. 3. There, the magnitudes were interpolated to the rotational phases of photometry and were subtracted from the data points. The resulting color curve was smoothed using a running median filter to show a reddening of up to 0.035 magnitudes. The data are of lower signal-to-noise but, in the region near 0.75 rotational phase, is also redder than near the 0.25 rotational phase peak (Fig. 2).
We quantitatively assess the significance of the red feature in the color curve by noting that, in the interval from 0.7 to 1.0 in rotational phase, 21 of the 23 consecutive phased measurements fall above the median for EL61. The probability of this result is the same as the probability of obtaining at least 21 “tails” in 23 tosses of an unbiased coin. Assuming a binomial distribution, this probability is roughly , corresponding to 4. Furthermore, at least 9 measurements in that same interval lie above the median, corresponding to . In this sense, the redder region in Fig. 3 is unlikely to be due to chance. This, plus the fact that the red spot is confirmed by observations on different nights together strongly suggest that the feature is real.
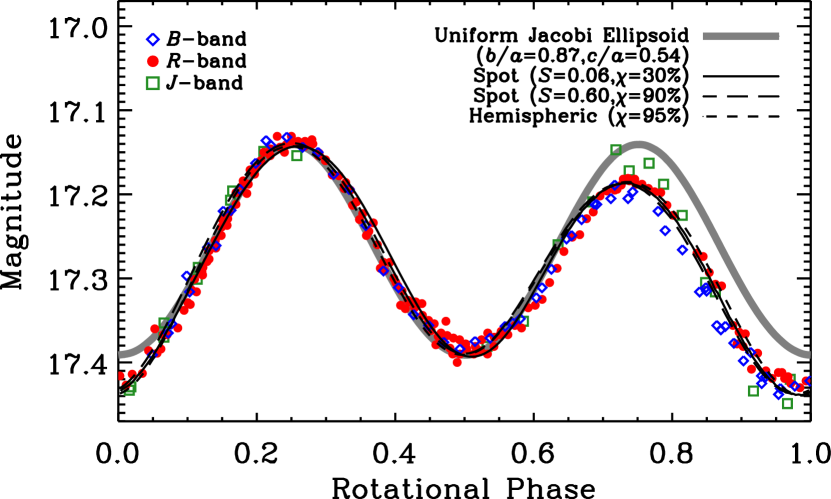
Lightcurve asymmetry of the type observed in Fig. 2 could be caused by strength-supported topography. However, the associated color variations (Fig. 3) cannot be so explained. Instead, the data are best explained by the presence of wavelength-dependent albedo markings on the surface of EL61, perhaps analogous to the ones already mapped on Pluto. Specifically, given that the body shape of EL61 is close to a figure of equilibrium, the multi-wavelength lightcurve data show the existence of a region, near the second peak in Fig. 4, that is darker and redder than elsewhere. For want of a better label, we refer to this as the “dark red spot” (DRS).
The time-resolved measurements of the 1.5m water-ice band from UT 2007 July 07 are plotted in Fig. 5. The data provide no compelling indication of variability, except that the ratio of the 1.6m flux density to the continuum flux density at 1.25m appears lower (the water-ice band deepens) near phase 0 than at other phases. An attempt to repeat the 1.6m photometry on UT 2007 July 08 was thwarted by unstable atmospheric opacity. In the absence of confirming data from a second night, we regard the variation seen in Fig. 5 as interesting but inconclusive. We cannot determine whether the water-band depth varies with the rotation of EL61.
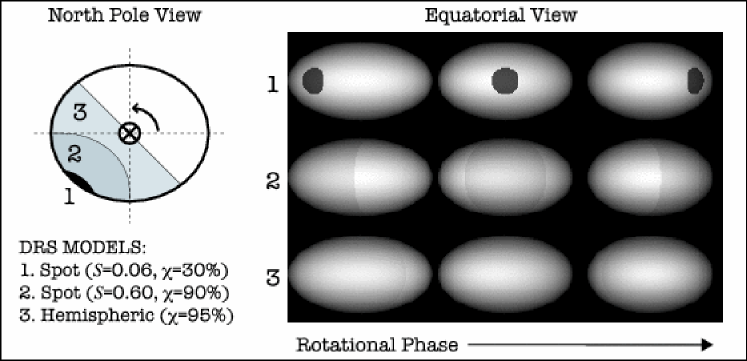
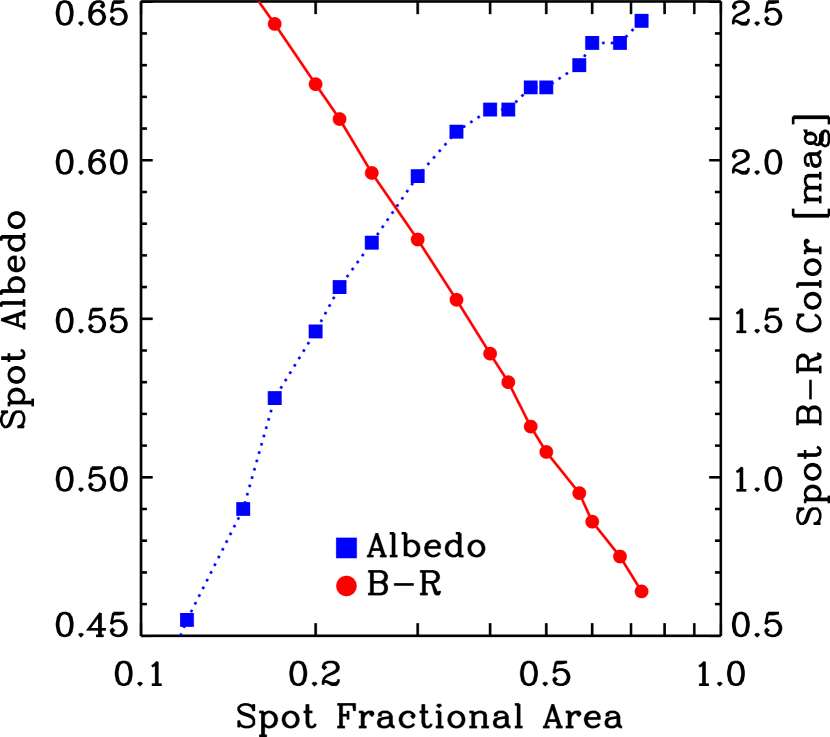
What constraints can be set on the albedo markings present on the surface of EL61? We first address the spatial extent of the DRS. In principle, the DRS could be very small compared to the instantaneous projected cross-section of EL61 but would then need to be very red and very dark relative to the surroundings in order to give rise to the observed lightcurve differences. At the other extreme, the DRS could be large, possibly even hemispheric in extent, in which case its albedo and color contrast relative to the surroundings would be minimal (see Fig. 6). To explore the range of possibilities we computed models in which the area of the surface of EL61 occupied by the DRS was taken as a free parameter.
The models we used are described in detail in Lacerda & Jewitt (2007). In short, we render 3-dimensional models of EL61 at different rotational phases which are used to generate the synthetic lightcurve. In this paper we adopt a Lambert scattering law, appropriate for high-albedo icy surfaces. The spot was simulated as a region of different reflectivity and color curves were generated by subtracting the lightcurves of two spots of equal sizes but different reflectivities. The shape of EL61 was modeled by a Jacobi ellipsoid with axis ratios and , which provides the best match to the lightcurve data if no albedo variegation is present (see Fig. 4). The size of the spot is parametrized by its sky-plane cross-section area relative to the maximum cross-section of the Jacobi ellipsoid, . We assumed that the rotation axis of EL61 was inclined relative to the line-of-sight by 90∘, consistent with the large measured rotational lightcurve range, and that the DRS is located on the equator of EL61. The observed sequence of brighter and fainter extrema indicates that longitude of the DRS must lie in a leading quadrant with respect to one of the semi-major axes. This prediction is corroborated by our models, which further show that a longitudinal separation of 45°between the DRS and the long axis of EL61 produces a better match to the data than 30°or 60°. The ability to fit the shape of the lightcurves in different filters was used as a metric for the models. Three of the best-fit examples are shown in Figs. 4 and 6.

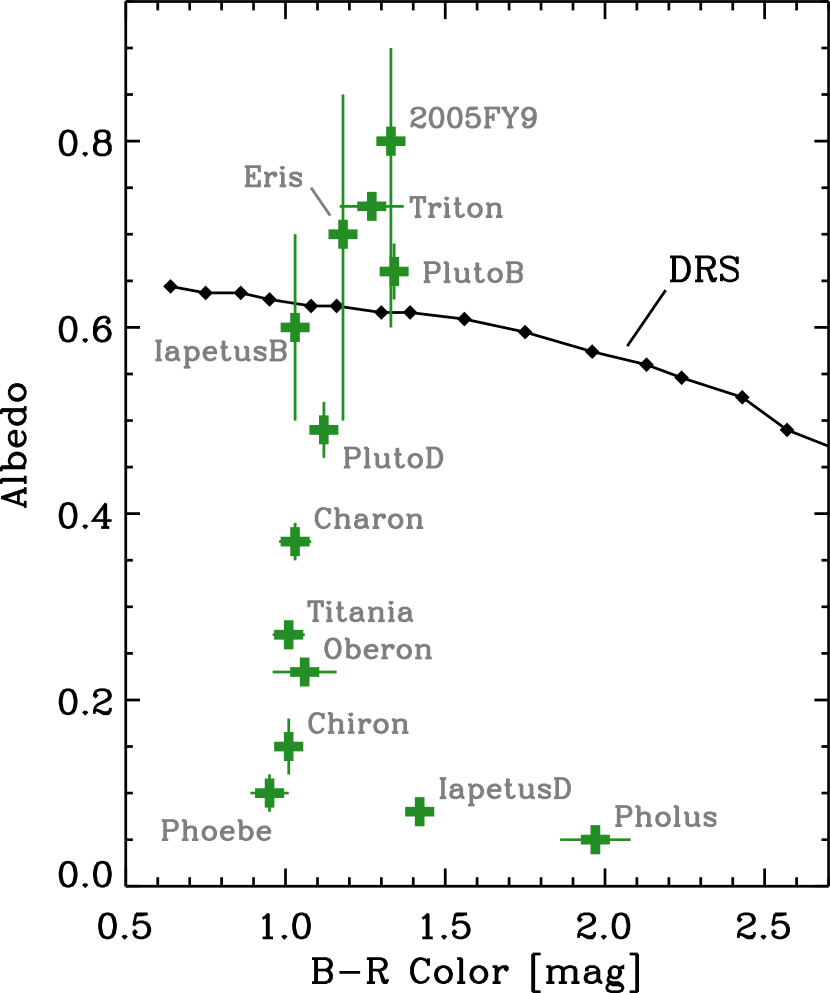
The results, which confirm the qualitative expectations outlined above, are shown in Fig. 7. Figure 8 combines the color and albedo constraints and allows comparison with real surfaces. Also marked in Fig. 8 are the ranges of color and albedo for established outer Solar system materials, including the dark regions on Pluto and Saturn’s satellite Iapetus. The EL61 data are incompatible with very small patches of dark, red matter like that found on the low-albedo side of Iapetus, or even with the darker material on the surface of Pluto. Indeed, if the spot is to have a color within the range observed for Solar system objects () then it must be larger than 20% of the maximum cross-section of EL61 (see Fig. 7). Instead, Iapetus’ and Pluto’s bright areas match the DRS in term of albedo and color. The surfaces of Eris (a large KBO) and 2005 FY9 are also consistent with the DRS, even if these objects have highly uncertain albedos (Stansberry et al., 2007). All matching surface types would imply a DRS size of 35% to 50%.
Another possibility is that the DRS is simply terrain contaminated by dirt. This would account for both the darkening and the reddening, but the suspected deepening of the 1.5m water band close to the DRS in rotational phase (see Fig. 5) would be harder to explain; a weaker, i.e. less deep, water feature would be expected if that were the case. Alternatively, the DRS could be a region depleted in a spectrally neutral substance, both brighter and bluer than water ice. A more contrived explanation involves the presence of larger water-ice grains on the DRS which would lower the albedo and redden the surface (Clark, 1982), and produce deeper water-ice absorption bands (Stephan et al., 2005). On Enceladus, larger grains are found on the region often referred to as the tiger stripes, where cryovolcanism is thought to be happening (Stephan et al., 2007).
What might be the origin of the DRS? On Pluto, the light and dark albedo markings may be self-sustaining and caused by the mobility of surface volatiles, partly driven by the seasons (Hansen and Paige 1996). There, dark regions are heated by the Sun leading to higher sublimation rates and the migration of volatiles towards brighter, cooler regions. In this way the volatile ices may naturally migrate to restricted regions of the surface. The dominant volatile species on Pluto is the highly volatile solid nitrogen, N2, with methane (CH4) mixed-in as an optically active tracer. In contrast, the surface of EL61 appears to be water-ice dominated, with no evidence for the diagnostic band at 2.15 m (Fig. 1). Water ice is utterly refractory at the 30 K temperatures on EL61, and this albedo instability mechanism seems unlikely to apply. It has been suggested that EL61 is the source of an impact-produced dynamical family of water-rich KBOs. It is tempting to speculate that the DRS could mark the scar of the impact from which the family members were purportedly excavated, although such an explanation could hardly be unique.
4. Summary
From time-resolved, high precision optical and near-infared photometry of KBO 2003 EL61 we find the following results.
-
The -band lightcurve has period 3.91550.0001 hrs and peak-to-peak range 0.290.02 mag. However, successive lightcurve peaks in the -band data are clearly unequal. The and colors of EL61 also vary with rotational phase.
-
No variation in the 1.5m water-ice band with rotational phase larger than 5% is observed in our data.
-
The observed lightcurve variations are broadly consistent with a rotational equilibrium (strengthless body) model but with the additional requirement that the surface must support wavelength-dependent albedo variations (“spots”) in order to explain the color variations.
-
We explored the range of parameters of possible surface spots that are consistent with the time-resolved photometry. Very small “spots” having albedo and color very different from the surroundings are ruled out by our data. Instead, the surface feature responsible for the wavelength-dependence of the lightcurve must have an areal extent corresponding to a significant fraction of the instantaneous projected cross-section.
Acknowledgments
We thank Roy Gal and Toshi Kasuga for allowing us to observe during their scheduled time. Andrew Wang, Colin Aspin and John Dvorak provided invaluable support. We appreciate comments from Jan Kleyna. PL was supported by a grant to DJ from the National Science Foundation and NP by the Fundação para a Ciência e a Tecnologia, BPD/2004/18729 and by a grant to DJ from the NASA Origins program.
References
- Buie et al. (1992) Buie, M. W., Tholen, D. J., & Horne, K. 1992, Icarus, 97, 211
- Chandrasekhar (1969) Chandrasekhar, S. 1969, Ellipsoidal figures of equilibrium (The Silliman Foundation Lectures, New Haven: Yale University Press, 1969)
- Clark (1982) Clark, R. N. 1982, Icarus, 49, 244
- Jewitt & Luu (2004) Jewitt, D. C. & Luu, J. 2004, Nature, 432, 731
- Jewitt & Sheppard (2002) Jewitt, D. C. & Sheppard, S. S. 2002, AJ, 123, 2110
- Lacerda & Jewitt (2007) Lacerda, P. & Jewitt, D. C. 2007, AJ, 133, 1393
- Lacerda & Luu (2006) Lacerda, P. & Luu, J. 2006, AJ, 131, 2314
- McKinnon (1989) McKinnon, W. B. 1989, ApJ, 344, L41
- Rabinowitz et al. (2006) Rabinowitz, D. L., Barkume, K., Brown, M. E., Roe, H., Schwartz, M., Tourtellotte, S., & Trujillo, C. 2006, ApJ, 639, 1238
- Rabinowitz et al. (2007) Rabinowitz, D. L., Schaefer, B. E., & Tourtellotte, S. W. 2007, AJ, 133, 26
- Sheppard (2007) Sheppard, S. S. 2007, AJ, 134, 787
- Sheppard & Jewitt (2004) Sheppard, S. S. & Jewitt, D. 2004, AJ, 127, 3023
- Stansberry et al. (2007) Stansberry, J., Grundy, W., Brown, M., Cruikshank, D., Spencer, J., Trilling, D., & Margot, J.-L. 2007, ArXiv Astrophysics e-prints
- Stephan et al. (2007) Stephan, K., Jaumann, R., Hansen, G. B., Clark, R. N., Buratti, B. J., Brown, R. H., Baines, K. H., Bellucci, G., Coradini, A., Cruikshank, D. P., Griffiths, C. A., Hibbitts, C. A., McCord, T. B., Nelson, R. M., Nicholson, P. D., Sotin, C., & Wagner, R. 2007, in Lunar and Planetary Institute Conference Abstracts, Vol. 38, Lunar and Planetary Institute Conference Abstracts, 1747–+
- Stephan et al. (2005) Stephan, K., Jaumann, R., Hibbitts, C. A., & Hansen, G. B. 2005, in Lunar and Planetary Institute Conference Abstracts, Vol. 36, 36th Annual Lunar and Planetary Science Conference, ed. S. Mackwell & E. Stansbery, 2061–+
- Takahashi & Ip (2004) Takahashi, S. & Ip, W.-H. 2004, PASJ, 56, 1099
- Tegler et al. (2007) Tegler, S. C., Grundy, W. M., Romanishin, W., Consolmagno, G. J., Mogren, K., & Vilas, F. 2007, AJ, 133, 526
- Trafton (1989) Trafton, L. M. 1989, Geophys. Res. Lett., 16, 1213
- Trujillo et al. (2007) Trujillo, C. A., Brown, M. E., Barkume, K. M., Schaller, E. L., & Rabinowitz, D. L. 2007, ApJ, 655, 1172
- Young et al. (1999) Young, E. F., Galdamez, K., Buie, M. W., Binzel, R. P., & Tholen, D. J. 1999, AJ, 117, 1063
| UT Date aaDates are light-time corrected; | Julian Date aaDates are light-time corrected; | bbApparent magnitude. | UT Date aaDates are light-time corrected; | Julian Date aaDates are light-time corrected; | bbApparent magnitude. |
|---|---|---|---|---|---|
| 2007 Jun 14.98390 | 2454266.483896 | 18.1690.005 | 2007 Jun 15.12433 | 2454266.624326 | 18.2950.005 |
| 2007 Jun 14.98989 | 2454266.489892 | 18.1920.005 | 2007 Jun 15.12788 | 2454266.627878 | 18.2610.005 |
| 2007 Jun 15.00129 | 2454266.501292 | 18.2870.005 | 2007 Jun 15.13144 | 2454266.631443 | 18.2250.005 |
| 2007 Jun 15.00572 | 2454266.505724 | 18.3290.005 | 2007 Jun 15.13499 | 2454266.634995 | 18.2020.005 |
| 2007 Jun 15.00999 | 2454266.509995 | 18.3700.005 | 2007 Jun 15.13855 | 2454266.638549 | 18.1840.005 |
| 2007 Jun 15.01429 | 2454266.514289 | 18.3970.005 | 2007 Jun 15.14281 | 2454266.642808 | 18.1610.005 |
| 2007 Jun 15.01869 | 2454266.518686 | 18.4030.005 | 2007 Jul 22.96857 | 2454304.468573 | 18.3250.007 |
| 2007 Jun 15.03386 | 2454266.533860 | 18.3630.005 | 2007 Jul 22.97550 | 2454304.475497 | 18.2830.007 |
| 2007 Jun 15.03757 | 2454266.537575 | 18.3370.005 | 2007 Jul 22.98246 | 2454304.482463 | 18.2210.007 |
| 2007 Jun 15.04263 | 2454266.542632 | 18.2880.005 | 2007 Jul 22.98775 | 2454304.487747 | 18.1830.007 |
| 2007 Jun 15.04688 | 2454266.546879 | 18.2350.005 | 2007 Jul 22.99173 | 2454304.491731 | 18.1770.007 |
| 2007 Jun 15.05056 | 2454266.550560 | 18.1920.005 | 2007 Jul 22.99578 | 2454304.495777 | 18.1770.007 |
| 2007 Jun 15.05445 | 2454266.554448 | 18.1660.005 | 2007 Jul 23.00453 | 2454304.504533 | 18.2150.007 |
| 2007 Jun 15.05819 | 2454266.558186 | 18.1350.005 | 2007 Jul 23.00859 | 2454304.508593 | 18.2380.007 |
| 2007 Jun 15.06184 | 2454266.561844 | 18.1140.005 | 2007 Jul 23.01263 | 2454304.512634 | 18.2880.007 |
| 2007 Jun 15.06554 | 2454266.565535 | 18.1040.005 | 2007 Jul 23.01670 | 2454304.516700 | 18.3280.007 |
| 2007 Jun 15.06924 | 2454266.569239 | 18.1160.005 | 2007 Jul 23.02072 | 2454304.520717 | 18.3490.007 |
| 2007 Jun 15.07287 | 2454266.572872 | 18.1220.005 | 2007 Jul 23.02722 | 2454304.527220 | 18.3880.007 |
| 2007 Jun 15.07658 | 2454266.576576 | 18.1480.005 | 2007 Jul 23.03125 | 2454304.531245 | 18.4100.007 |
| 2007 Jun 15.08022 | 2454266.580221 | 18.1660.005 | 2007 Jul 24.97186 | 2454306.471861 | 18.2830.014 |
| 2007 Jun 15.08414 | 2454266.584144 | 18.2090.005 | 2007 Jul 24.97540 | 2454306.475403 | 18.3330.014 |
| 2007 Jun 15.08831 | 2454266.588311 | 18.2630.005 | 2007 Jul 24.98242 | 2454306.482416 | 18.3600.014 |
| 2007 Jun 15.09185 | 2454266.591852 | 18.2830.005 | 2007 Jul 24.98596 | 2454306.485957 | 18.3890.014 |
| 2007 Jun 15.09541 | 2454266.595405 | 18.3150.005 | 2007 Jul 24.99282 | 2454306.492821 | 18.4000.014 |
| 2007 Jun 15.09896 | 2454266.598958 | 18.3280.005 | 2007 Jul 24.99636 | 2454306.496361 | 18.3940.014 |
| 2007 Jun 15.10251 | 2454266.602511 | 18.3480.005 | 2007 Jul 25.00914 | 2454306.509139 | 18.3260.014 |
| 2007 Jun 15.10633 | 2454266.606329 | 18.3560.005 | 2007 Jul 25.01268 | 2454306.512680 | 18.2690.014 |
| 2007 Jun 15.10989 | 2454266.609894 | 18.3470.005 | 2007 Jul 25.01957 | 2454306.519566 | 18.2330.014 |
| 2007 Jun 15.11345 | 2454266.613448 | 18.3430.005 | 2007 Jul 25.02311 | 2454306.523107 | 18.1910.014 |
| 2007 Jun 15.11699 | 2454266.616988 | 18.3290.005 | 2007 Jul 25.03137 | 2454306.531371 | 18.1080.014 |
| 2007 Jun 15.12054 | 2454266.620541 | 18.3200.005 |
| UT Date aaDates are light-time corrected; | Julian Date aaDates are light-time corrected; | bbApparent magnitude. | UT Date aaDates are light-time corrected; | Julian Date aaDates are light-time corrected; | bbApparent magnitude. |
|---|---|---|---|---|---|
| 2007 Jun 10.96450 | 2454262.464497 | 17.3140.009 | 2007 Jun 11.15618 | 2454262.656183 | 17.1400.009 |
| 2007 Jun 10.96670 | 2454262.466696 | 17.2930.009 | 2007 Jun 11.15764 | 2454262.657642 | 17.1510.009 |
| 2007 Jun 10.96809 | 2454262.468085 | 17.2800.009 | 2007 Jun 11.15912 | 2454262.659123 | 17.1600.009 |
| 2007 Jun 10.97004 | 2454262.470041 | 17.2630.009 | 2007 Jun 12.96765 | 2454264.467647 | 17.2910.006 |
| 2007 Jun 10.97143 | 2454262.471430 | 17.2490.009 | 2007 Jun 12.97079 | 2454264.470795 | 17.3090.006 |
| 2007 Jun 10.97282 | 2454262.472819 | 17.2370.009 | 2007 Jun 12.97257 | 2454264.472566 | 17.3360.006 |
| 2007 Jun 10.97491 | 2454262.474913 | 17.2120.009 | 2007 Jun 12.97661 | 2454264.476606 | 17.3440.006 |
| 2007 Jun 10.97637 | 2454262.476371 | 17.1900.009 | 2007 Jun 12.97867 | 2454264.478666 | 17.3620.006 |
| 2007 Jun 10.97782 | 2454262.477818 | 17.1880.009 | 2007 Jun 12.98030 | 2454264.480298 | 17.3690.006 |
| 2007 Jun 10.97930 | 2454262.479299 | 17.1760.009 | 2007 Jun 12.98213 | 2454264.482126 | 17.3510.006 |
| 2007 Jun 10.98076 | 2454262.480758 | 17.1600.009 | 2007 Jun 12.98372 | 2454264.483723 | 17.3900.006 |
| 2007 Jun 11.00040 | 2454262.500399 | 17.1930.009 | 2007 Jun 12.98544 | 2454264.485436 | 17.3900.006 |
| 2007 Jun 11.00186 | 2454262.501856 | 17.1950.009 | 2007 Jun 12.98704 | 2454264.487044 | 17.3840.006 |
| 2007 Jun 11.00330 | 2454262.503303 | 17.2090.009 | 2007 Jun 12.98870 | 2454264.488700 | 17.3900.006 |
| 2007 Jun 11.00476 | 2454262.504761 | 17.2230.009 | 2007 Jun 12.99031 | 2454264.490308 | 17.3860.006 |
| 2007 Jun 11.00622 | 2454262.506220 | 17.2440.009 | 2007 Jun 12.99192 | 2454264.491917 | 17.3900.006 |
| 2007 Jun 11.00823 | 2454262.508233 | 17.2600.009 | 2007 Jun 12.99350 | 2454264.493502 | 17.3700.006 |
| 2007 Jun 11.00969 | 2454262.509692 | 17.2810.009 | 2007 Jun 12.99514 | 2454264.495145 | 17.3630.006 |
| 2007 Jun 11.01115 | 2454262.511149 | 17.2810.009 | 2007 Jun 12.99673 | 2454264.496731 | 17.3670.006 |
| 2007 Jun 11.01260 | 2454262.512596 | 17.3050.009 | 2007 Jun 12.99839 | 2454264.498386 | 17.3560.006 |
| 2007 Jun 11.01404 | 2454262.514043 | 17.3150.009 | 2007 Jun 12.99994 | 2454264.499937 | 17.3590.006 |
| 2007 Jun 11.01580 | 2454262.515802 | 17.3280.009 | 2007 Jun 13.00152 | 2454264.501523 | 17.3350.006 |
| 2007 Jun 11.01727 | 2454262.517272 | 17.3280.009 | 2007 Jun 13.00317 | 2454264.503165 | 17.3320.006 |
| 2007 Jun 11.01873 | 2454262.518730 | 17.3300.009 | 2007 Jun 13.00480 | 2454264.504797 | 17.3250.006 |
| 2007 Jun 11.02018 | 2454262.520176 | 17.3600.009 | 2007 Jun 13.00657 | 2454264.506568 | 17.3050.006 |
| 2007 Jun 11.02162 | 2454262.521623 | 17.3540.009 | 2007 Jun 13.00833 | 2454264.508327 | 17.2880.006 |
| 2007 Jun 11.02323 | 2454262.523232 | 17.3650.009 | 2007 Jun 13.00994 | 2454264.509936 | 17.2680.006 |
| 2007 Jun 11.02468 | 2454262.524678 | 17.3680.009 | 2007 Jun 13.01190 | 2454264.511904 | 17.2510.006 |
| 2007 Jun 11.02615 | 2454262.526148 | 17.3710.009 | 2007 Jun 13.01366 | 2454264.513662 | 17.2480.006 |
| 2007 Jun 11.02761 | 2454262.527607 | 17.3730.009 | 2007 Jun 13.01527 | 2454264.515271 | 17.2290.006 |
| 2007 Jun 11.02905 | 2454262.529052 | 17.3780.009 | 2007 Jun 13.01684 | 2454264.516845 | 17.2210.006 |
| 2007 Jun 11.03132 | 2454262.531321 | 17.3810.009 | 2007 Jun 13.01844 | 2454264.518442 | 17.2020.006 |
| 2007 Jun 11.03277 | 2454262.532768 | 17.3730.009 | 2007 Jun 13.02004 | 2454264.520039 | 17.1960.006 |
| 2007 Jun 11.03423 | 2454262.534226 | 17.3650.009 | 2007 Jun 13.02191 | 2454264.521914 | 17.1950.006 |
| 2007 Jun 11.03570 | 2454262.535696 | 17.3810.009 | 2007 Jun 13.02344 | 2454264.523441 | 17.1890.006 |
| 2007 Jun 11.03714 | 2454262.537143 | 17.3670.009 | 2007 Jun 13.02503 | 2454264.525027 | 17.1810.006 |
| 2007 Jun 11.06471 | 2454262.564711 | 17.1940.009 | 2007 Jun 13.02662 | 2454264.526624 | 17.1820.006 |
| 2007 Jun 11.06617 | 2454262.566169 | 17.1820.009 | 2007 Jun 13.02829 | 2454264.528290 | 17.1890.006 |
| 2007 Jun 11.06763 | 2454262.567628 | 17.1840.009 | 2007 Jun 13.08447 | 2454264.584469 | 17.3290.006 |
| 2007 Jun 11.06913 | 2454262.569132 | 17.1880.009 | 2007 Jun 13.08607 | 2454264.586065 | 17.3010.006 |
| 2007 Jun 11.07058 | 2454262.570579 | 17.1880.009 | 2007 Jun 13.08778 | 2454264.587778 | 17.2920.006 |
| 2007 Jun 11.07210 | 2454262.572095 | 17.1930.009 | 2007 Jun 13.08932 | 2454264.589318 | 17.2670.006 |
| 2007 Jun 11.07355 | 2454262.573553 | 17.1970.009 | 2007 Jun 13.09105 | 2454264.591054 | 17.2640.006 |
| 2007 Jun 11.07500 | 2454262.574999 | 17.1980.009 | 2007 Jun 13.09261 | 2454264.592605 | 17.2300.006 |
| 2007 Jun 11.07646 | 2454262.576458 | 17.2130.009 | 2007 Jun 13.09419 | 2454264.594190 | 17.2220.006 |
| 2007 Jun 11.07792 | 2454262.577916 | 17.2250.009 | 2007 Jun 13.09581 | 2454264.595810 | 17.1980.006 |
| 2007 Jun 11.08353 | 2454262.583529 | 17.2700.009 | 2007 Jun 13.09750 | 2454264.597499 | 17.1840.006 |
| 2007 Jun 11.08499 | 2454262.584988 | 17.2740.009 | 2007 Jun 13.09912 | 2454264.599120 | 17.1710.006 |
| 2007 Jun 11.08643 | 2454262.586434 | 17.2930.009 | 2007 Jun 13.10073 | 2454264.600729 | 17.1670.006 |
| 2007 Jun 11.08789 | 2454262.587892 | 17.3070.009 | 2007 Jun 13.10237 | 2454264.602372 | 17.1500.006 |
| 2007 Jun 11.08934 | 2454262.589339 | 17.3090.009 | 2007 Jun 13.10396 | 2454264.603958 | 17.1460.006 |
| 2007 Jun 11.09200 | 2454262.592001 | 17.3560.009 | 2007 Jun 13.10552 | 2454264.605519 | 17.1310.006 |
| 2007 Jun 11.09346 | 2454262.593459 | 17.3640.009 | 2007 Jun 13.10723 | 2454264.607232 | 17.1500.006 |
| 2007 Jun 11.09493 | 2454262.594929 | 17.3660.009 | 2007 Jun 13.10886 | 2454264.608864 | 17.1310.006 |
| 2007 Jun 11.09637 | 2454262.596375 | 17.4080.009 | 2007 Jun 13.11044 | 2454264.610438 | 17.1370.006 |
| 2007 Jun 11.09783 | 2454262.597833 | 17.3890.009 | 2007 Jun 13.11207 | 2454264.612070 | 17.1370.006 |
| 2007 Jun 11.09978 | 2454262.599777 | 17.4100.009 | 2007 Jun 13.11370 | 2454264.613702 | 17.1350.006 |
| 2007 Jun 11.10124 | 2454262.601236 | 17.4190.009 | 2007 Jun 13.11525 | 2454264.615252 | 17.1540.006 |
| 2007 Jun 11.10272 | 2454262.602717 | 17.4120.009 | 2007 Jun 13.11692 | 2454264.616919 | 17.1590.006 |
| 2007 Jun 11.10419 | 2454262.604187 | 17.4190.009 | 2007 Jun 13.11848 | 2454264.618481 | 17.1770.006 |
| 2007 Jun 11.10563 | 2454262.605633 | 17.4250.009 | 2007 Jun 13.12009 | 2454264.620090 | 17.1780.006 |
| 2007 Jun 11.10780 | 2454262.607797 | 17.4300.009 | 2007 Jun 13.12168 | 2454264.621676 | 17.1860.006 |
| 2007 Jun 11.10924 | 2454262.609244 | 17.4220.009 | 2007 Jun 13.12326 | 2454264.623261 | 17.2130.006 |
| 2007 Jun 11.11070 | 2454262.610702 | 17.4160.009 | 2007 Jun 13.12490 | 2454264.624904 | 17.2300.006 |
| 2007 Jun 11.11216 | 2454262.612161 | 17.4270.009 | 2007 Jun 13.12654 | 2454264.626536 | 17.2490.006 |
| 2007 Jun 11.11361 | 2454262.613607 | 17.4140.009 | 2007 Jun 13.12817 | 2454264.628168 | 17.2340.006 |
| 2007 Jun 11.11600 | 2454262.616002 | 17.4130.009 | 2007 Jun 13.12981 | 2454264.629811 | 17.2880.006 |
| 2007 Jun 11.11746 | 2454262.617461 | 17.3860.009 | 2007 Jun 13.13143 | 2454264.631432 | 17.3000.006 |
| 2007 Jun 11.11892 | 2454262.618919 | 17.3600.009 | 2007 Jun 13.13302 | 2454264.633017 | 17.3320.006 |
| 2007 Jun 11.12038 | 2454262.620377 | 17.3840.009 | 2007 Jun 13.13459 | 2454264.634590 | 17.3260.006 |
| 2007 Jun 11.12184 | 2454262.621836 | 17.3670.009 | 2007 Jun 13.13633 | 2454264.636326 | 17.3350.006 |
| 2007 Jun 11.12435 | 2454262.624347 | 17.3590.009 | 2007 Jun 13.13789 | 2454264.637889 | 17.3500.006 |
| 2007 Jun 11.12583 | 2454262.625828 | 17.3380.009 | 2007 Jun 13.13942 | 2454264.639417 | 17.3790.006 |
| 2007 Jun 11.12729 | 2454262.627286 | 17.3310.009 | 2007 Jun 13.14119 | 2454264.641187 | 17.3720.006 |
| 2007 Jun 11.12874 | 2454262.628744 | 17.3160.009 | 2007 Jun 13.14290 | 2454264.642900 | 17.3830.006 |
| 2007 Jun 11.13019 | 2454262.630191 | 17.2960.009 | 2007 Jun 13.14458 | 2454264.644578 | 17.4000.006 |
| 2007 Jun 11.13174 | 2454262.631742 | 17.2670.009 | 2007 Jun 13.14623 | 2454264.646233 | 17.3780.005 |
| 2007 Jun 11.13320 | 2454262.633200 | 17.2550.009 | 2007 Jun 13.14793 | 2454264.647934 | 17.3810.005 |
| 2007 Jun 11.13466 | 2454262.634658 | 17.2390.009 | 2007 Jul 24.97919 | 2454306.479187 | 17.4120.005 |
| 2007 Jun 11.13612 | 2454262.636116 | 17.2290.009 | 2007 Jul 24.98065 | 2454306.480645 | 17.4170.005 |
| 2007 Jun 11.14613 | 2454262.646127 | 17.1540.009 | 2007 Jul 24.98979 | 2454306.489788 | 17.3890.005 |
| 2007 Jun 11.14843 | 2454262.648430 | 17.1440.009 | 2007 Jul 24.99123 | 2454306.491234 | 17.3670.005 |
| 2007 Jun 11.14989 | 2454262.649888 | 17.1410.009 | 2007 Jul 25.00570 | 2454306.505702 | 17.2870.005 |
| 2007 Jun 11.15137 | 2454262.651370 | 17.1370.009 | 2007 Jul 25.00717 | 2454306.507171 | 17.2770.005 |
| 2007 Jun 11.15283 | 2454262.652828 | 17.1380.009 | 2007 Jul 25.01650 | 2454306.516499 | 17.1990.005 |
| 2007 Jun 11.15427 | 2454262.654274 | 17.1430.009 | 2007 Jul 25.01795 | 2454306.517946 | 17.1700.005 |
| UT Date aaDates are light-time corrected; | Julian Date aaDates are light-time corrected; | bbApparent magnitude. | UT Date aaDates are light-time corrected; | Julian Date aaDates are light-time corrected; | bbApparent magnitude. |
|---|---|---|---|---|---|
| 2007 Jul 6.97424 | 2454288.474241 | 16.500.04 | 2007 Jul 7.07745 | 2454288.577448 | 16.320.03 |
| 2007 Jul 6.98283 | 2454288.482830 | 16.470.04 | 2007 Jul 7.98350 | 2454289.483504 | 16.270.04 |
| 2007 Jul 6.99100 | 2454288.490998 | 16.380.03 | 2007 Jul 7.99131 | 2454289.491311 | 16.280.04 |
| 2007 Jul 6.99918 | 2454288.499178 | 16.330.03 | 2007 Jul 7.99912 | 2454289.499119 | 16.340.04 |
| 2007 Jul 7.00775 | 2454288.507750 | 16.290.03 | 2007 Jul 8.00692 | 2454289.506925 | 16.440.04 |
| 2007 Jul 7.01586 | 2454288.515861 | 16.310.03 | 2007 Jul 8.02456 | 2454289.524560 | 16.540.04 |
| 2007 Jul 7.02574 | 2454288.525740 | 16.420.03 | 2007 Jul 8.03236 | 2454289.532361 | 16.550.04 |
| 2007 Jul 7.03704 | 2454288.537044 | 16.550.04 | 2007 Jul 8.04017 | 2454289.540167 | 16.470.04 |
| 2007 Jul 7.04504 | 2454288.545038 | 16.570.04 | 2007 Jul 8.04800 | 2454289.547996 | 16.420.04 |
| 2007 Jul 7.05309 | 2454288.553091 | 16.550.04 | 2007 Jul 8.05583 | 2454289.555835 | 16.330.04 |
| 2007 Jul 7.06125 | 2454288.561255 | 16.490.03 | 2007 Jul 8.06367 | 2454289.563669 | 16.270.04 |
| 2007 Jul 7.06936 | 2454288.569363 | 16.410.03 | 2007 Jul 8.07147 | 2454289.571465 | 16.270.04 |
| UT Date aaDates are light-time corrected; | Julian Date aaDates are light-time corrected; | bbRatio of the flux density at 1.6m to the flux density at 1.25m. | UT Date aaDates are light-time corrected; | Julian Date aaDates are light-time corrected; | bbRatio of the flux density at 1.6m to the flux density at 1.25m. |
|---|---|---|---|---|---|
| 2007 Jul 6.94315 | 2454288.443153 | 0.710.04 | 2007 Jul 6.94707 | 2454288.447075 | 0.710.04 |
| 2007 Jul 6.95097 | 2454288.450974 | 0.690.04 | 2007 Jul 6.95489 | 2454288.454894 | 0.670.03 |
| 2007 Jul 6.95881 | 2454288.458810 | 0.670.03 | 2007 Jul 6.97032 | 2454288.470325 | 0.690.02 |
| 2007 Jul 6.97424 | 2454288.474241 | 0.680.02 | 2007 Jul 6.97888 | 2454288.478877 | 0.680.02 |
| 2007 Jul 6.98283 | 2454288.482830 | 0.680.02 | 2007 Jul 6.98708 | 2454288.487075 | 0.670.02 |
| 2007 Jul 6.99100 | 2454288.490998 | 0.670.02 | 2007 Jul 6.99527 | 2454288.495273 | 0.680.02 |
| 2007 Jul 6.99918 | 2454288.499178 | 0.690.02 | 2007 Jul 7.00384 | 2454288.503841 | 0.690.02 |
| 2007 Jul 7.00775 | 2454288.507750 | 0.690.02 | 2007 Jul 7.01194 | 2454288.511938 | 0.680.02 |
| 2007 Jul 7.01586 | 2454288.515861 | 0.680.02 | 2007 Jul 7.02182 | 2454288.521819 | 0.670.02 |
| 2007 Jul 7.02574 | 2454288.525740 | 0.670.02 | 2007 Jul 7.03314 | 2454288.533136 | 0.660.02 |
| 2007 Jul 7.03704 | 2454288.537044 | 0.650.02 | 2007 Jul 7.04112 | 2454288.541120 | 0.630.02 |
| 2007 Jul 7.04504 | 2454288.545039 | 0.640.02 | 2007 Jul 7.04918 | 2454288.549176 | 0.660.02 |
| 2007 Jul 7.05309 | 2454288.553091 | 0.640.02 | 2007 Jul 7.05733 | 2454288.557332 | 0.630.02 |
| 2007 Jul 7.06125 | 2454288.561255 | 0.620.02 | 2007 Jul 7.06544 | 2454288.565437 | 0.630.02 |
| 2007 Jul 7.06936 | 2454288.569363 | 0.640.02 | 2007 Jul 7.07356 | 2454288.573560 | 0.650.02 |
| 2007 Jul 7.07745 | 2454288.577448 | 0.660.02 | 2007 Jul 7.08179 | 2454288.581790 | 0.680.02 |
| 2007 Jul 6.93925 | 2454288.439254 | 0.690.04 |