V5116 Sgr, an eclipsing supersoft post-outburst nova?
Abstract
V5116 Sgr (Nova Sgr 2005 No. 2), discovered on 2005 July 4, was observed with XMM-Newton in March 2007, 20 months after the optical outburst. The X-ray spectrum shows that the nova had evolved to a pure supersoft X-ray source, with no significant emission at energies above 1 keV. The X-ray light-curve shows abrupt decreases and increases of the flux by a factor . It is consistent with a periodicity of 2.97 h, the orbital period suggested by Dobrotka et al. (2007), although the observation lasted just a little more than a whole period. We estimate the distance to V5116 Sgr to be . A simple blackbody model does not fit correctly the EPIC spectra, with . In contrast, ONe rich white dwarf atmosphere models provide a good fit, with , , and (during the high-flux periods). This is consistent with residual hydrogen burning in the white dwarf envelope. The white dwarf atmosphere temperature is the same both in the low and the high flux periods, ruling out an intrinsic variation of the X-ray source as the origin of the flux changes. We speculate that the X-ray light-curve may result from a partial coverage by an asymmetric accretion disk in a high inclination system.
Subject headings:
stars: novae, cataclysmic variables — X-rays: individual (V5116 Sgr)1. Introduction
Classical novae occur in close binary systems of the cataclysmic variable type, when a thermonuclear runaway results in explosive hydrogen burning on the accreting white dwarf (WD). It is theoretically predicted that novae return to hydrostatic equilibrium after the ejection of a fraction of the accreted envelope. Soft X-ray emission arises in some post-outburst novae as a consequence of residual hydrogen burning on top of the WD. As the envelope mass is depleted, the photospheric radius decreases at constant bolometric luminosity (close to the Eddington value) with an increasing effective temperature. This leads to a hardening of the spectrum from optical through UV, extreme UV and finally soft X-rays, with the post-outburst nova emitting as a Supersoft Source (SSS) with a hot WD atmosphere spectrum. The duration of this SSS is related to the nuclear burning timescale of the remaining H-rich envelope and depends, among other factors, on the WD mass (Tuchman & Truran, 1998; Sala & Hernanz, 2005a, b).
All post-outburst novae are expected to undergo SSS emitting phase, provided a H-rich envelope is left. Nevertheless, the number and duration of SSS states observed in Galactic novae is small. In a systematic search for the X-ray emission from novae in the ROSAT archive, Orio et al. (2001) found only three SSS novae from a total of 39 novae observed less than ten years after the outburst (GQ Mus, V1974 Cyg, N LMC 1995). After the ROSAT era, observations by Beppo-SAX and Chandra revealed SSS X-ray emission for some more post-outburst novae: V382 Vel (Orio et al., 2002; Burwitz et al., 2002), V1494 Aql, with a puzzling light curve showing a short burst and oscillations (Drake et al., 2003), and V4743 Sgr, also with a very variable light-curve (Ness et al., 2003; Petz et al., 2005). The SSS phase of the recurrent nova RS Oph in the 2006 outburst was monitored with Swift, XMM-Newton and Chandra, and the end of the SSS state occurred less than 100 days after outburst (Bode et al., 2006; Hachisu et al., 2007). XMM-Newton has contributed with some more observations of novae. Nova LMC 1995 showed the SSS emission 5 years after outburst (Orio et al., 2003). Other post-outburst novae were detected with a harder spectrum associated to the expanding ejecta, as Nova LMC 2000 (Greiner et al., 2003) and V4633 Sgr (Hernanz & Sala, 2007), or reestablished accretion flow (V2487 Oph, Hernanz & Sala, 2002; Ferri et al., 2007). More recently, the SSS XMMSL1 J070542.7-381442 was identified as a nova (Read et al., 2007a, b; Torres et al., 2007).
X-ray observations of the central area of M31, with its moderate absorption, offer a good chance to monitor the SSS phase of novae: Pietsch et al. (2005) reported 21 X-ray counterparts for novae in M31 – mostly identified as SSS by their hardness ratios – and two in M33. Following that work, XMM-Newton and Chandra monitoring of M31 between July 2004 and February 2005 provided the detection of eleven out of 34 novae within a year after optical outburst (Pietsch et al., 2007). This suggests that the low fraction of SSS found by Orio et al. (2001) was due to selection effects and/or too poor sampling.
X-ray observations of post-outburst novae provide crucial information: soft X-rays yield a unique insight into the remaining burning envelope on top of the WD, while hard X-rays reveal shocks in the nova ejecta. The properties of “quiescent novae”, once they have turned-off and once accretion is reestablished (which can occur before or after the turn-off), are revealed both in hard and soft X-rays; they emit then as “standard” cataclysmic variables. In view of the scarcity of objects observed and the diversity of behaviors detected, only the monitoring of as many novae as possible, with large sensitivity and spectral resolution (as those offered by XMM-Newton and Chandra) can help to understand post-outburst novae.
V5116 Sgr (Nova Sgr 2005 No. 2) was one of the targets included in our X-ray monitoring programme of post-outburst Galactic novae with XMM-Newton. It was discovered by Liller (2005) on 2005 July 4.049 UT, with magnitude 8.0, rising to mag 7.2 on July 5.085. The expansion velocity derived from a sharp P-Cyg profile detected in a spectrum taken on July 5.099 was 1300 km/s. IR spectroscopy on July 15 showed emission lines with FWHM 2200 km/s (Russell et al., 2005). Photometric observations obtained during 13 nights in the period August-October 2006 show the optical light curve modulated with a period of h (Dobrotka et al., 2007), which the authors interpret as the orbital period. They propose that the light-curve indicates a high inclination system with an irradiation effect on the secondary star. A first X-ray observation with Swift/XRT (0.3–10 keV) in August 2005 yielded a marginal detection with 1.2(1.0) cts/s (Ness et al., 2007a). Two years later, on 2007 August 7, Swift/XRT showed the nova as a SSS, with 0.560.1 cts/s (Ness et al., 2007b). A first fit with a blackbody indicated . More recently, a 35 ks Chandra spectrum obtained on 2007 August 28 was fit with a WD atmospheric model with N cm2 and (Nelson & Orio, 2007).
Here we report on the X-ray light-curve and broad-band spectra of V5116 Sgr as observed by XMM-Newton in March 2007, 609 days after outburst.
2. Observations and data analysis
V5116 Sgr was observed with XMM-Newton (Jansen et al., 2001) on 2007 March 5 (Sala et al., 2007, observation ID: 0405600201, PI: Hernanz). The exposure times were 12.7 ks for the European Photon Imaging Cameras (EPIC) MOS1 and MOS2 (Turner et al., 2001), 8.9 ks for the EPIC-pn (Strüder et al., 2001), 12.9 ks for the Reflection Grating Spectrometers (RGS, den Herder et al., 2001), and 9.2 ks for the Optical Monitor with U filter (OM, Mason et al., 2001).
The observation was affected by an X-ray storm, which produced moderate background in the EPIC cameras for most of the exposure time. Fortunately enough, our target was at least a factor 10 brighter than the background. In addition, the source spectrum is very soft and little affected by solar flares. We therefore do not exclude any time interval of our exposures, but we pay special attention to the background subtraction of both spectra and light-curves. Data were reduced using the XMM-Newton Science Analysis System (SAS 7.1.0). Standard procedures described in the SAS documentation (Loiseau, 2005; Snowden et al., 2004) were followed. We applied flag filter FLAG=0, and only events with pattern smaller than 12 (MOS) and 4 (pn), were selected for the analysis of the EPIC data.
The high flux of the source resulted in pile-up in the three EPIC cameras (used in large partial window mode). We minimize the pile-up effect by extracting both spectra and light-curves from annular regions that exclude the central, piled-up pixels. We determined the optimal extraction region by extracting the source spectra using annular regions with increasing inner radius until we found that the pile-up effect was minimized, keeping a reasonable signal to noise. For the extraction of the source light-curve we use an annular region with inner and outer radii 25 and 38 arcsec (for pn), and 10 and 80 arcsec (for MOS) respectively for the whole exposure time. Background for the MOS cameras was extracted from an annulus region centered on the source, with an external radius of 140 arcsec and an internal radius of 115 arcsec. In the case of the pn, the CCD where the source was detected had no large area without source photons, so we used two box regions in different CCDs, free of sources, for the background light-curve determination. Nevertheless, we could not extract a spectrum completely free of pile-up for the pn camera and we consider only the MOS cameras for broad-band spectral analysis. We increased the statistics for the MOS spectra during the low-flux periods by reducing the inner radii of the source extraction regions down to 5 arcsec. For the high-flux state we increased the inner radii to 40 arcsec to avoid pile-up as much as possible. We have also reduced the RGS data, not affected by pile-up, using the standard procedures. We also find two well differentiated states, coincident in time with the high and low rate periods of the EPIC cameras. The RGS spectra, while compatible with the broad band models used to fit the MOS spectra in this paper, show a number of absorption/emission features that require a detailed spectral analysis, to be presented in a separate work.
3. Light-curve
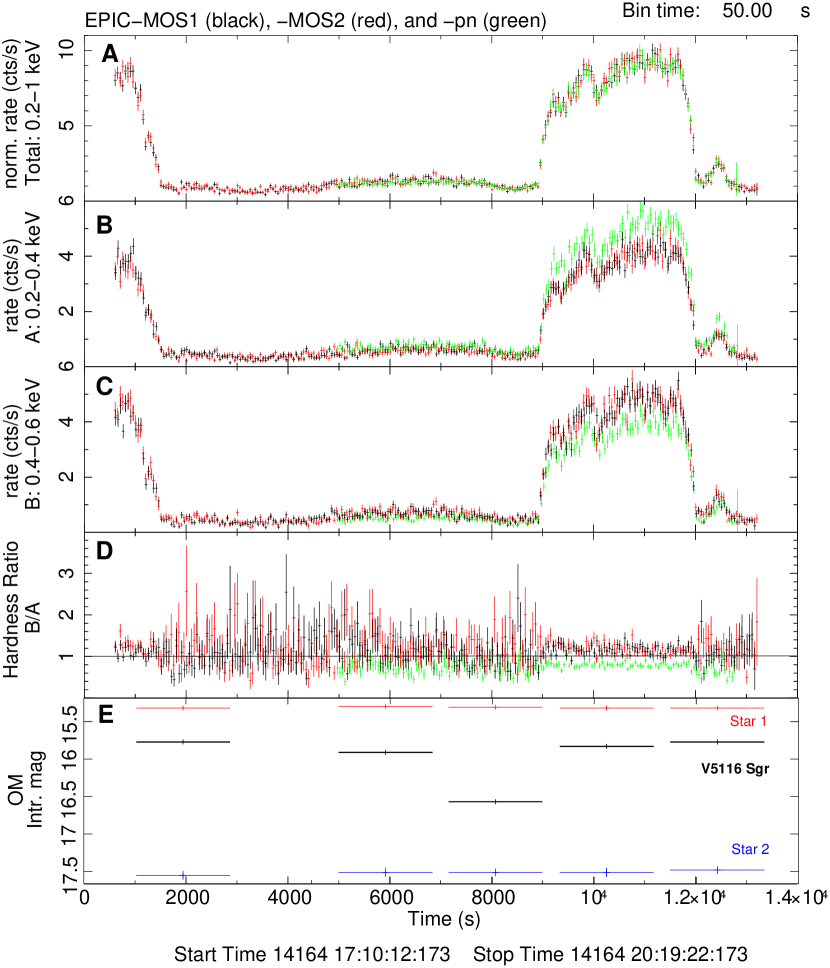
Panel A in Figure 1 shows the background subtracted light-curves of the three EPIC cameras in the 0.2–1.0 keV band. There is no significant flux above 1.0 keV. EPIC-pn experienced full scientific buffer at the beginning of the observation, and started to collect data later than the other instruments. The Y-axis in the EPIC light-curves is only in relative units, since the annulus extraction regions used do not provide the total source rate. For comparison purposes, the 0.2–1.0 keV count-rates have been renormalized for the three EPIC cameras to 10 cts/s (close to the actual maximum count-rate using the annulus extraction region, 10.9 cts/s for MOS1, 10.2 cts/s for MOS2, and 13.1 cts/s in pn).
The X-ray light-curve shows clearly two states: a high-flux state, during the first 600s, and again starting 8300 s after the start of the MOS exposures and lasting for 3000 s; and a low-flux state between 600 s and 8300 s, and during the last 1200 s of the observation. A small flare is observed during the last low-flux period. The count-rate during the low-flux period between 600 s and 8300 s does not show significant variations (25% rms variability). In contrast, the count-rate during the high-state shows flaring activity. If the first decline after the initial high-flux period corresponds to the end of a 3-ks burst like the one starting at 8300 s, this would point to a periodicity in the X-ray light-curve of 10.5–10.7 ks (2.92–2.97 h). This is consistent with the periodicity found in the optical light-curve in August–October 2006 by Dobrotka et al. (2007) ( h), which was suggested by the authors to be the orbital period.
Panels B and C in Figure 1 show the count-rates in two energy bands, 0.2–0.4 keV and 0.4–0.6 keV respectively, for the three EPIC cameras. EPIC-pn shows a softer spectral distribution than the two MOS cameras, especially during the high-flux state. This indicates that pile-up is still affecting the EPIC-pn data (and therefore we do not use them in the spectral analysis). The source is very soft with low signal above 0.6 keV, insufficient to define a third energy band above 0.6 keV. The hardness ratio (Figure 1, panel D) indicates that there are no significant variations of the spectral properties during the whole observational period, even when the rate is increasing by a factor 8–10 in the high-flux phases.
Panel E in Figure 1 shows the light-curve of the OM exposures in the U-band in instrumental magnitudes. The light-curve of two stars in the field of view close to V5116 Sgr are shown for comparison. The OM light-curve is compatible with the 2.97 h periodicity observed by Dobrotka et al. (2007), but its minimum is not correlated either with the maximum or the minimum in X-rays. This points to different origins for the X-ray and UV emission.
4. Spectral analysis
The X-Ray Spectral Fitting Package (XSPEC 11.3, Arnaud & Dorman, 2003) was used for spectral analysis. We used only MOS data for the spectral analysis, since EPIC-pn is too affected by pile-up. Even for the EPIC-MOS cameras, some residual pile-up is likely responsible for a component at energies twice the maximum of the emission, i.e., 0.8-1.0 keV, caused by double events at 0.4-0.5 keV counted as single photons with twice the energy. These lost photons are only a small fraction of the total at the maximum of emission (and cause a small effect in the 0.3–0.5 keV band), but they contribute notably at 0.8–1.0 keV, where the intrinsic flux of the source is very small, if any. This implies that we can trust the spectral analysis only up to 0.7 keV and we can not provide any constraint on a possible reestablished accretion disk. In our spectral fits, we use the phabs model with Wilms et al. (2000) abundances for the foreground absorption.
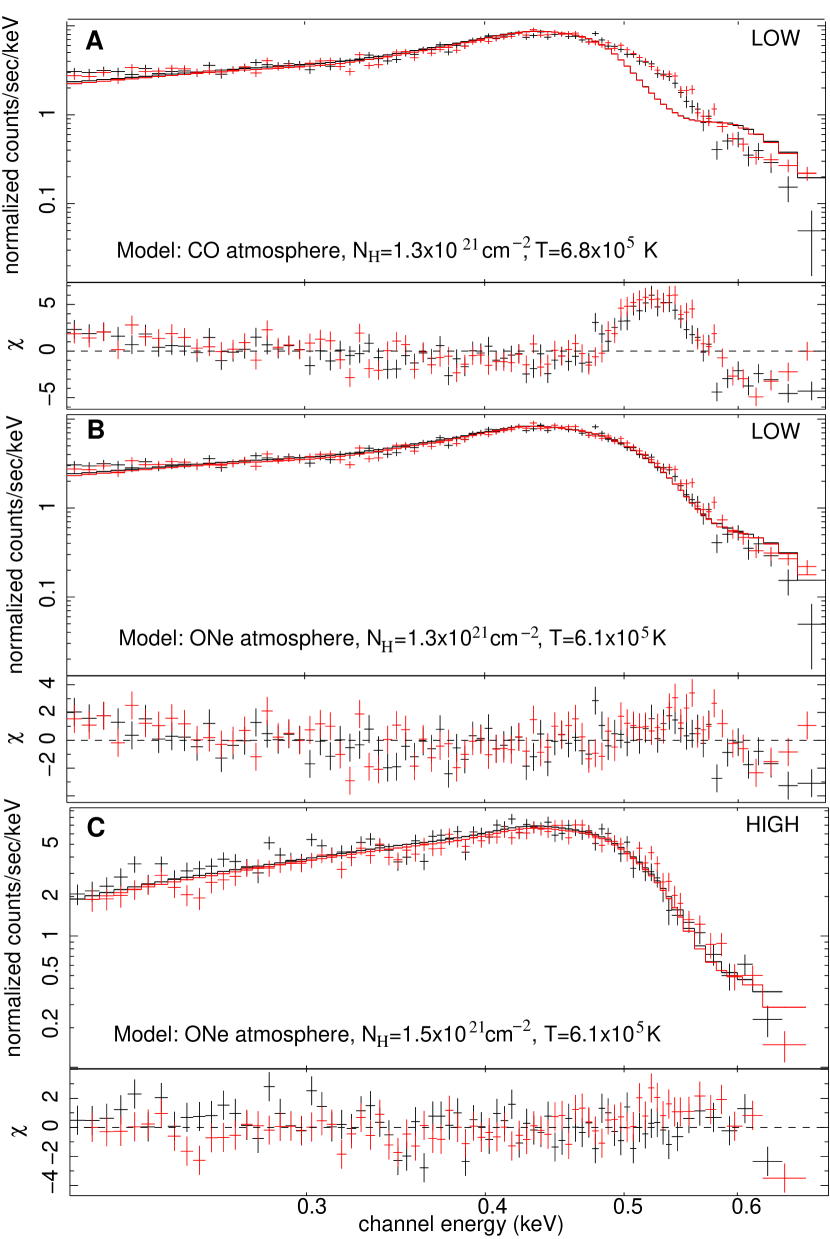
Figure 2 shows the MOS1 and MOS2 spectra during the low-flux period. A first attempt to fit a simple absorbed blackbody model to the data yields an unacceptable fit, with . Therefore we used MacDonald & Vennes (1991) WD atmosphere emission models, gently provided by Jim MacDonald, and built tables to be read as external models in XSPEC. Previous studies have shown the importance of including WD atmosphere models instead of simple blackbodies for a correct broad-band spectral analysis of novae in the SSS phase (Balman et al., 1998; Balman & Krautter, 2001; Orio & Greiner, 1999). Two sets of models are available, corresponding to CO and ONe compositions of the WD. As shown in Figure 2 (panel A), CO atmosphere models do not fit well the data. The main difference between the two types of nova atmospheres at these temperatures is the hard energy tail of ONe models, which is suppressed in CO models due to the C ionization edges (CV at 0.4 keV and CVI at 0.5 keV). The best fit is obtained with the ONe models (Figure 2, panel B), with , , and a luminosity (determined from the normalization constant) . The observed is consistent with the average interstellar absorption towards the source (, Kalberla et al., 2005).
The spectrum during the high-flux state (bottom panel in Figure 2) is well fit with the same ONe WD atmosphere model, with , K, and a normalization constant a factor larger, corresponding to a luminosity .
5. Discussion
V5116 Sgr was detected as a bright SSS by XMM-Newton 20 months after the nova outburst. The temperature of the WD atmosphere indicates that residual hydrogen burning is occurring in the WD envelope. To further confirm the origin of the emission and determine the size of the emitting surface, we need an estimation of the distance. Fortunately enough, the time and magnitude at maximum are quite well determined for V5116 Sgr, with a pre-maximum observation only 24 hours before the maximum. Liller (2005) reported at maximum, and (time required to decline two magnitudes from maximum) was 6.51.0 days (Dobrotka et al., 2007). Using the empirical relation for novae between and (Della Valle & Livio, 1995) the observed implies an absolute magnitude at maximum (we add a 5% error to account for the scatter in the relation). The photometry at maximum indicates (Gilmore & Kilmartin, 2005), and for novae at maximum, intrinsic (van den Bergh & Younger, 1987). This implies . With all this, we estimate the distance to V5116 Sgr to be . For simplicity, we scale the distance dependent parameters to 10 kpc. It is worth noticing that the obtained from our fits indicates (, Zombeck, 2007), consistent with the value obtained from the observed colors.
The luminosity during the high flux periods, together with the atmosphere temperature, indicate a radius of the emitting object . This corresponds to the whole WD surface emitting during the high flux periods and supports residual H-burning as the origin of the SSS emission, rather than any feature related to the accretion stream (boundary layer, hot spot, or hot accretion poles).
The most remarkable feature in V5116 Sgr is the SSS light-curve. Although the observation lasted just a bit longer than an orbital period, we obtain a period compatible with the orbital period of 2.97 hours found by Dobrotka et al. (2007). The fact that the temperature is the same for both the high and the low flux phases indicates that the change in flux cannot be caused by an intrinsic change in the H-burning envelope. The luminosity during the high flux periods also indicates that the whole WD is visible in this state. The decrease by a factor in the flux could be caused by a partial eclipse of the WD. The long duration of the low flux phase and short duration of the high flux phase cannot be reconciled with a partial eclipse by the secondary star. Alternatively, some asymmetric accretion disk could do the job, being responsible for a partial eclipse during most of the orbital period, with a 3 ks window during which the whole WD would be visible. Since no change is observed in the hydrogen absorption column and it is compatible with the average interstellar value both in the low and the high flux spectra, the portion of accretion disk producing the partial eclipse should be optically thick to the soft X-rays. In the particular case of V5116 Sgr, we have checked that an absorbing column of would make it completely opaque to the observed SSS emission. Longer X-ray observations covering at least two periods together with a good timing with the OM camera would be required to disentangle the origin of the X-ray light curve behaviour.
References
- Arnaud & Dorman (2003) Arnaud & Dorman 2003, XSPEC v11.3.x (NASA/GSFC, MD)
- Balman et al. (1998) Balman, S., Krautter, J. & Ögelman, H. 1998, ApJ, 499, 395
- Balman & Krautter (2001) Balman, S. & Krautter, J. 2001, MNRAS, 326, 1441
- Bode et al. (2006) Bode, M.F., O’Brien, T.J., Osborne, J.P. et al. 2006, ApJ, 652, 629
- Burwitz et al. (2002) Burwitz, V, Starrfield, S. et al. 2002, AIP Conf.Proc., 637, 386
- Della Valle & Livio (1995) Della Valle, M. & Livio, M. 1995, ApJ, 452, 704
- den Herder et al. (2001) den Herder, J.W. et al. 2001, A&A, 365, L7
- Dobrotka et al. (2007) Dobrotka, A., Retter, A.& Liu, A. 2007 (arxiv:0710.5701)
- Drake et al. (2003) Drake, J., Wagner, R., Starrfield, S. et al. 2003, ApJ, 584, 448
- Ferri et al. (2007) Ferri, C., Hernanz, M. & Sala, G. 2007, ASP Conf.Ser., 372, 519
- Gilmore & Kilmartin (2005) Gilmore, A.C. & Kilmartin, P.M. 2005, IAUC 8559
- Greiner et al. (2003) Greiner, J., Orio, M. & Schartel, N. 2003, A&A, 405, 703
- Hachisu et al. (2007) Hachisu, I., Kato, M. & Luna, G.J.M. 2007, ApJ, 659, L153
- Hernanz & Sala (2002) Hernanz, M. & Sala, G. 2002, Science, 298, 393.
- Hernanz & Sala (2007) Hernanz, M. & Sala, G. 2007, ApJ, 664, 467.
- Jansen et al. (2001) Jansen, F. et al. 2001, A&A, 365, L1
- Kalberla et al. (2005) Kalberla,P., Burton, W. et al. 2005, A&A, 440, 775
- Liller (2005) Liller, W. 2005, IAUC 8559
- Loiseau (2005) Loiseau, N. 2005, SAS User Guide v3.2 (ESA/XMM SOC, Madrid)
- MacDonald & Vennes (1991) MacDonald, J. & Vennes, S. 1991, ApJ, 373, L51
- Mason et al. (2001) Mason, K.O. et al. 2001, A&A, 365, L36
- Nelson & Orio (2007) Nelson, T & Orio, M. 2007, ATel# 1202
- Ness et al. (2003) Ness, J.U., Starrfield, S., Burwitz, V. et al. 2003, ApJ, 594, L127
- Ness et al. (2007a) Ness, J.U., Schwarz, G., Retter, A. et al. 2007a, ApJ, 663, 505
- Ness et al. (2007b) Ness, J.U., Starrfield, S., Schwarz, G. et al. 2007b, CBET# 1030
- Orio & Greiner (1999) Orio, M. & Greiner, J. 1999, A&A, 344, L13
- Orio et al. (2001) Orio, M., Covington, J. & Ögelman, H. 2001, A&A, 373, 542
- Orio et al. (2002) Orio, M., Parmar, A., Greiner, J. et al. 2002, MNRAS, 333, L11
- Orio et al. (2003) Orio, M., Hartmann, E., Still, M.& Greiner, J. 2003, ApJ, 594, 435
- Petz et al. (2005) Petz,A., Hauschildt,P., Ness,J.U., Starrfield,S. 2005, A&A, 431, 321
- Pietsch et al. (2005) Pietsch, W., Fliri, J., Freyberg, M. et al. 2005, A&A, 442, 879
- Pietsch et al. (2007) Pietsch, W., Haberl, F., Sala, G. et al. 2007, A&A, 465, 375
- Read et al. (2007a) Read, A., Saxton, R. & Esquej, P. 2007a, ATel# 1282
- Read et al. (2007b) Read, A., Saxton, R. et al. 2007b, ATel# 1301
- Russell et al. (2005) Russell, R., Lynch, D. & Rudy, R. 2005, IAUC 8579
- Sala & Hernanz (2005a) Sala, G. & Hernanz, M. 2005a, A&A, 439, 1057.
- Sala & Hernanz (2005b) Sala, G. & Hernanz, M. 2005b, A&A, 439, 1061
- Sala et al. (2007) Sala, G., Hernanz. M. & Ferri, C. 2007, ATel#1184
- Snowden et al. (2004) Snowden, S. et al. 2004, XMM ABC v2.01 (NASA/GSFC, MD)
- Strüder et al. (2001) Strüder, L. et al. 2001, A&A, 365, L18
- Torres et al. (2007) Torres, M., Jonker, P., Challis, P. et al. 2007, ATel# 1285
- Tuchman & Truran (1998) Tuchman, Y. & Truran, J.W. 1998, ApJ, 503, 381
- Turner et al. (2001) Turner, M.J.L. et al. 2001, A&A, 365, L27
- van den Bergh & Younger (1987) van den Bergh, F. & Younger, P.S. 1987, A&AS, 70, 125
- Wilms et al. (2000) Wilms, J., Allen, A. & McCray, R. 2000, ApJ, 542, 914
- Zombeck (2007) Zombeck, M.V. 2007, Handbook of Space Astronomy and Astrophysics, Cambridge Univ. Press, 2007, 3rd ed.