Observational signatures of numerically simulated MHD waves in small-scale fluxtubes
Abstract
We present some results obtained from the synthesis of Stokes profiles in small-scale flux tubes with propagating MHD waves. To that aim, realistic flux tubes showing internal structure have been excited with 5 min period drivers, allowing non-linear waves to propagate inside the magnetic structure. The observational signatures of these waves in Stokes profiles of several spectral lines that are commonly used in spectropolarimetric measurements are discussed.
(1) Instituto de Astrofísica de Canarias, 38205, C/ Vía Láctea, s/n, Tenerife, Spain
(2) Main Astronomical Observatory, NAS, 03680 Kyiv, Zabolotnogo str. 27, Ukraine
1. Introduction
The observed wave behaviour in network and facular solar regions, and the role of waves to connect photospheric and chromospheric layers, have drawn a considerable discussion in the recent literature, since it has been proposed that thin magnetic flux tubes in these regions can act as wave guides, supplying energy to the upper layers, in particular for waves with periodicity in the 5-min range (De Pontieu et al. 2004). However, observational studies of the relation between the photospheric and chromospheric signals do not provide a unique picture. It is not clear whether the oscillations remain coherent through the atmosphere (Lites et al. 1993; Krijger et al. 2001; Judge et al. 2001; Centeno et al. 2006). There are some hints that the coupling between the photosphere and the chromosphere is within vertical channels (Judge et al. 2001; Centeno et al. 2006), however, other results point toward inclined wave propagation (Bloomfield et al. 2006; De Pontieu et al. 2003). In particular, all these studies point out the important role of the magnetic canopy and the transformation layer. The dominance of long-period oscillations in the chromosphere of these regions, also remains to be explained.
Here we perform numerical simulations of magneto-acoustic waves in small-scale flux tubes, with a subsequent Stokes diagnostics. We address the questions of coherence of oscillations through the atmosphere, wave behaviour at the canopies and the change of the wave period with height.
2. Simulations and spectral synthesis
We have solved numerically the set of non-linear 2D MHD equations using the code described in Khomenko & Collados (2006, 2007). As initial condition, we have used a magnetostatic flux tube model constructed following the method by Pneuman et al. (1986), with a radius of 100 km at the base of the photosphere. This model is a second order approximation to a thin flux tube and has both vertical and horizontal variations in all atmospheric parameters. The magnetic field along the flux tube axis varies with height from 740 G in the photosphere to 37 G at z=2000 km, and the plasma decreases from 4 to 7. We compare here three simulation runs. In the first one, oscillations were excited by a photospheric driver with horizontal velocity given by , where km, sec, m s-1 is the initial velocity amplitude at the photosphere and corresponds to the position of the tube axis. This run was performed in an adiabatic regime. In the other two runs, oscillations were excited by a periodic photospheric driver in vertical velocity with the same horizontal and temporal dependence as before. One of these runs was adiabatic while the other was carried out with a radiative relaxation time of s (constant through the whole atmosphere). The radiative losses were described by Newton’s law of cooling. The Stokes spectra of the Fe i pair of lines at 1.565 m and of the Si i line at 1.083 m were synthesized with the help of the SIR code (Ruiz Cobo & del Toro Iniesta 1992) for each horizontal position and time step as emerging at solar disk center.
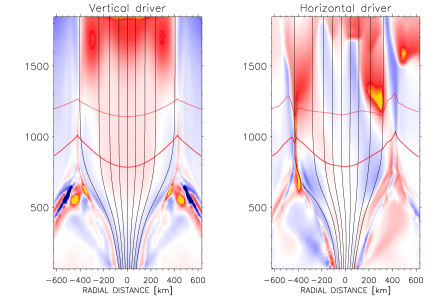
Fig. 1 compares two snapshots of the adiabatic simulations with a vertical (left) and horizontal (right) driver. The vertical driver excites in the photosphere the fast (acoustic) mode and the surface mode. The fast mode is transformed into the slow acoustic mode after the height and continues up to the chromosphere forming shocks with an amplitude of 3–5 km s-1. Note that, in the case of the vertical driver, all variations are approximately in phase on both sides of the flux tube. The horizontal driver excites in the photosphere the slow (magnetic) mode and also the surface mode. The slow mode produces shaking of the tube in horizontal direction. After the transformation layer, most of the energy of the slow magnetic mode goes, again, to the slow acoustic mode. Note that, in these simulations with the horizontal driver, the variations are approximately in antiphase on both sides of the flux tube at photospheric heights. For more details on these simulations, see Khomenko & Collados (2007).
3. Surface mode and acoustic mode signatures
Fig. 2 gives the time evolution of the Stokes spectra of the Fe i 1564.8 nm line for different cases (see figure caption). In the case of the simulations with a horizontal driver the variations of the synthesized Stokes profiles are due to the surface wave. The slow mode is transversal and does not produce any significant variations of the vertical velocity. The variations of amplitude and zero-crossing shift of the Stokes profiles are in antiphase. As can be observed from panel (c) of Fig. 2, these variations cancel out in the case of observations with insufficient spatial resolution. Thus, no time variations of the velocity (nor of any other parameter characteristic of the profiles) would be detected in the photosphere at the solar disc center if the driver that produces oscillations is purely horizontal.
In the case of the simulations with the vertical driver, time variations of the Stokes profiles are mainly caused by the fast acoustic mode. The oscillations are in phase on both sides of the tube. Thus, spatial averaging does not affect the resulting variations to a large extent (Fig. 2f). An observer would detect low spatial resolution velocity oscillations with an amplitude of some 150 m s-1 and Stokes amplitude variations of 10-3, in units of the continuum intensity. Note also that, according to Fig. 1 (left panel), the phase of the oscillations changes rather slowly with height. Thus, oscillations detected in the photosphere and the chromosphere would be coherent (with some delay) if the driver that excites oscillations has a vertical component.
4. Waves at canopies
Horizontal photospheric shaking of the flux tube due to the slow mode in the simulations with a horizontal driver produces strong compression on the interfaces between the flux tube and its non-magnetic surroundings. Due to that, already at the heights of formation of the Si i line, the vertical velocity variations induced by the surface mode show a weak non-linear behaviour, which is illustrated in Figs. 3 and 4.
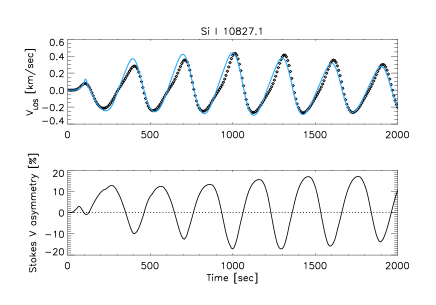
An inspection of the temporal evolution of the simulations (Figs. 3) reveals an increase of the vertical velocity amplitude just at the border between the flux tube and the field free atmosphere and the absence of any significant velocity variations outside the flux tube. These abrupt changes produce a weak shock wave behaviour of the zero-crossing velocity calculated from the Stokes profiles of the Si i line (upper panel of Fig. 4). For comparison, we also show in this figure a velocity curve extracted directly from the simulations at the corresponding height. The similarity between both curves is evident, confirming that the variations of the Si i Stokes zero-crossing position are related to heights about 300-350 km in the photosphere. The magnetic field discontinuity, together with the velocity variations, at the field-free interface produce strong asymmetries of the Stokes profiles. The variation of the Stokes amplitude asymmetry can be as large as 20% (bottom panel of Fig. 4). As expected, the asymmetry is anticorrelated with the zero-crossing velocity, being maximum when the velocity reaches maximum upward values.

5. Power spectra at different heights
In the above sections, adiabatic simulations have been discussed. The simulations with a vertical driver including radiative losses are qualitatively similar to those without radiative losses. In the photosphere, both the surface and the fast modes are generated and fast-to-slow mode transformation is observed at the layer. However, there is an important difference. In the adiabatic simulations, the frequency of the oscillations changes with height, due to the non-linear generation of the secondary harmonics, from 3 mHz to 6 mHz. The oscillations excited by the driver at 3 mHz are evanescent already in the photosphere and, thus, can not propagate, unlike their higher frequency harmonics. This is not the situation if oscillations are allowed to exchange radiative energy with their surroundings. Including energy losses is formally equal to reducing the effective cut-off frequency of the atmosphere by a certain amount (Roberts 1983; Centeno et al. 2006; Khomenko et al. 2008). Thus, waves at 3 mHz can propagate through the whole atmosphere.
Fig. 5 gives the power spectra of oscillations at different heights. The solid curve is obtained from the Fe i line profiles, i.e. corresponds to the deep photosphere. There, the dominating frequency is that of the driver, 3 mHz. Higher up, in both, adiabatic and non-adiabatic vertically-driven, simulations, power at higher frequencies starts to appear. This can be appreciated from the dashed curve obtained from the Si i profiles. There is still not much difference between the adiabatic and non-adiabatic simulations at photospheric heights. The dotted curves correspond to the vertical velocity variations at a height of about 1500 km, in the chromosphere. Now, the adiabatic simulations show a clear shift of the power to higher frequencies, while non-adiabatic simulations have the dominant oscillations at the frequency of the driver at 3 mHz. This implies that vertical thin magnetic structures, such as flux tubes, can channel 5-minute oscillations from the photosphere to the chromosphere if radiative effects are taken into account.
6. Conclusions
In this paper we have studied the wave behaviour in small-scale flux tubes by means of non-linear numerical simulations and Stokes diagnostics. The following items summarize our conclusions.
(i) If the driver that excites oscillations has a vertical component, velocity oscillations with an amplitude of some 150 m s-1 and Stokes amplitude oscillations of 10-3, in units of the continuum intensity, may be detected in low spatial resolution observations. The oscillations are coherent through the whole atmosphere (with the corresponding time delay due the upward propagation).
(ii) If the driver that excites oscillations is purely horizontal, no variations would be detected in observations with reduced spatial resolution, since the vertical velocity variations are produced by the surface mode and are in antiphase on both sides of the tube.
(iii) The LOS velocity shows a weak non-linear behaviour in canopy regions, already at heights of 300–350 km in the photosphere.
(iv) It is important to take into account the radiative losses of oscillations. They can produce a decrease of the effective cut-off frequency, making possible the propagation of the 5-min oscillations in the chromosphere in vertical small-scale magnetic structures.
Acknowledgments.
Financial support by the European Commission through the SOLAIRE Network (MTRN-CT-2006-035484) and by the Spanish Ministery of Education through projects AYA2007-66502 and AYA2007-63881 is gratefully acknowledged.
References
- Bloomfield et al. (2006) Bloomfield, D. S., McAteer, R. T. J., Mathioudakis, M., Keenan, F. P. 2006, ApJ, 652, 812
- Centeno et al. (2006) Centeno, R., Collados, M., Trujillo Bueno, J. 2006, in R. Casini, B. W. Lites (eds.), Solar Polarization 4, Vol. 358, ASP Conference Series, 465
- Judge et al. (2001) Judge, P. G., Tarbell, T. D., Wilhelm, K. 2001, ApJ, 554, 424
- Khomenko et al. (2008) Khomenko, E., Centeno, R., Collados, M., Trujillo Bueno, J. 2008, ApJ, submitted
- Khomenko & Collados (2006) Khomenko, E., Collados, M. 2006, ApJ, 653, 739
- Khomenko & Collados (2007) Khomenko, E., Collados, M. 2007, Solar Phys., submitted
- Krijger et al. (2001) Krijger, J. M., Rutten, R. J., Lites, B. W., Straus, T., Shine, R. A., Tarbell, T. D. 2001, A&A, 379, 1052
- Lites et al. (1993) Lites, B. W., Rutten, R. J., Kalkofen, W. 1993, ApJ, 414, 345
- De Pontieu et al. (2003) De Pontieu, B., Erdelyi, R., de Wijn, A. G. 2003, ApJ, 595, L63
- De Pontieu et al. (2004) De Pontieu, B., Erdelyi, R. J., Stewart, P. 2004, Nat, 430, Issue 6999, 536
- Ruiz Cobo & del Toro Iniesta (1992) Ruiz Cobo, B., del Toro Iniesta, J. C. 1992, ApJ, 398, 375
- Pneuman et al. (1986) Pneuman, G. W., Solanki, S. K., Stenflo, J. O. 1986, A&A, 154, 231
- Roberts (1983) Roberts, B. 1983, Solar Phys., 87, 77