On the relationship between a giant radio galaxy MSH 0522 and the ambient large-scale galaxy structure
Abstract
We present a comparison of the properties of a giant radio galaxy and the ambient intergalactic medium, whose properties are inferred from the large-scale distribution in galaxies. The double lobes of the radio galaxy MSH 0522 are giant—1.8 Mpc projected linear size—and interacting with the environment outside the interstellar medium and coronal halo associated with the host galaxy. The radio lobes appear to be relicts and the double structure is asymmetric. We have examined the large-scale structure in the galaxy distribution surrounding the radio source. The host galaxy of MSH 0522 is associated with a small group that lies close to the boundary of sheet-like and filamentary density enhancements, and adjacent to a void. Assuming that the galaxies trace gas, the asymmetries in the radio morphology in this case study appear related to the anisotropy in the medium. However, the observed overdensities and structure formation models for the heating of the intergalactic medium (IGM) suggest a density-temperature product for the IGM environment that is an order of magnitude below that expected from the properties of the radio source. The discordance suggests that even sources like MSH 0522, which are observed in the relatively low-density IGM environment associated with the filamentary large-scale structure and have multiple signatures of being relicts, may be overpressured and evolving towards an equilibrium relaxed state with the ambient IGM. In this picture, relaxed relicts outside cluster and group environments would have surface brightness well below that observed in MSH 0522 and the detection limits of current wide-field radio surveys. Alternately, it is speculated that astrophysical feedback originating in galaxy overdensities observed 1–2 Mpc to the N and NE of MSH 0522 might be the mechanism for the heating of the ambient IGM gas. In such a scenario, MSH 0522 would be a relaxed relict in equilibrium with the IGM environment and such feedback might additionally aid in the formation of the observed asymmetries in the radio morphology.
Subject headings:
cosmology: observations — galaxies: individual (MSH 0522) — — intergalactic medium — galaxies: jets — radio continuum: galaxies — large-scale structure of Universe1. Introduction
Young radio sources evolve within the host interstellar medium; as they grow larger the radio structures presumably interact with the coronal X-ray halos (Forman, Jones & Tucker, 1985; O’Sullivan & Ponman, 2004) of their host elliptical galaxy. Not only the lobe morphology, but also the lobe separation asymmetries, are believed to be influenced by the environment in which the radio galaxy evolves. For example, associated extended emission line regions have been shown to retard the growth of the lobe on that side (McCarthy et al., 1991).
Galaxies that host active galactic nuclei (AGNs) occur in a range of environments and the jets from the central engines in these galaxies encounter a variety of conditions as they emerge into the intergalactic medium (IGM). Membership and proximity to clusters, groups, and the filaments and sheets in the large scale structure of the Universe might all determine the gaseous intergalactic environment and these would, additionally, depend on cosmic epoch. Within clusters of galaxies, the prevailing intracluster winds and galaxy peculiar velocities shape the lobes of double radio sources into head-tail and wide-angle morphologies (Bliton et al., 1998). Outside clusters and groups, giant radio sources whose linear sizes are in the range of several megaparsecs evolve in the more tenuous intergalactic medium, the nature of which is obscure. Asymmetries caused by jet-IGM interactions would be expected to be manifest particularly in circumstances where the host galaxies are at the edge of galaxy clusters or filamentary structures or more generally at the edge of galaxy overdensities.
Saripalli et al. (1986) investigated the pronounced asymmetry in the lobe lengths of a small number of relatively nearby giant radio galaxies and found that the shorter lobe was preferentially located on the side that had excess galaxies over the background. The asymmetry was presumably a result of the higher density of gas associated with galaxy clustering seen on that side; this is consistent with the expectation that the large-scale intergalactic gaseous medium would be traced by the distribution of galaxies.
Large scale redshift surveys have revealed the richness in galaxy distribution structures—galaxies are observed to form criss-crossing chains and sheets several megaparsec wide with regions largely devoid of galaxies in between. Most giant radio galaxies do not belong to rich clusters of galaxies; they tend to populate regions with low galaxy density, corresponding to galaxy filamentary structures. Therefore, the medium associated with this component of the large scale structure is of relevance. While galaxy clusters are known to be permeated with hot thermal gas (seen via X-ray emission), little is known regarding gas associated with galaxy filaments.
Simulation studies of galaxy formation (Cen & Ostriker, 1999; Davé et al., 2001) have suggested the existence of a warm-hot intergalactic medium (WHIM) at low redshifts. The puzzling deficit in the baryon content of the low-redshift Universe was identified with the WHIM: a gas that is intermediate in temperature between warm photo-ionized gas in voids and hot intracluster gas, and is too low in density to be easily detectable in X-rays. The bulk of this gas is believed to be distributed along galaxy filaments and traced by moderate overdensities; it mostly lies outside of virialized structures like groups or clusters. The gas is believed to be enriched via outflowing galactic superwinds from supernovae in galaxies; as a consequence, highly ionized oxygen and neon are considered important species that would render the WHIM visible via absorption of the continuum emission of background quasars. There are several ongoing searches for this absorption signature and today there is tantalizing evidence for the WHIM via such methods (see, for example, Nicastro et al. (2005)). However, we recognise that the background AGN population is sparse, and sparser still are powerful AGN capable of rendering robust absorption detections. Additional and independent probes of this key component of the intergalactic medium are, therefore, highly desirable.
The WHIM gas is believed to have been heated as a result of hydrodynamic shocks during the non-linear evolution of the large-scale filamentary structure in the Universe. However, there are likely to be additional complex astrophysical feedback mechanisms that might very well be a significant contributor to the entropy content of the WHIM. This is an additional motivation for observations that probe the WHIM gas properties and provide constraints on feedback mechanisms.
In this paper we have for the first time used radio observations of a 1.8 Mpc giant radio galaxy MSH 0522 (referred to as 0503286 by Saripalli et al. (1986) and Subrahmanya & Hunstead (1986)) and galaxy redshift surveys to compare the properties of the synchrotron plasma lobes with the properties of the ambient IGM, which is believed to be the WHIM in this particular case. Motivated by the earlier hypothesis that the lobe extent asymmetry in this source might be related to the asymmetry in the sky distribution in galaxy number density, we have measured redshifts of galaxies over a large area around the radio source. Using these new data, along with archival redshift measurements, we have constructed the 3D distribution of galaxies around the radio source and identified galaxy filaments that might be responsible for the asymmetry. Our modeling of the evolution of this radio source leads to inferences for the properties of the gas associated with the large-scale structure. With this case study we illustrate how giant radio galaxies may be useful probes of the IGM gas.
We organise the paper as follows: we begin with an introduction to the giant radio galaxy MSH 0522 in Section 2. In Section 3 we present our new Very Large Array (VLA) and Molonglo Observatory Synthesis Telescope (MOST) images of this radio source. The next section describes the galaxy redshift data: first we discuss the optical field over nearly radius and then we present our 2-degree field (2dF) spectroscopy with the Anglo-Australian telescope (AAT). In Section 5 we derive physical properties of the radio source. Section 6 presents an estimation of the properties of the ambient intergalactic medium for comparison with the expectations based on the internal properties of the source; section 7 examines plausible causes for asymmetries in the source; section 8 is a concluding discussion.
Throughout we adopt a flat cosmology with Hubble constant = 71 km s-1 Mpc-1 and matter density parameter . The optical host for the radio source is the luminous elliptical galaxy ESO 422-G028 (also cataloged as MCG 05-13-003; with J2000.0 coordinates R.A. 05h 05m , decl. 28 35 ). The redshift of the giant radio galaxy was first measured by Saripalli et al. (1986) and Subrahmanya & Hunstead (1986); more recently the 6dF redshift survey (Jones et al., 2004) gave an improved value of z=0.038286. At this redshift kpc and MSH 0522, with an angular size of , has a projected linear size of 1.8 Mpc.
2. MSH 0522
MSH 0522 was discovered to be a giant radio galaxy by two quite independent methods (Saripalli et al., 1986; Subrahmanya & Hunstead, 1986) and discussed in Saripalli (1988). Arcmin-resolution radio images in the frequency range 843 MHz to 2.7 GHz were presented there and show a large-angular-size double, with disjoint elongated lobes oriented roughly NS and with a core component lying in between at the location of the host galaxy. The double radio source is one of the most asymmetric among giant radio sources: as seen projected on the sky, the southern lobe of this radio galaxy extends twice as far from the core compared to the northern lobe. An additional morphological peculiarity is that while the core, southern jet and southern lobe appear collinear, the northern lobe appears significantly displaced to the west of this radio axis. Saripalli et al. (1986) also noted the presence of a higher density of galaxies on the sky to the north and east of the host galaxy and suggested that the asymmetric galaxy distribution might be a clue to the cause of the morphological peculiarities. The radio observations presented in Saripalli et al. (1986) and Subrahmanya & Hunstead (1986) were followed up with VLA observations at 20 and 6 cm wavelengths in order to image the detailed structure and polarization in the lobes and the core. Preliminary images were presented in Saripalli (1988); in this paper we present a re-analysis of the VLA data that has resulted in significantly better quality images in total intensity and polarization with much improved dynamic range.
3. Radio continuum imaging
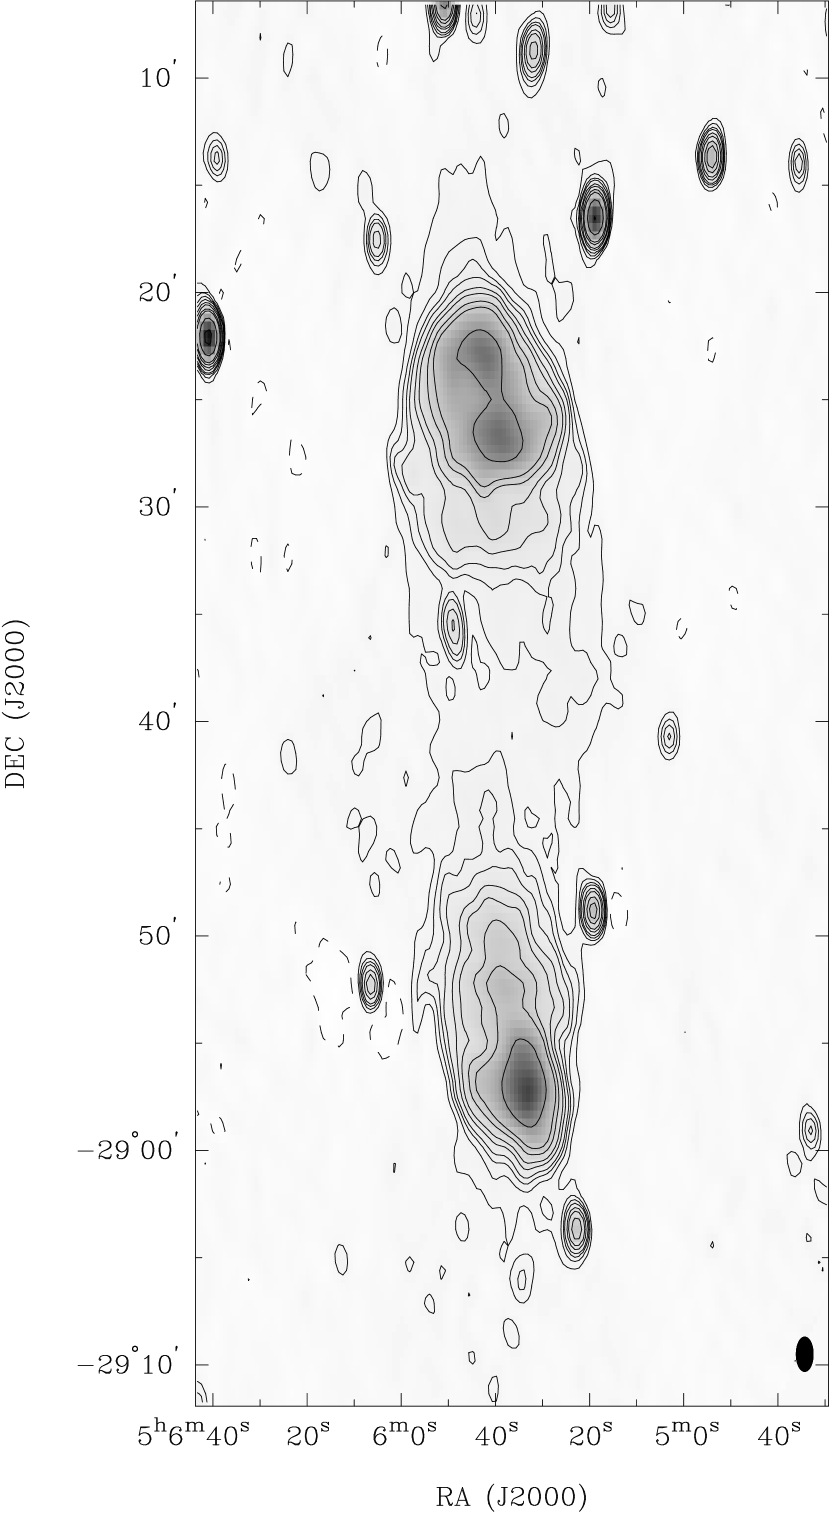
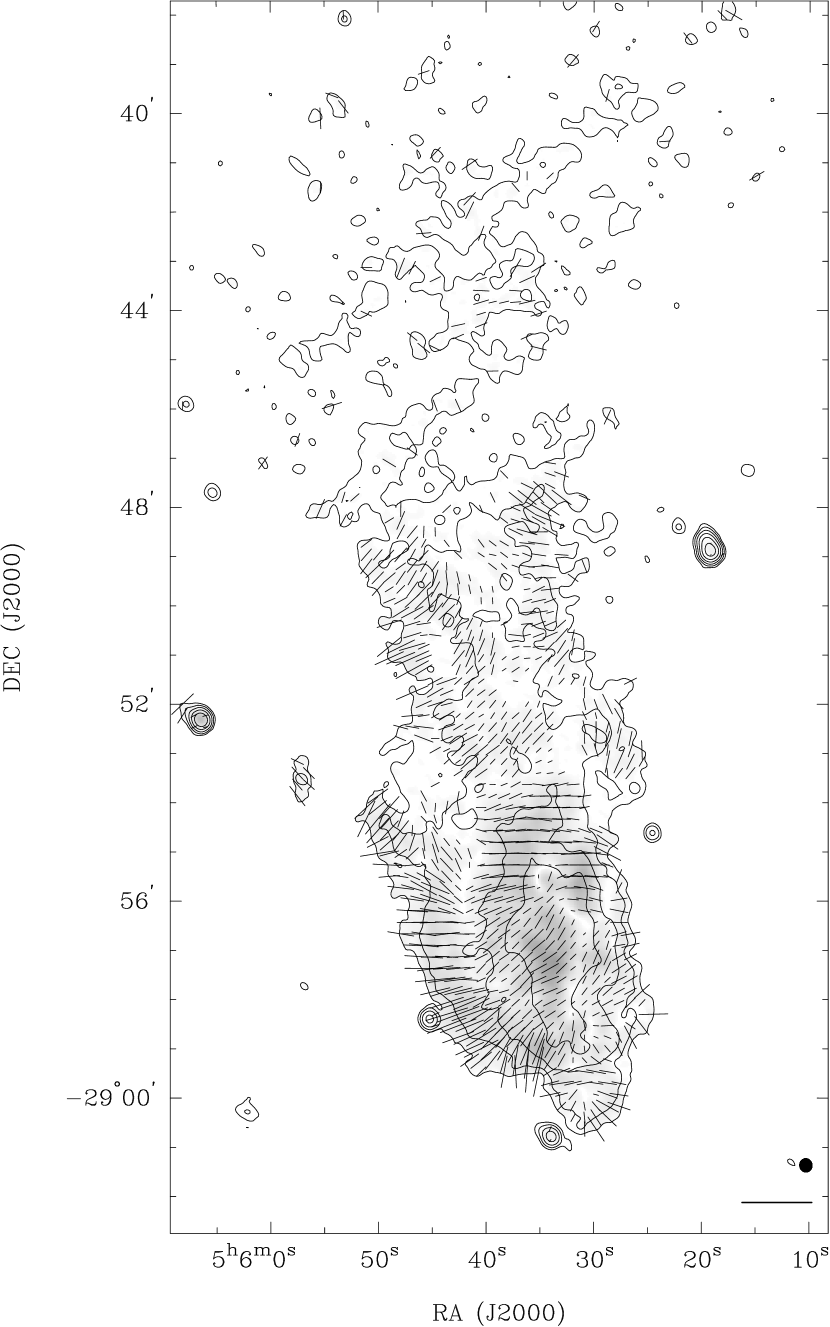
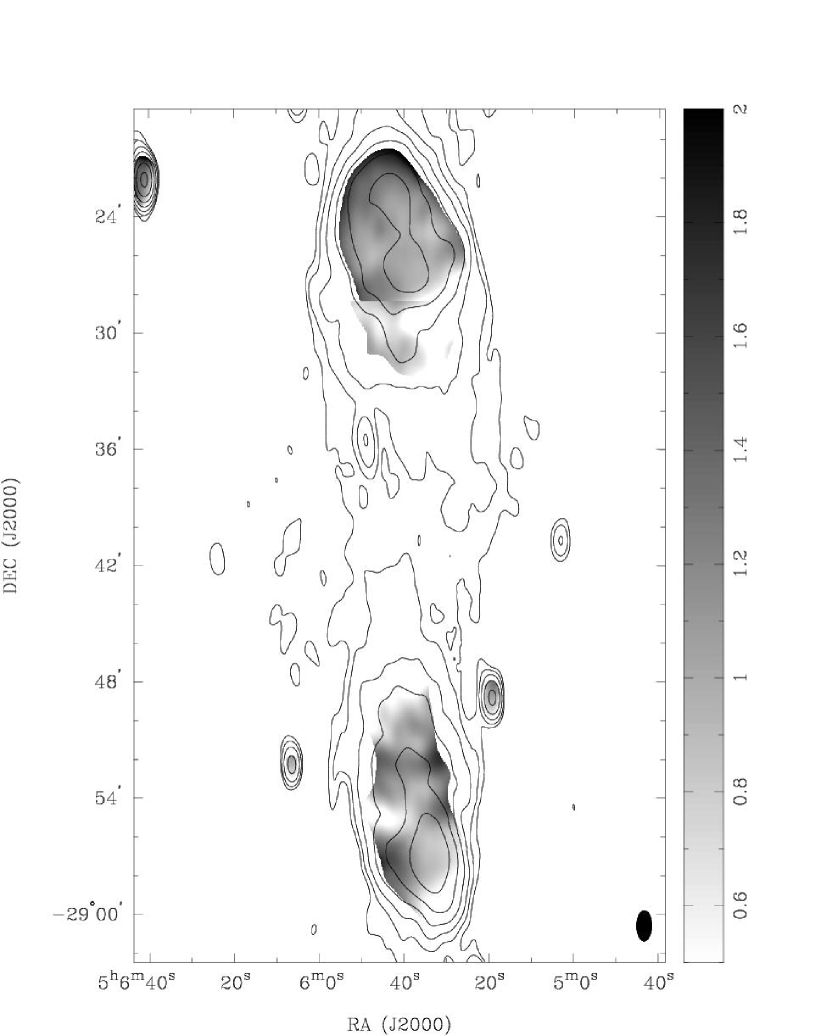
An 843 MHz image of MSH 0522 made with the MOST is shown in Fig. 1. The image has been made with a beam of full width at half maximum (FWHM) at a position angle (P.A.) of and has an rms noise of 0.8 mJy beam-1. At 843 MHz, the flux densities of the northern and southern lobes are 2.82 and 2.04 Jy respectively, where the systematic calibration errors are less than 5%.
MSH 0522 was observed in the CnB array configuration of the Very Large Array (VLA). A configuration with the long northern arm was selected so that projected baselines would have roughly equal ranges in NS and EW despite the southern declination of the source. Observations were made in 6-hr sessions around transit on 19 and 20 October, 1986. Observations in the 20-cm band were made using a pair of 25-MHz bands centered at 1415 and 1635 MHz. These observations were made in mosaic mode with two antenna pointings separated in declination by to cover the two lobes of the NS oriented double radio source. Observations in the 6-cm band were made using a pair of 50-MHz bands centered at 4835 & 4885 MHz; these observations were made using a single antenna pointing towards the radio core. The schedule cycled through 20-cm observations towards the two lobes, 6-cm observations towards the core and calibrators.
The visibility data in the individual pointings and in each of the observing bands were separately calibrated in amplitude, phase and for instrumental polarization using standard AIPS procedures. The flux density scale was set on the scale of Baars et al. (1977) using observations of 3C48 at all frequencies. Complex gain calibration was initially done using frequent observations of PMN J04532807; the 20-cm data were then iteratively self-calibrated in amplitude and phase to improve the dynamic range. The antenna polarization leakage corrections were derived from the data on PMN J04532807, which covered a wide range of parallactic angles, and the phase angle between the orthogonal polarizations was determined using the observation of the linearly polarized source 3C286.
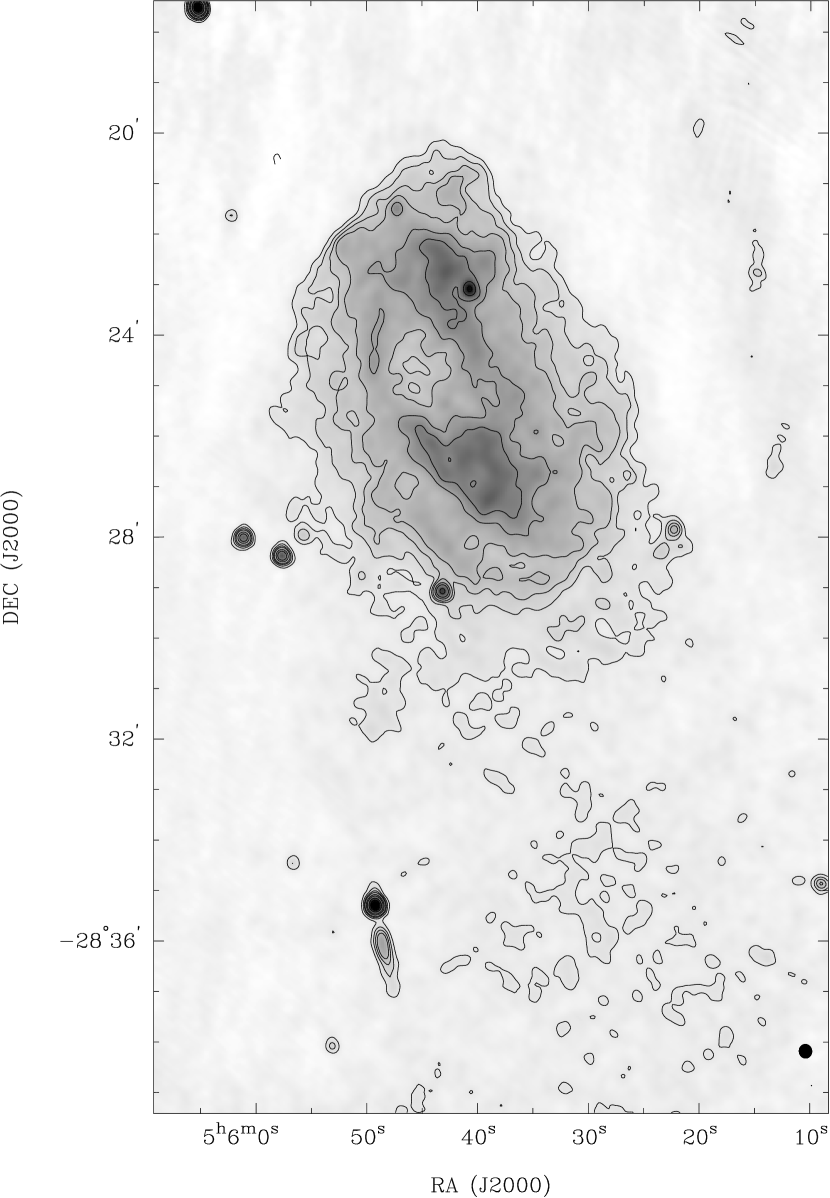
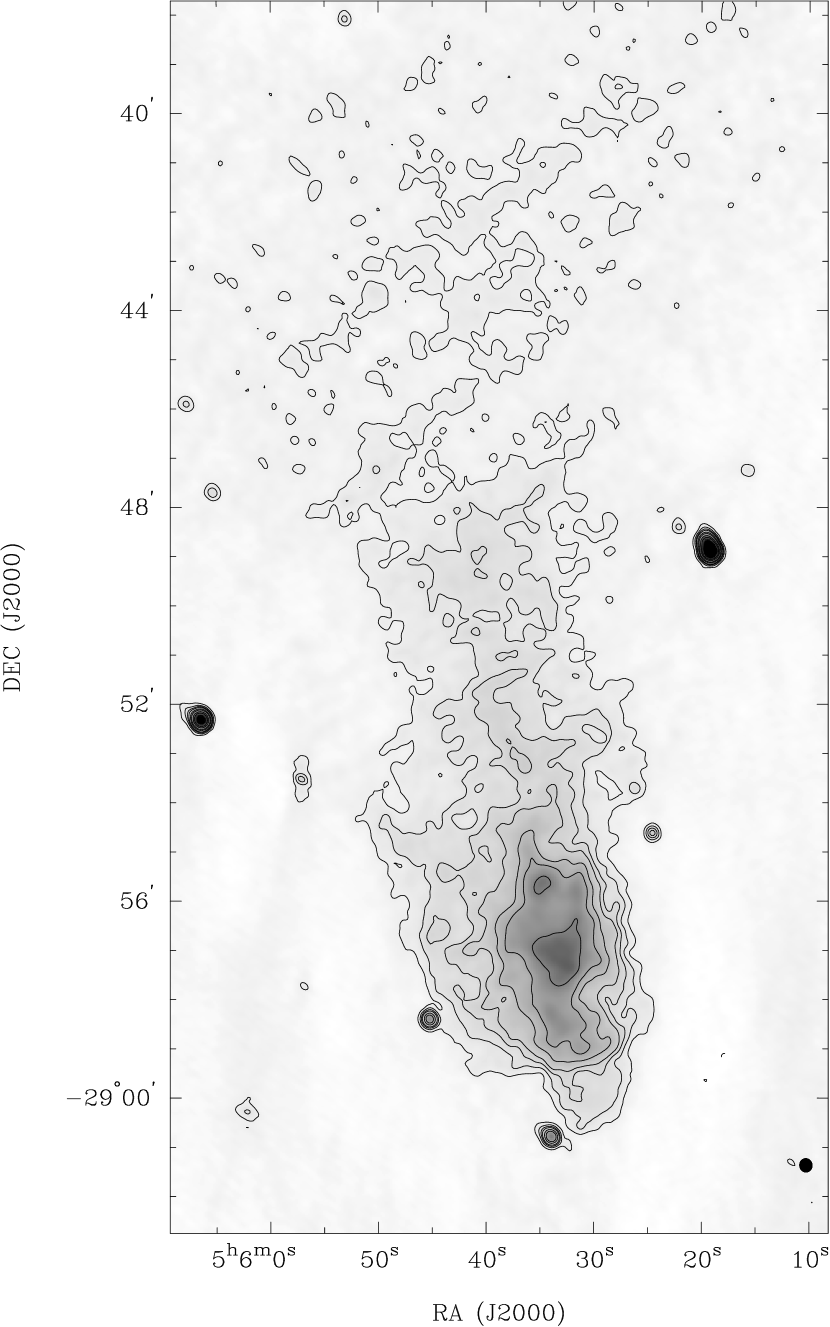
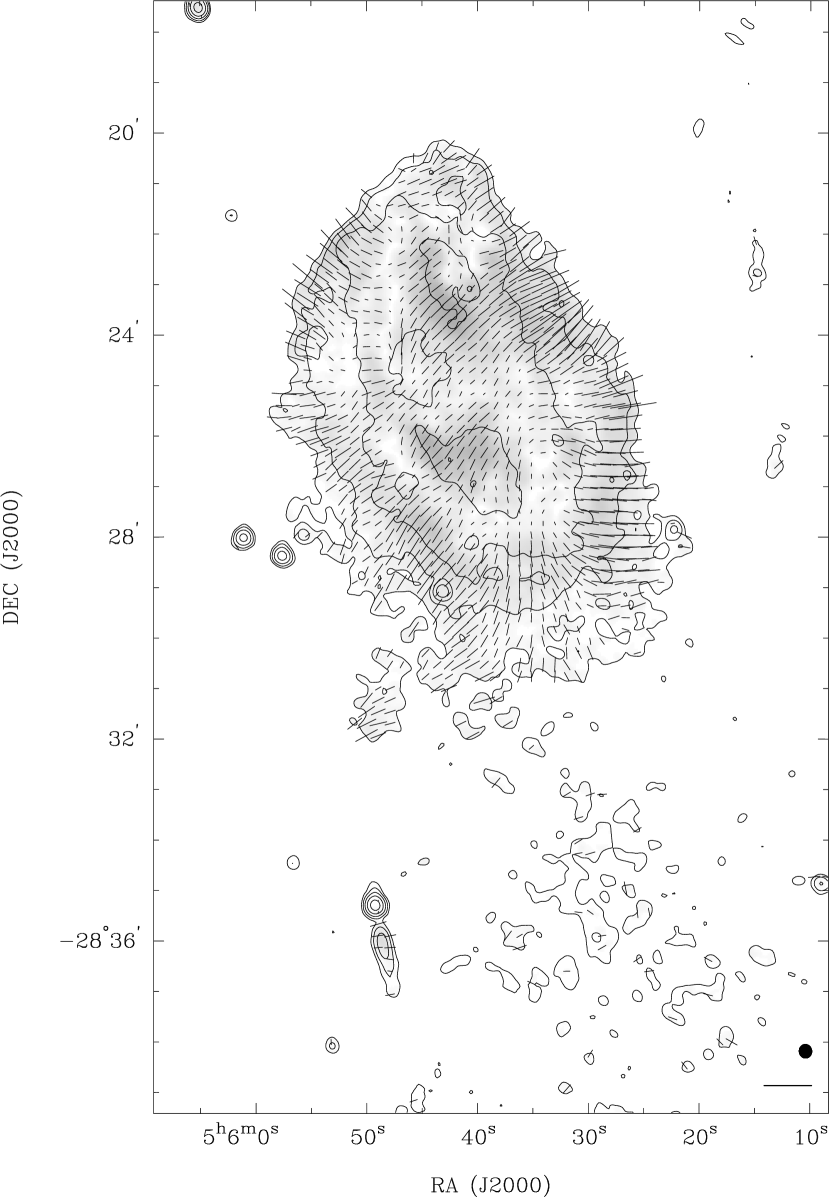
The calibrated 20-cm visibility data for the different pointings were mosaic-imaged in MIRIAD and the Stokes I, Q & U images were jointly deconvolved using the maximum entropy deconvolution algorithm implemented in PMOSMEM (Sault et al., 1999). The images have beam FWHM at a P.A. of 86 and rms noise of Jy beam-1. Images of the northern and southern lobes are shown separately for clarity; total intensity images are shown in Figs. 2 & 3, and the distribution in polarized intensity and E-field orientation are shown in Figs. 4 & 5. The total flux densities of the northern and southern lobes are, respectively, 1.55 and 1.41 Jy, at 1520 MHz. The rotation measure (RM) towards the lobes was estimated by imaging separately the polarization at 1415 and 1635 MHz; with a beam of FWHM , the RM was observed to be uniform over the entire source with a mean value of rad m-2 and an rms scatter of 11 rad m-2. The polarization vectors in Figs. 4 & 5 have been corrected for a uniform RM of rad m-2.
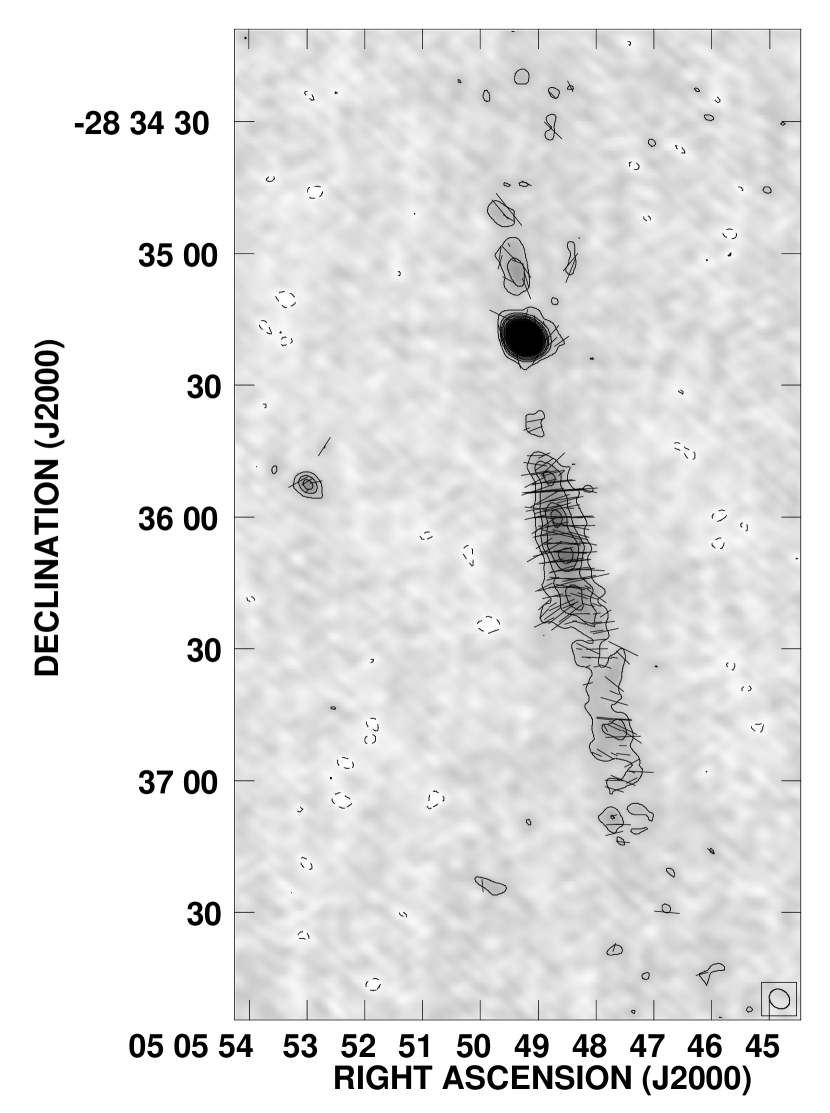
The 6-cm data were not self-calibrated; the visibilities at both frequencies were imaged together in AIPS. The radio image of the core region, made with a beam of FWHM at a P.A. of is in Fig. 6. The image has an rms noise of 25 Jy beam-1. The polarization vectors have been corrected assuming a uniform RM of rad m-2.
4. The large-scale galaxy distribution around MSH 0522
We extracted archival redshift measurements from the 6dF galaxy redshift survey (Jones et al., 2004) over a large sky area around MSH 0522. The 6dF survey was complete to apparent magnitude limit . Only galaxies with a redshift quality scale of 3 (for probable redshifts) and 4 (for reliable redshifts) were retained, others being spectra for which redshifts could not be determined, tentative redshifts or stars. Fig. 7 shows the 6dF galaxy distribution within of the host galaxy; the data are displayed in different redshift slices relative to the host galaxy redshift. We have adopted the gnomonic (tangent plane) projection for the representations and derive distances from redshifts neglecting peculiar velocities. As can be seen in panel (h), where all the 6dF survey galaxies in the sampled area are plotted together, the data available to date suffers from incompleteness and patchy coverage; nevertheless, patterns are clearly discernible in moving across the panels containing redshift slice data and the coverage is relatively complete close to the location of the host galaxy.
In Fig. 7 the six panels from (a) to (f) show the galaxy distribution in successive redshift slices 21 Mpc deep along the line of sight; panels (a) to (c) show slices in front of the host galaxy whereas panels (d) to (f) show slices beyond the host galaxy. The panels are wide corresponding to a linear size of 216 Mpc. The most prominent structure is a long filament-like feature exceeding 100 Mpc that is oriented in the NW-SE direction and crosses the sky just NE of the host galaxy. This feature is observed in panels (b) and (c) and does not appear in the other redshift slices; we infer the structure to be a sheet of galaxies at least 160 Mpc long that is oriented almost edge-on and extending nearly 40 Mpc from the host galaxy towards us. The projected width of the galaxy sheet is about 10 Mpc. In panel (g) we display all galaxies up to 42 Mpc in front of the host galaxy; this combines panels (b) and (c) and shows most clearly the NW-SE filament in the galaxy distribution close to MSH 0522. Panel (g) also shows a sharp fall in the surface density of the galaxies at the centre on the SW side of the host. The galaxies in the sheet appear to be closer to the sky position of the host galaxy in panel (c) as compared to (b); the host is, therefore, inferred to be located on the farther and lower (SW) end of the galaxy sheet. Towards the northern end of the sheet, the distribution may be affected by incompleteness in the 6dF survey. In panels (d) and (e)—which display galaxies to distances of 21 and 42 Mpc beyond the host—there is a concentration of galaxies seen in the range 3– (8–13.5 Mpc) to the north of the host galaxy.
Using tools that enable visualization of the galaxy distribution in 3D reveals additional richness: the sheet is in reality an edge-on complex network of curving filaments with a branch that runs close to and beyond the host galaxy connecting the condensation—that is seen in panel (d) to the north of the host—to the filaments composing the sheet seen in panels (b) and (c). All of this structure is located to the N and NE of the host, extending in redshift space on either side of the host, leaving the space to the SW of the host relatively devoid of galaxies.
The catalog of superclusters presented by Kalinkov & Kuneva (1995) records an entry for a supercluster with an over-density of 20–40 at the location of the sheet/filament. The host elliptical galaxy is also noted as being in a cluster in the ESO/UPPSALA survey (Lauberts, 1982). The linear feature in the galaxy distribution is also discernible in the panels in Fig. 4 of Jones et al. (2004), which depict the 6dF galaxy redshift survey.
4.1. The 2dF spectroscopy
With the aim of examining the detailed structure of the galaxy distribution in the immediate vicinity of the host galaxy, we used the 2dF facility at the 3.9-m Anglo Australian Telescope (AAT) to make a redshift survey of galaxies within of the radio source. Up to 400 simultaneous spectra may be obtained towards sky positions within the -diameter field of the 2dF. We observed two lists of target galaxies, as separate allocations, using low resolution 300B gratings in the spectrographs; each target list was observed in three 20-min exposures. The 2dF service observations were made on 2004 December 19 in occasional thin cloud and with a bright moon; the seeing was 1–.
The master object list for the spectroscopy was created using a SuperCOSMOS selection of galaxies in a diameter field centred at R.A. 05h 03m , decl. 28 45 00 (B1950.0). This position is located to the south of the radio core and roughly equidistant from the two lobes. The extracted list contained all objects deemed to be galaxies, to a magnitude limit of . Nine SuperCOSMOS digitized sky survey images that were wide—one centered at the field center with 8 flanking fields—were examined by eye to verify the robustness of the recognition of galaxies in the SuperCOSMOS extraction. Most of the brighter galaxies appeared to have been selected correctly; those missed were at faint magnitudes with . 25 galaxies, including the host, that had redshifts measured in the 6dF survey were omitted from the 2dF observations.
The galaxy lists for the two 2dF fibre allocations were constructed using the CONFIGURE routine. For this, the guide stars were assigned the highest priority of 9 and the galaxies had priorities assigned on the basis of their magnitude: priority 8 for , priority 7 for and priority 6 for . The first list contained all galaxies with . To minimize cross-talk between the fibres, bright galaxies () were separated from fainter galaxies by forcing their allocations to separate spectrographs. The second list contained the 91 galaxies from the master list with , that remained unallocated in the first run of CONFIGURE, together with fainter galaxies with . Seven galaxies among the unallocated objects had ; these were once again forced to the first spectrograph. The remaining galaxies in the unallocated list were assigned to the second spectrograph and galaxies with were allowed to be assigned by CONFIGURE to either of the two spectrographs. The data reduction was carried out using the 2DFDR software package; 1-dimensional spectra were derived after calibration. Excluding calibrations, there were in all 592 object spectra. The 6dF tool RUNZ was used to estimate redshifts; those with poor quality results were examined manually and redshifts were re-assigned in many cases. Only redshifts of good quality were retained.
Including the 6dF galaxies, we have 359 galaxies with acceptable redshift measurements in the diameter field around the radio source giving a pencil-beam view of the galaxy distribution close to MSH 0522. A histogram of the redshift distribution of galaxies within this pencil beam is shown in Fig. 8 over the range –0.05, where it is seen that the host galaxy, at , lies well within a tight clustering of galaxies in redshift space. The sky distribution of the 359 galaxies is shown in Fig. 9; large symbols mark galaxies that lie within of the host galaxy redshift and small symbols show the remainder.
At the redshift of the host, the field has a diameter of 5.4 Mpc and is centered kpc south of the host galaxy. The galaxies in Fig. 9 that fall in the narrow redshift slice containing the host galaxy are almost exclusively in the NE half of the diameter circle. Among these galaxies, which are represented using large symbols in Fig. 9, the concentration seen just NNE of the northern lobe is at somewhat higher redshift relative to the host galaxy, whereas those galaxies represented by large symbols and which have somewhat lower redshifts relative to the host have a wider distribution over the semi-circle. The redshifts of the galaxy group at the location of the host have a distribution that spans the host redshift, indicating that the host is likely to be a member of this small group which is located at the fringe of a large-scale galaxy overdensity. The galaxy distribution in the 2dF pencil beam is consistent with the 6dF wide-field galaxy distribution and nicely provides a zoomed-in view of the immediate environment of MSH 0522.
5. Giant radio galaxy MSH 0522 revisited
Although the radio lobes in MSH 0522 have an edge-brightened FR-ii type structure, no compact hotspot-like features are observed associated with the lobes. In this context, it may be noted that the unresolved source observed within the northern lobe (see Fig. 2) has no intermediate structure suggesting any relationship to the radio lobe; it is probably an unrelated background source.
The total intensity distribution in both the lobes shows a wealth of structure. In the northern lobe a dip in intensity is observed close to the center and the brightness in the surrounding shell-like structure is higher by up to a factor four. In the southern lobe, the total intensity distribution is center brightened with surface-brightness fluctuations in a smaller range.
The radio images show that the two lobes, which are enveloped in a continuous bridge of low surface brightness emission, have the following overall asymmetries: (a) the two lobes extend to very different distances from the core: the total extents of the source to the north and south of the core are in the ratio 1:1.6; (b) the backflow from the southern lobe extends three-quarters of the way towards the radio core, whereas the backflow from the northern lobe not only appears directed about to the west of the core but also extends beyond the core; and (c) the twin jets from the core are asymmetric: the brighter jet is to the south and directed towards the peak at the end of the southern lobe.
The centroid of MSH 0522 is located west and south of the core, amounting to a projected offset of about or 160 kpc to the SW.
From Figures 4 and 5 the two lobes of the giant radio galaxy are seen to be highly polarized. The fractional polarization is about 25–30% in patches in the interior of the two lobes. Surrounding these patches the fractional polarization dips to below 10% in ring-like structures and the fraction rises to above 50% in the rims of both lobes where the typical circumferential projected magnetic field structure is seen.
The host galaxy has been cataloged as a ROSAT X-ray source, 1WGA J0505.82835, and we estimate its X-ray luminosity to be J s-1 in the 0.2–2 keV band. The -band absolute optical magnitude of the host galaxy is estimated to be which is typical of host galaxy magnitudes of powerful radio galaxies. The total radio power at 1.4 GHz is W Hz-1 which—considering the optical magnitude of the host galaxy—places the source on the dividing line between FR i and FR ii type radio sources. The total power is relatively low compared to double radio sources with edge-brightened structure.
Twin jets have been detected from the core. The jet, counterjet and core as well as the southern lobe are collinear. However, the northern jet does not appear to be directed towards the northern lobe.
The radio core, which is coincident with the host galaxy, has a flux density of mJy at 4860 MHz and mJy at 1520 MHz. Using images with a beam FWHM of , the spectral index between 1520 and 4860 MHz is for the core component, in the southern jet and in the northern counterjet (the spectral index is defined using the relation ). The jet (Fig. 6) is detected to the south to a projected distance of 90 kpc and along this distance the B-field appears directed along the jet axis. The jet is also knotty in appearance and has a constant opening angle of about and the jet surface brightness diminishes along its length. The 1.4-GHz core power is W Hz-1 and is only 0.36% of the total power. In comparison with extended radio sources (Giovannini et al., 1988), the core power in MSH 0522 is a factor of four smaller than that typical for sources with the same total power; however, this deficit is small and within the observed dispersion in the relationship. A low core fraction is consistent with the edge-brightened structure, and an FR ii classification, but we note that the value of the core fraction estimated for MSH 0522 is 2–3 times below the median core fraction observed in powerful giant radio galaxies in Schoenmakers et al. (2000) and Saripalli et al. (2005).
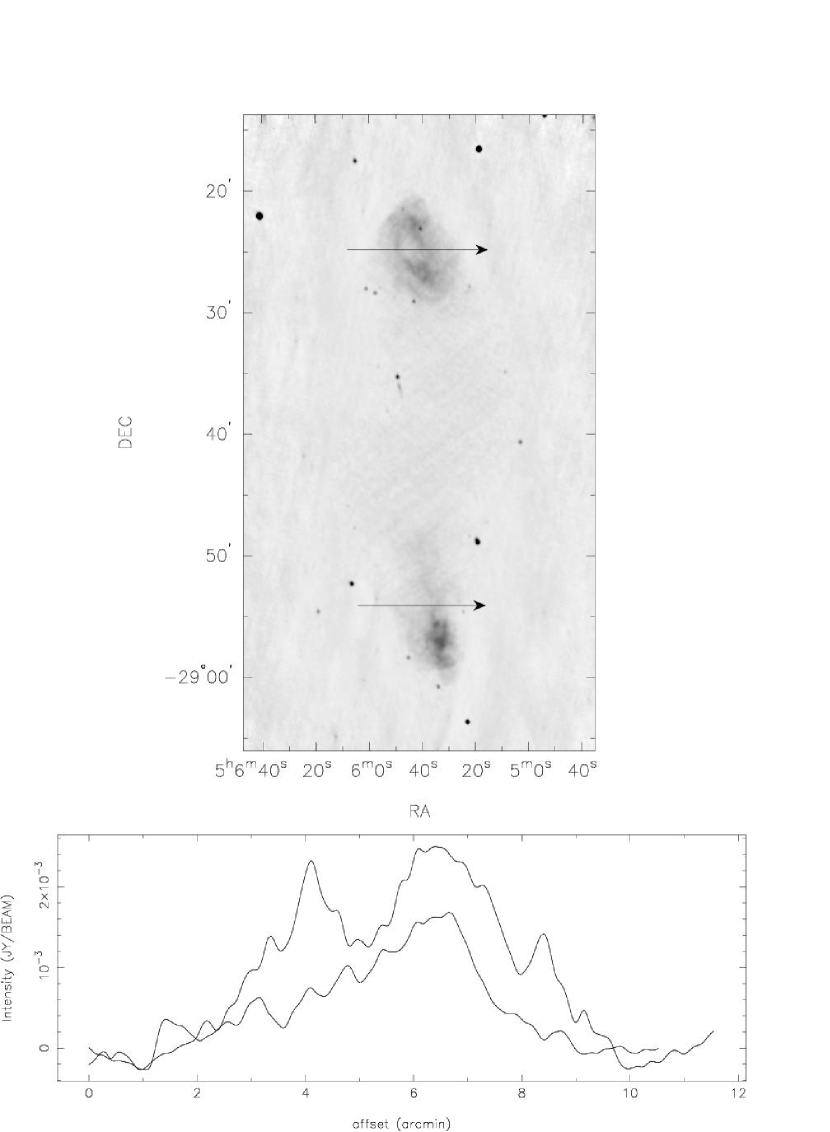
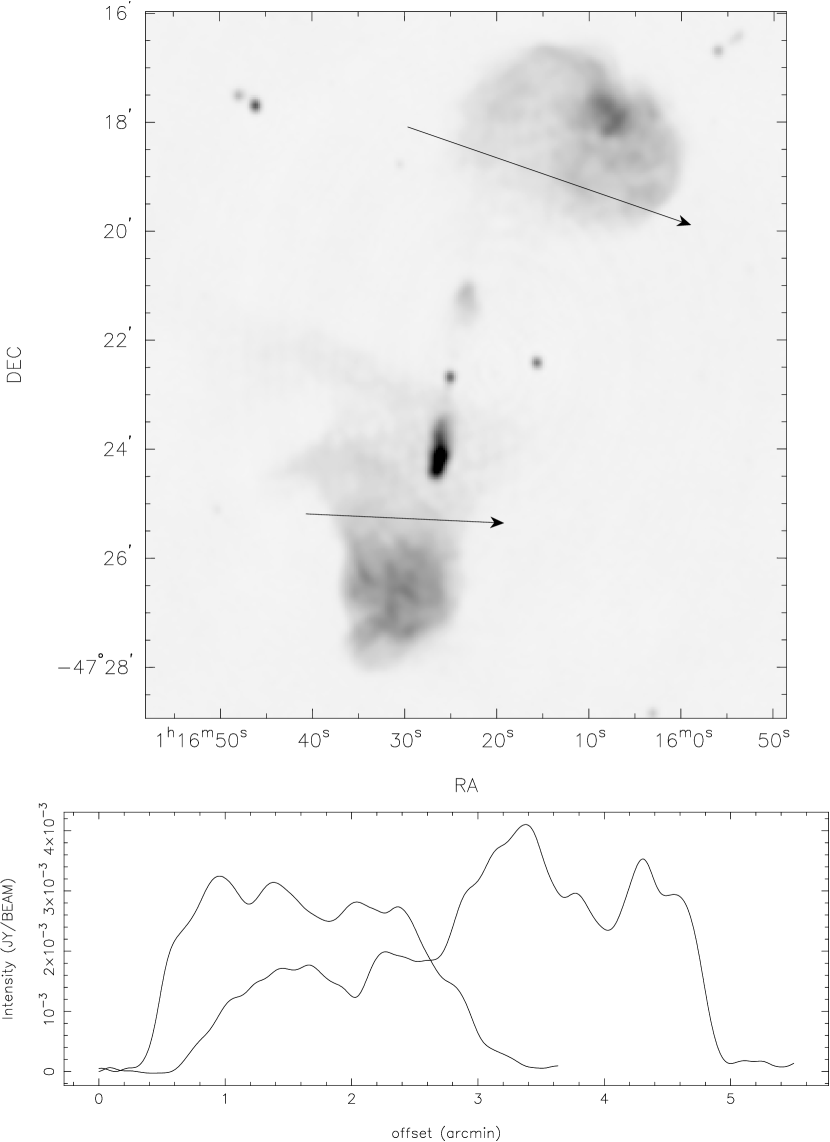
We show, in Fig. 10, slice profiles made across the two lobes of MSH 0522. The slices have been made avoiding the peaks in total intensity. As a comparison, we show in Fig. 11 similar slice profiles made across PKS J01164722 (Saripalli et al., 2002), where we have similarly avoided the peaks in the brightness distribution over the lobes. Radio galaxy lobes that are actively supplied with energetic electrons via termination shocks in hotspots at the ends of jets are expected to be overpressured with respect to the ambient medium and the lobe expansion is limited by the ram pressure against the dense thermal environment. Consistent with this picture, most extended powerful radio galaxies that we know of are observed to have well bounded lobes. Even in the case of powerful radio sources in which the jets have been interrupted for a brief period—as is the case in PKS J01164722—we observe that the lobes are docked, as seen in Fig. 11. In contrast, the slice profiles across the lobes of MSH 0522 appear relaxed and the surface brightness diminishes gradually towards the edges; as far as we know this is the first such example in which the lobes of an edge-brightened radio galaxy are not sharply bounded. It may be noted here that this aspect of the source brightness distribution caused special difficulties during the image deconvolution, since the source extent—and, therefore, the ‘clean region’ constraint—could not be easily specified a priori. The filamentary structure in the lobes of MSH 0522, as seen in Fig. 2 and in the grey scale image in Fig. 10, and the significant intensity variations seen in the slice profile in Fig. 10, are also indications of significant entrainment that might be expected when relict lobes relax.
5.1. The spectrum of radio lobe emission
In Table 1 we present a compilation of flux density measurements of MSH 0522. The 34.5 MHz measurement from the GEETEE telescope survey represents the integrated flux density and was derived from the survey images by first subtracting the Galactic foreground and then accounting for the fact that the source is resolved by the beam. The value at 408 MHz was similarly derived from the 408-MHz survey image; in this case the quoted error is dominated by the uncertainty in the subtraction of the Galaxy. The Parkes-MIT-NRAO (PMN) multi-beam survey images were used to estimate the flux densities at 4850 MHz. The radio spectrum of the source is a remarkably straight power law with index between 85.5 and 10700 MHz. Between 34.5 and 85.5 MHz the spectrum appears flatter with at these long wavelengths.
In Fig. 12, we show the distribution in spectral index over the two lobes; the 1520-MHz image was smoothed to the resolution of the 843-MHz image to make this comparison. Since the 1520-MHz image was constructed from full-synthesis data in the VLA CnB array that well images structures up to in angular size, the smoothing to the MOST image resolution of about is expected to yield reasonably accurate images for the comparison. Over a large region of the northern lobe (including the two peaks) the spectral index is steep and fairly uniform with . Towards the dip in total intensity close to the center of the northern lobe the spectral index is distinctly steeper with . All along the leading rim of the northern lobe the spectral index is significantly steeper, with . In the southern lobe, the spectral index distribution is complex: towards the peak in the lobe and there is indication for relatively flatter spectral indices of towards the end of the southern lobe. Additionally, along the eastern and western edges of the southern lobe we observe patches with steep spectra of . Within the errors in the continuum imaging, we infer an unusual spectral index distribution asymmetry in this giant radio source. Profiles of the spectral index along the source axis show opposite behavior in the two lobes, with indices that gradually steepen to the north from the end of the southern lobe and gradually flatten to the south from the end of the northern lobe. While the observed trend in the southern lobe is typical, the northern lobe is extraordinary in that the spectral index flattens towards the core contrary to that observed in edge-brightened double radio sources. The spectral index is fairly constant over a central region of both lobes.
5.2. Synchrotron pressures in the radio lobes
We first adopt here the minimum energy formalism (Miley, 1980). We assume that the lobes of MSH 0522 have cylindrical symmetry and that the source axis makes an angle of to the line of sight. The lobe plasma is assumed to be composed of electrons and positrons so that the ratio of the energy density due to all particles to that due to relativistic electrons is unity; evidence in favor of this assumption is given in Wardle et al. (1998). The lobe volume filling factor is assumed to be unity. Particle momenta are assumed to be randomly distributed in the lobes. We have made several slice profiles across both lobes, fitted Gaussians, and computed the peak surface brightness and lobe widths for the low surface brightness diffuse lobe emission. As discussed above, the slice profiles across the diffuse lobes do not exhibit sharp edges: the projected widths of the lobes are approximately twice the FWHM of the fitted Gaussians. In the formalism being considered here it is commonly assumed that the lower and upper cutoff frequencies for the emissivity are 0.01 and 100 GHz, respectively, in the rest frame and that the spectrum is described by a single power-law in between. In MSH 0522 the integrated spectral indices are observed to be below 0.1 GHz and at higher frequencies. In order to compute a lower limit to the pressure in the lobes within the minimum energy formalism, we assume a lower cutoff frequency of 0.1 GHz and power-law emission spectrum with above; the resulting magnetic field nT. The corresponding lobe energy density is J m-3. Assuming that the magnetic field lines are tangled, we estimate that the pressure in the diffuse parts of the lobes is N m-2. It may be noted here that the radio polarization data (Figs. 4 & 5) suggests that the fields are highly organized, particularly at the boundaries of the lobes: as a result the effective magnetic pressure normal to the lobe boundary might approach the magnetic energy density and the effective lobe pressure might exceed the above estimate by a factor of about 1.5. Since we have excluded the electrons that radiate in the 0.01–0.1 GHz range from consideration, our derived minimum pressures are an underestimate; however, we have estimated that the true pressure corresponding to the standard minimum energy assumptions, including electrons radiating down to 0.01 GHz, would exceed our derived value by less than a factor of 2. Additionally, deviations in the true values of and from those assumed above would increase the derived pressure; therefore, the value of pressure derived here is a true minimum.
We may instead adopt the equipartition formalism that assumes equal energy in particles and magnetic field; this formalism is perhaps appropriate for the diffuse regions of a relict lobe where relativistic particles and magnetic fields might be sufficiently coupled for energy exchange to result in equilibrium. The scaling relations in Leahy (1991) lead to estimates for that are a small factor 1.09 greater than the given above; the equipartition energy densities and pressures would exceed the values derived above by a factor of 1.2. This equipartition pressure, N m-2, is used in the following sections as a lower limit to the pressures in the lobes.
For the magnetic field derived above, lower frequency cutoffs of 0.01 and 0.1 GHz correspond to the exclusion of electrons with Lorentz factor less than and respectively. The electron population in the diffuse lobes might very well extend down to lower and Brunetti, Setti & Comastri (1997) give expressions for equipartition magnetic fields as a function of a minimum cutoff, . The low frequency emission spectrum has a spectral index . If the low energy electron spectrum, which we estimate to have an energy index (where ), were to extend down to of order unity, the lobe pressures would be greater than the above minimum energy estimates by factor approximately 3.
Beck & Krause (2005) have derived revised expressions for the equipartition energies and magnetic fields in synchrotron plasma assuming that the relativistic particles are generated by an electromagnetic acceleration mechanism that produces a power-law particle momemtum spectrum from a reservoir of low energy particles. Adopting our assumption that all of the energy is in the light radiating particles, the formulae yield an estimate of about 0.17 nT for the field and the corresponding equipartition pressure is N m-2.
5.3. A scenario for the radio source evolution
Injection spectra in powerful radio sources are believed to have to corresponding to the spectral indices of active hotspots. The spectrum of MSH 0522 suggests a break around 0.1 GHz, with of below and steepening to above. In a relict radio lobe, significant steepening with of at least unity may be expected owing to synchrotron aging after reacceleration ceases. However, there is no evidence for any additional break or further steepening up to a frequency of 10 GHz.
Spectral aging in the relict lobes of MSH 0522 would be expected to result in breaks in the emission spectrum, which evolve with time towards lower frequencies; the break frequency is given by
where nT is the magnetic field strength in the lobes, nT is the magnetic field strength equivalent to the cosmic microwave background energy density, at the redshift of the source, and (in Myr) is the age of the synchrotron lobes corresponding to the break frequency . The total spectrum of the source has a break at about 0.1 GHz, where the spectral index steepens by about 0.45, and any further steepening occurs beyond 10 GHz. We infer that the source spectral age is 0.3 Gyr and that the evolution in the relict phase has been for less than 0.03 Gyr or 10% of the source lifetime. It may be noted here that spectral ages estimated for radio galaxies are believed to be lower limits (Scheuer, 1995; Blundell & Rawlings, 2000).
The phenomenology presented above suggests the following picture. MSH 0522 is a relict that was once a powerful radio source. In the active phase, the jets encountered an anisotropic medium, with greater gas densities to the north and, consequently, the jets would have advanced with lower speeds to the north, resulting in a lobe length asymmetry. After the jets ceased feeding the lobes, the hot spots would have dissipated and the lobes would have expanded and relaxed to equilibrium with the ambient gas pressure. This has happened in a relatively short time as compared to the lifetime of the source, which is to be expected given the rarity of such relict radio sources. Significant entrainment of ambient thermal gas might be expected during this evolution.
This relict radio source is observed to have an unusually low fractional core power, and the twin jets close to the core appear to lack the collimation usually observed in edge-brightened radio sources. We are led to believe that the central AGN is being observed following a relatively rapid transition to a low-power phase in which the jets rapidly expand, drop in surface brightness, and dissipate in the vicinity of the core without a termination shock.
The observed offset of the northern lobe from the axis defined by the core, the two jets observed close to the core, and the southern lobe, suggests that the relict northern lobe has been displaced to the west or SW, presumably after the jets stopped feeding the lobes. The observed asymmetries are unlikely to be due to a motion of the host galaxy away from the centroid because (i) the source does not have a symmetry axis through the centroid, and (ii) the low value for the galaxy overdensity in the vicinity of the radio source indicates that the evolution of the large scale structure surrounding the radio source is at the stage of developing non-linearities, the gas is yet to be virialized, and we may expect that the gravitational motion of the galaxy and gas is the same.
The unusual steepening of the spectral index observed along the leading rim of the northern lobe—discussed in Section 5.1— may be related to this displacement. There are arguments suggesting that the lobe material is composed of a multi-phase medium consisting of particles with a range of , and that the high- particles might potentially be transported relative to a matrix defined by the lower- particles (Blundell & Rawlings, 2000). In this case, we might expect that displacement of a lobe owing to forces arising from, for example, buoyancy that acts from without and within (as a result of instabilities and mixing) would result in a segregation in the electron energies: particles with high- would suffer greater displacement relative to lower- material that has higher inertia. Such a segregation could result in variation in electron energy distribution along the force axis, which would result in a spectral flattening along the direction of the external force.
6. The physical state of the ambient medium of MSH 0522
As discussed above, we have reasons to believe that the lobes of the radio source MSH 0522 are relicts that have relaxed to equilibrium with the ambient IGM; therefore, we expect that the thermal gas pressure in the Mpc-scale environment of the radio source is at least equal to the equipartition pressure N m-2 estimated earlier.
6.1. Galaxy overdensity in the vicinity of MSH 0522
As discussed in Section 4, the host galaxy of the radio source MSH 0522 lies at the SW edge of a large-scale galaxy sheet that extends to lower redshifts. To infer the large-scale distribution in galaxy overdensity in the vicinity of the radio source, we have computed the 3D spatial distribution in the number density of the 6dF survey galaxies within a cube of side 60 Mpc centered at the host. Galaxies within in R.A. and declination, and within in redshift space, were included in this analysis. Using a spherical ‘top-hat’ smoothing function of radius Mpc, the rms fluctuation in galaxy number density was found to be 1.7 times the mean. The peak value of the fractional galaxy overdensity within the 60-Mpc cube was ; this peak was located in the galaxy sheet to the NE of the host galaxy and at a position offset 5.4 Mpc east, 10.8 Mpc north and Mpc along the line of sight, with respect to the host galaxy. At this smoothing scale, the fractional galaxy overdensity at the location of the host is . On varying the smoothing scale in the range 3.7–10 Mpc (in which the mean galaxy number density always exceeds unity), the peak value of the fractional galaxy overdensity in the sheet varied in the range 18–5, and the fractional overdensity at the location of the host galaxy, which is at the edge of the sheet, varied in the range 5.7–1.5.
Apart from this galaxy sheet that is located to the NE and in the foreground of the radio source, the 2dF data showed a relatively smaller galaxy concentration to the north of the radio source. We have merged the lists of 2dF (our observations presented in Section 4) and 6dF galaxies within of the host galaxy, and used this database to determine the local fractional density variations in the immediate environment of the host. Contour representations of this fractional overdensity distribution in redshift slices of are shown in Fig. 13; we have used a spherical ‘top hat’ smoothing function with Mpc.
The host galaxy is itself part of a small group of galaxies that are distributed within about (0.3 Mpc) on the sky; this group appears as a galaxy overdensity centered at the host in Fig. 13. Our redshift survey catalogs five members of this group: they have a mean velocity of km s-1 with respect to the host galaxy and the standard deviation in the velocities is km s-1. Using an Mpc smoothing radius, this small group that has a low velocity dispersion represents a factor 3.1 overdensity. Comparing the properties of this group with samples in the literature (Jones et al., 2003; Khosroshahi, Ponman & Jones, 2007), we infer that the low X-ray luminosity associated with the host, the optical luminosity, and the low velocity dispersion in the group classifies this group to be a low X-ray luminosity group and not a fossil group.
The nearest galaxy concentration outside this group is centered at a position with offsets 1.1 Mpc in RA, 1.35 Mpc in DEC, and 0.5 Mpc in redshift space; the corresponding linear separation from the position of the host galaxy is 1.8 Mpc () towards NE, at a P.A. of . The peak fractional overdensity has a value of for this system. In the same sky region, a second peak in overdensity is centered at a position with offsets 0.0 Mpc in RA, 0.8 Mpc in DEC, and 6.2 Mpc in redshift space (+450 km s-1). This overdensity has a peak . Both of these overdensities, which are located just north of the radio source, are connected and appear to be part of a filament running along the line of sight and extending in velocity space over the range to km s-1. This structure has a mean velocity of km s-1 with respect to the host galaxy and the standard deviation in the velocities is km s-1.
6.2. The IGM environment of MSH 0522
Primordial nucleosynthesis (Burles & Tytler, 1998) and CMB anisotropy (Spergel et al., 2006) suggest similar values for the baryon density in the Universe: and respectively. Estimates of the total baryon content at high redshifts (), most of which is expected to reside in Lyman- absorbers, are in agreement with these expectations; however, all of the detected baryons in the present day Universe—including gas in clusters and that estimated for groups—accounts for only about half of the baryons (Fukugita, Hogan & Peebles, 1998), leading to the problem of ‘missing baryons’. High-resolution cosmological hydrodynamic simulations (Cen & Ostriker, 1999; Davé et al., 2001) indicate that 40–50% of the baryon content of the Universe—which is roughly the missing fraction—resides as WHIM gas associated with unvirialized overdensities. The environment of MSH 0522, including the small group of which the host is a member as well as the galaxy concentrations to the North and NE and galaxy sheet to the NE are all galaxy overdensities with in the range 3–15, all in the regime of unvirialized overdensities, if the galaxies trace the total mass. Therefore, the IGM gas content of all of these structures observed in the vicinity of the radio source may be within the category of WHIM gas.
If we assume that of the baryon density of the Universe is in the IGM outside rich clusters, the mean IGM gas density is kg m-3, corresponding to a mean particle density m-3. If we also make the assumption that the galaxies trace the gas density, the thermal pressure in the ambient gas in the vicinity of MSH 0522 is given by:
where is the Boltzmann’s constant. Since we are considering the scenario where the lobes, with N m-2, are in equilibrium with the ambient gas, we have the result that:
It may be noted here that if the radio lobe is not in equipartition, or if the filling factor departs from unity, or if there is significant energy in heavy particles, the IGM gas environment of the radio source would be constrained to have a higher density-temperature product. As discussed in Section 5.2, low- electrons, if present, would additionally raise the value of this product. Dunn, Fabian & Taylor (2005) estimate in active and ‘ghost’ lobes: may exceed unity by 3 orders of magnitude indicating that the true density-temperature product in the gas surrounding MSH 0522 may be as much as a factor 50 higher than that indicated by the above constraint.
The low velocity dispersions in the group, of which the host galaxy is a member, and that in the galaxy concentrations and galaxy sheet in the vicinity of the radio source, as well as the low fractional overdensity in these large-scale structures suggest that they are unvirialized, but dynamically evolving in the non-linear regime. The gas in these structures is expected to be primarily heated by hydrodynamic shocks and the temperature would correspond to the scales currently going non-linear. Using the fits provided in Cen & Ostriker (1999), the gas temperature is expected to be keV, where (in Mpc units) is the spatial wavelength corresponding to the structure. The highest temperature shocks in the environment of the radio source would be those associated with the galaxy sheet, which has a scale length of about Mpc (corresponding to an angular size of ). This scale length roughly corresponds to the non-linear length scale for structure formation at (Valageas, Schaeffer & Silk, 2003), and it is plausible that the shock-heated IGM gas temperature associated with this sheet could be in the vicinity of 0.4 keV. The hydrodynamic simulations of this heating indicate a scaling relationship for the WHIM gas temperature with fractional overdensity (Davé et al., 2001; Cen & Ostriker, 2006): regions with overdensities below are not expected to be heated above about 0.4 keV. It may be noted here that ROSAT pointed observations of the Sculptor supercluster (Zappacosta et al., 2005) suggest IGM gas temperatures less than 0.5 keV within the supercluster filaments. However, this heating, which is due to shocks close to the centre of the filaments as matter from the ends of the perturbation cross, would affect gas in only a narrow part of the filament a few hundred kiloparsecs wide; the peripheral regions of filaments, where MSH 0522 is located, may not be heated by this mechanism at .
The lobes of the giant radio source are likely sampling the outer regions of the galaxy filament that are dynamically young. If the only source of heating has been the reionization of the IGM gas, then the ambient gas temperature might be as low as 1–10 eV, corresponding to a photoionized IGM that has been cooling with the expanding Universe.
Assuming hydrostatic equilibrium, the gas temperature associated with a galaxy clump with velocity dispersion is of order keV. The observed velocity dispersions indicate that any virialized gas in the potential wells of the group as well as the nearby galaxy concentrations to the NE and north would have temperatures well below 0.5 keV.
We are led to the conclusion that the gas in the vicinity of the radio source, which is observed to have an overdensity factor less than about 10 on the scale of the radio source (projected linear size of 1.8 Mpc) has a temperature less than 0.5 keV. This results in a density-temperature product (or pressure) that is an order of magnitude below that expected from the properties of the radio source.
7. Dynamics in the radio lobes of MSH 0522
The double lobe structure of MSH 0522 is asymmetric: the extents of the lobes on the two sides differ and the lobes are not collinear with the central core and jets. If the jet powers were the same on the two sides and if the interstellar medium of the host galaxy was not the cause for asymmetry in the jets emerging into the IGM, then the large-scale asymmetries in the radio galaxy may be related to gradients and anisotropies in the ambient IGM. The asymmetric structure is indicative of an evolution in which the jets advanced with different speeds on the two sides, resulting in different lobe extents, and after the jets stopped feeding the lobes there has been a movement of at least the northern lobe away from the source axis and towards SW. The observed extension past the core in the backflow associated with the northern lobe is consistent with such a picture.
We now discuss plausible mechanisms for the generation of the observed asymmetries.
7.1. Asymmetries in gas density
The observed ratio of the extents on the two sides suggests that the hotspot advance speeds on the two sides were in the ratio 1.6:1 or smaller. Since the hotspot advance is ram pressure limited by the ambient gas density, the density ratio on the two sides might be as much as 2.25:1 on a scale of 1–2 Mpc. As seen in Fig. 13, Panel (b), the fractional overdensity to the north of the source is significantly greater than that to the south. Smoothed to a scale Mpc, the galaxy density—and therefore perhaps also the gas density—at a distance 0.8 Mpc to the north is a factor 3–4 higher as compared to that to the south of the host galaxy. The gas density gradient indicated by the galaxy density gradient appears consistent with that required to constrain the growth of the radio source to the north in comparison to the south.
7.2. Buoyancy
We have used the 2dF and 6dF galaxy distribution data to infer the gravitational acceleration vector at the location of the radio source, due to the large scale distribution of matter.
The 6dF galaxies in a cube 60 Mpc a side— wide in R.A. and declination and in redshift space—were included in the first analysis. This amounted to galaxies. The total matter density in the cube was assumed to be the volume of the cube times the mean matter density in the Universe: , where the critical density kg m-3. Assuming that the galaxies trace this matter, every one of these 6dF galaxies was assigned a mass M⊙. Neglecting the matter outside the cube, the acceleration vector owing to the 1004 galaxies within the cube was computed; the components are: m s-2, m s-2 and m s-2 along increasing R.A., declination and redshift respectively. The magnitude of this acceleration vector is m s-2, and assuming the age of the Universe to be Gyr, we infer that the environment of the radio source might be experiencing an infall towards the sheet to the NE with a speed about km s-1. The acceleration vector also implies that the environment of the radio source might have a line-of-sight peculiar velocity of about 170 km s-1; if so, the true location of the host galaxy and the group it is associated with might be 17.1 Mpc—instead of 19.1 Mpc (see Section 6.1)—along the line of sight from the peak overdensity in the galaxy sheet, which is located in the foreground and to the NE of the radio source. On the sky plane, the acceleration is directed towards P.A. of , with a magnitude corresponding to km s-1.
The local acceleration vector was determined using the 2dF data. A total of 21 galaxies in a 5.4 Mpc wide cube— wide in R.A. and declination and in redshift space—were included in this analysis. Following the same assumptions and procedure described above, each galaxy was assigned a mass of M⊙. The resulting gravity vector was computed to be: m s-2, m s-2 and m s-2. On the sky plane, this corresponds to km s-1 towards P.A. of . In order to compute the acceleration experienced by the giant radio source, which has a 1.8-Mpc projected linear size, we have neglected galaxies within 1 Mpc of the host galaxy when computing these acceleration vectors. The corresponding redshift-space distortion amounts to a line-of-sight peculiar velocity of 15 km s-1, or errors of 0.2 Mpc in linear distance, which is small compared to the distances to nearby galaxy concentrations.
The gravity gradient vector direction computed above suggests that a possible mechanism for the movement of the northern radio lobe towards SW or south is buoyancy: in this model, the light synchrotron lobes would rise against the gravity vector direction as a result of being enveloped by thermal IGM gas that is significantly denser. This movement might effectively take place during the time since the jets ceased feeding the lobes. The model being considered here is similar to that in clusters of galaxies, where X-ray ‘holes’ in the intracluster gas are believed to be synchrotron plasma ‘bubbles’ rising buoyantly in the dense thermal gas associated with the cluster (Churazov et al., 2000). The terminal speed of the movement of the northern lobe, as a result of buoyancy, would be given by:
where is the acceleration due to gravity, is the volume of the northern lobe, is the cross section area, and is the drag coefficient, which we assume to be 0.75 (Churazov et al., 2001). For the northern lobe, kpc. Even using the relatively large acceleration, corresponding to km s-1, which was estimated for the large scale structure, the terminal velocity is km s-1. A displacement over a distance of 180 kpc, corresponding to half the width of the northern lobe, would require about 1 Gyr. The acceleration corresponding to the relatively nearby galaxy concentrations to the north were computed above to be a factor 15 smaller, and the terminal velocity due to this gravity vector would be a factor of 3.8 slower and the rise time correspondingly longer.
The Gyr timescale we have computed above for the buoyant displacement of the northern lobe from the source axis is somewhat longer than the spectral age of the source computed in Section 5.3, which may itself be an underestimate of the true dynamical age of the radio lobes. The conclusion is that buoyancy forces in the IGM are a plausible mechanism for the observed displacement provided that the displacement occurs over the total source lifetime; however, additional causes might also play a significant role.
8. Discussion
We derive a lower limit of N m-2 to the synchrotron pressure within the radio lobes; this suggests a density-temperature product of K m-3 for the ambient IGM. The galaxy group, nearby galaxy concentrations, and the large scale sheet at the edge of which the radio source is located, all have fractional density contrasts of order 10 or smaller. The radio source, which has a projected linear size of 1.8 Mpc, is presumably interacting with the IGM associated with a filamentary large-scale structure in the galaxy distribution: the derived density-temperature product for this structure is a measurement of the physical state of the IGM gas in the vicinity of the radio source. Assuming that galaxies trace the unseen IGM gas, the densities and temperatures we expect for the IGM environment—based on the local galaxy overdensity and assuming that the IGM gas is heated by hydrodynamic shocks associated with the formation of the observed large-scale structure—falls at least an order of magnitude short of the expectations based on the radio properties of the source.
There are several plausible explanations for this basic result that the IGM pressure is at least an order of magnitude below that in the radio lobes, we discuss some of them below.
8.1. Do the galaxies in the filaments trace the gas?
The distribution in the unseen collisionless dark matter dominates the gravitational potential of the large scale structure. Galaxies display luminosity segregation (Peder et al., 2002)—the distribution of luminous galaxies are biased—and, therefore, derivations of mass overdensity factors based on the space distribution of luminous galaxies would be overestimates. Consequently, the gravitational potential and gravitational accelerations would also be overestimates.
We have assumed that the galaxies trace the gas, and that the galaxy overdensity factors derived represent the IGM gas overdensity. Unlike dark matter and galaxies, gas is dissipative and it is possible that the gas distribution is significantly more biased compared to galaxies. However, this might only be expected in later stages of non-linear structure growth when the overdensity factors attain values exceeding about and radiative cooling becomes significant. In the mildly overdense stages when the overdensity factor is a few 10’s and the structures are yet to collapse, we might expect the gas and galaxies to have similar overdensity factors.
8.2. The ambient medium of the radio lobes: is it an intra-group medium?
The small group of which the host is a member has a relatively small velocity dispersion compared to that typically observed in groups of galaxies (see, for example, the compilation in Mulchaey et al. (2003)) and, therefore, it is expected that any virialized gas associated with the group would have a temperature at the lower end of the observed distribution: 0.4–1.5 keV. Groups with keV are detected to have a gas extent less than half the virial radius of the galaxies in the group, or out to a radial distance of less than 0.4 Mpc. It may be noted here that the lobes of MSH 0522 extend well beyond the obvious extent of the group, of which the host galaxy is a member.
Although it is unlikely that the gas associated with the small group—of which the host galaxy is the dominant member—extends over the entire radio source, this expectation needs to be confirmed with sensitive X-ray imaging of the environment of the radio source. Based on the observations to date, it is reasonable to assume that the radio lobes interact with the more diffuse IGM associated with the large-scale filament and not thermal intra-group gas.
8.3. Are the radio lobes in equilibrium with the IGM?
Active radio sources inflate cocoons that are likely overpressured and expanding with speeds limited by ram pressure balance. In this model, the synchrotron cocoons are enveloped in gas that has been shock heated and compressed by the mechanical action of the expanding radio lobe in the vicinity of the contact discontinuity. Once the central beams are switched off, the relict radio sources are believed to rapidly diminish in surface brightness—as evidenced by the paucity of relicts—as the cocoons and enveloping thermal gas pressure equilibrates with the IGM.
An assumption made here is that the radio lobes of MSH 0522 are relicts and, therefore, in pressure equilibrium with the ambient thermal gas outside the contact discontinuity. In the light of the finding that the pressure in the external IGM might be an order of magnitude underpressured, a possible explanation is that the lobes of MSH 0522 are not relaxed—despite the distinctive aspects of the radio properties that suggest a relaxed relict state for the lobes—but are being observed in a rare transition phase as a fading relict continuing ram-pressure balanced expansion. An observational support for this picture is the enhanced and circumferential magnetic field along the boundaries of the cocoons, which are indicative of radial compression for the synchrotron plasma.
In this interpretation, the lobes of MSH 0522, with internal pressure exceeding N m-2, are over pressured compared to the external thermal gas, with density less than kg m-3 and pressure about N m-2. Ram pressure expansion with speed over a timescale 0.3 Gyr, which is similar to the lifetime of the source, would expand the lobes by factor two and result in a relaxed relict in static pressure equilibrium with the IGM associated with the large-scale filament in which the source is embedded. The surface brightness of the relaxed relict at 1.4 GHz would be less than 0.25 mJy arcmin2, much less than the current surface brightness of about 30 mJy arcmin2 and well below surface brightness detection limits of wide-field surveys. This scenario for the evolution in MSH 0522 would be consistent with the rarity of relaxed relict radio galaxies—the ‘dead’ radio galaxies (Giovannini et al. (1988); see also the discussion in Blundell & Rawlings (2000)).
8.4. Additional sources of heating of the IGM environment
We discuss here the possibility that there is likely a different cause for the heating of the IGM gas in the vicinity of the radio source, which dominates over hydrodynamic shock heating or mechanical heating of the ambient gas by the radio source itself and might permit the radio lobes to be in pressure equilibrium with the IGM.
The galaxy distribution in the vicinity of the radio source (Section 6.1) shows a concentration of galaxies centered 1.8 Mpc NE of the host galaxy that is significantly closer to the northern lobe than the southern lobe. The observational evidence for an association between the asymmetries in the radio source and the large scale distribution of galaxies indicates that a model worth considering is one in which shocks associated with galactic super winds (GSWs) or mechanical heating associated with any AGNs in this galaxy concentration might enhance the density-temperature product in the IGM environment of the radio source and, additionally, also contribute to the dynamical evolution of MSH 0522 and the displacement of the northern lobe off axis and in the SW direction.
Hydrodynamic simulations of the evolution in large-scale structure, incorporating such GSWs (Cen & Ostriker, 2006) have indicated the power of such winds in translating gas from higher density regions into lower density peripheral regions of filaments as well as driving shocks into regions with low fractional overdensities that would otherwise not have experienced shock heating during non-linear structure formation. Apart from heating the ambient gas around the radio lobes of MSH 0522, the GSWs might also transport gas from the galaxies in the concentrations and into the environment of the radio source. In this picture, the energy arising from GSW or AGN related activity in the galaxies to the NE and propagating in the low density WHIM might aid the movement of the northern radio lobe towards the SW, as discussed in Section 7.
The estimated age of the relict source, Gyr, implies a fairly large displacement speed of order 600 km s-1. Rupke, Veilleux & Sanders (2005) measure a median ‘maximum’ velocity for the winds in their sample of starburst galaxies to be 350 km s-1; however, one galaxy in their sample was measured to have a wind speed of 1100 km s-1. Heckman (2002) suggests that primary wind fluid velocities might be a few thousand km s-1. Additionally, the superwinds in the environment of MSH 0522 might be a combined wind from several of the galaxies in the nearby concentration to the NE. GSW speeds are, therefore, in the vicinity of the displacement speed inferred for the lobe. It may also be noted that in simulations, GSWs tend to move towards the low density regions (Kawata & Rauch (2007) and references therein). Since MSH 0522 is located between the galaxy concentration to the NE and a void to the SW, winds from the observed galaxy concentration would be expected to displace the northern lobe in the required direction. Therefore, it is plausible that such astrophysical feedback mechanisms, which may be responsible for the high pressure in the ambient IGM, may also contribute to the radio source dynamics and result in the observed displacement of the northern lobe over the source lifetime.
We have looked for evidence of current AGN activity in the galaxies located in the nearby concentration to the NE of MSH 0522, which are within of the host redshift. A galaxy is coincident with a ROSAT X-ray source 1WGA J0506.82810, another may be identified with a radio source in the NRAO VLA sky survey (NVSS) as well as a ROSAT object 1WGA J0506.62814. About 10% of the galaxies appear to be AGNs, which may be responsible for the feedback mechanisms being considered here.
We have examined an archival ROSAT PSPC image of the sky region in the vicinity of the radio source for evidence for extended emission on the scale of the radio source. This was a 22 ks pointed observation. First, smoothing the ROSAT image does not indicate any evidence for extended X-ray emission associated with the group of which the host galaxy is a member. Second, if the double radio lobes were enveloped by relaxed hot thermal gas on a scale similar to the size of the radio lobes, and with a pressure as indicated by the radio lobes, the expected counts in the 0.2–2.0 keV ROSAT band would be below the sensitivity to such structure. Existing data do not rule out the GSW or AGN feedback models considered in this section.
Adopting an electron density of m-3 and a temperature of 0.5 keV (see Section 6.2), and the expression for temperature relaxation timescale in RA: 05h 03m , DEC: 28 45 00 Yoshida, Furlanetto & Hernquist (2005), we infer that the electron-ion equilibration timescale in the ambient IGM gas is about 0.014 Gyr. A higher ambient density would reduce the equilibration time; however, a higher ambient temperature resulting from heating via shocks associated with GSWs or AGNs could potentially increase the equilibration timescale significantly. It is, therefore, possible—although unlikely—that in the case of a shock heated IGM the equilibration timescale exceeds the age associated with the relict phase, as well as the age of the radio source. As a consequence, we cannot rule out a model where the ambient IGM beyond the contact discontinuity of the radio synchrotron plasma is composed of hot ions and relatively cooler electrons, and hence difficult to detect in its continuum radiation.
9. Summary
We have made radio continuum images in total intensity and polarization of the double radio source MSH 0522 with a beam of about FWHM. Additionally, the extended low surface brightness emission has been imaged at 843 MHz and the radio core and associated jets at 4.8 GHz. The radio structure is highly asymmetric and there is evidence—in the morphology and other radio properties—that the lobes are relicts of a powerful radio galaxy. We have examined the large-scale structure in the galaxy distribution around the radio source using 6dF survey data and our 2dF observations, with the aim of examining (1) whether gas associated with this structure might plausibly have the pressure indicated by the radio properties, and (2) whether the asymmetries in the radio source might be a consequence of the interaction between jets and lobes with gas associated with the galaxy distribution. The radio source is at the SW periphery of a 100-Mpc scale galaxy sheet and we identify galaxy concentrations to the NE and North at distances 2–6 Mpc from the host galaxy. The host galaxy is itself a member of a small group.
A relationship has been observed between the asymmetries in the radio morphology of MSH 0522 and the large scale structure in galaxies. The observed asymmetries in the radio structure may be caused, in part, by the gas density gradient in the vicinity of the radio source, as inferred from the large scale galaxy density gradient. Additionally, buoyancy forces arising from the local gravity gradient due to the large scale matter distribution, and any winds from galaxy concentrations observed in the vicinity of the radio source, may together cause the displacement we infer for the northern lobe from the radio axis.
However, we find that the minimum pressure within the radio lobes is at least an order of magnitude greater than the pressure expected for the gaseous environment of the radio source. This is surprising in the light of the relationship between the asymmetries in the radio source and that in the ambient large-scale structure, and the evidence that MSH 0522 is a relict. We have discussed the possibility that the relict radio lobes are not in pressure balance with the IGM associated with the filamentary large-scale structure in galaxies. This explanation suggests that extended radio sources located in low-galaxy-density environments may not be relaxed relicts even if they have the properties of MSH 0522 that indicate a relict state. Relaxed relicts embedded in the large scale galaxy filaments may have surface brightness—corresponding to the thermal pressures in the IGM gas—that are below surface brightness limits of current surveys. Surveys, like the Australia Telescope low-brightness survey (ATLBS; Subrahmanyan et al. (2008)), might detect the relaxed relict source population.
As a way of reconciling the relationship between the asymmetries in the radio source, the evidence indicating that the lobes of MSH 0522 are relict, and the mismatch between the internal pressure estimated for the synchrotron lobes and the thermal pressure expected for the ambient IGM, we speculate that the heating of the peripheral regions of the IGM associated with the galaxy filament surrounding the radio source might be dominated by astrophysical feedback from nearby galaxy concentrations, which heat gas located more than 2 Mpc away from galaxy concentrations. In this interpretation, MSH 0522 is a relaxed relict, and the observations presented herein constitute independent evidence indicating that feedback processes from galaxies might dominate the state of the gas associated with large-scale structure in the Universe. It may be noted here that such extensive heating of the IGM via GSWs might also be the cause for the detection of extended Sunyaev-Zeldovich signals from clusters and groups (Myers et al., 2004).
The conclusions we derive here are not without uncertainties. Nevertheless, this work represents a first step towards using giant radio galaxies as a means of probing the IGM outside groups and cluster environments via a detailed comparison of radio source properties with the 3D large-scale galaxy distribution.
References
- Baars et al. (1977) Baars et al. 1977, A&A, 61, 99
- Beck & Krause (2005) Beck, R., & Krause, M. 2005, Astron. Nachr., 326, 414
- Bliton et al. (1998) Bliton, M., Rizza, E., Burns, J. O., Owen, F. N., & Ledlow, M. J. 1998, MNRAS, 301, 609
- Blundell & Rawlings (2000) Blundell, K. M., & Rawlings, S. 2000, AJ, 119, 1111
- Brunetti, Setti & Comastri (1997) Brunetti, G., Setti, G., & Comastri, A. 1997, A&A, 325, 898
- Burles & Tytler (1998) Burles, S., & Tytler, D. 1998, ApJ, 499, 699
- Cen & Ostriker (1999) Cen, R., & Ostriker, J. P. 1999, ApJ, 519, L109
- Cen & Ostriker (2006) Cen, R., & Ostriker, J. P. 2006, ApJ, 650, 560
- Churazov et al. (2000) Churazov, E., Forman, W., Jones, C., & Bohringer, H. 2000, A&A, 356
- Churazov et al. (2001) Churazov, E., Bruggen, M., Kaiser, C. R., Bohringer, H., & Forman, W. 2001, ApJ, 554, 261
- Davé et al. (2001) Davé, R., et al. 2001, ApJ, 552, 473
- Dunn, Fabian & Taylor (2005) Dunn, R. J. H, Fabian, A. C., & Taylor, G. B. 2005, MNRAS, 364, 1343, 788
- Dwarakanath & Udayashankar (1990) Dwarakanath, K. S., & Udayashankar, N. 1990, J Astrop. Astron., 11, 323
- Fanaroff & Riley (1974) Fanaroff, B. L., & Riley, J. M. 1974, MNRAS, 164, 31
- Forman, Jones & Tucker (1985) Forman, W., Jones, C., & Tucker, W. 1985, ApJ, 293, 102
- Fukugita, Hogan & Peebles (1998) Fukugita, M., Hogan, C. J., & Peebles, P. J. E. 1998, ApJ, 503, 518
- Giovannini et al. (1988) Giovannini, G., Feretti, L., Gregorini, L., & Parma, P. 1988, A&A, 199, 73
- Haslam et al. (1982) Haslam, C. G. T., Salter, C. J., Stoffel, H., & Wilson, W. E. 1982, A&AS, 47, 1
- Heckman (2002) Heckman, T. 2002, in Extragalactic gas at Low Redshift, eds. J. S. Mulchaey & J. Stocke, ASP Conf. Ser. 254, p.292
- Jamrozy et al. (2005) Jamrozy, M., Kerp, J., Klein, U., Mack, K.-H., & Saripalli, L. 2005, Baltic Astronomy, 14, 399
- Jones et al. (2004) Jones, D. H. et. al. 2004, MNRAS, 355, 747
- Jones et al. (2003) Jones, L. R., Ponman, T. J., Horton, A., Babul, A., Ebeling, H., & Burke, D. J. 2003, MNRAS, 343, 627
- Kalinkov & Kuneva (1995) Kalinkov, M., & Kuneva, I. 1995, A&AS, 113, 451
- Kawata & Rauch (2007) Kawata, D., & Rauch, M. 2007, ApJ, in press (astro-ph/07040652)
- Khosroshahi, Ponman & Jones (2007) Khosroshahi, H. G., Ponman, T. J., & Jones, L. R. 2007, to appear in MNRAS(astro-ph/070205)
- Lauberts (1982) Lauberts, A. 1982, ESO/Uppsala survey of the ESO(B) atlas, (Garching: European Southern Observatory)
- Leahy (1991) Leahy, J. P. 1991, in Beams and Jets in Astrophysics, eds. P. A. Hughes, Cambridge University Press, p.100
- Marconi et al. (2004) Marconi, A., Risaliti, G., Gilli, R., Hunt, L. K., Maiolino, R., & Salvati, M. 2004, MNRAS, 351, 169
- McCarthy et al. (1991) McCarthy, P. J., van Breugel, W., & Kapahi, V. K. 1991, ApJ, 371, 478
- Miley (1980) Miley, G. K. 1980, ARA&A, 18, 165
- Mills, Slee & Hill (1960) Mills, B. Y., Slee, O. B., & Hill, E. R. 1960, Aust. J. Phys., 13, 676
- Mulchaey et al. (2003) Mulchaey, J. S., Davis, D. S., Mushotzky, R. F., & Burnstein, D. 2003, ApJS, 145, 39
- Myers et al. (2004) Myers, A. D., Shanks, T., Outram, P. J., Frith, W. J., & Wolfendale, A. W. 2004, MNRAS, 347, L67
- Nicastro et al. (2003) Nicastro, F., et al. 2003, Nature, 421, 719
- Nicastro et al. (2005) Nicastro, F., et al. 2003, ApJ, 629, 700
- O’Sullivan & Ponman (2004) O’Sullivan, E., & Ponman, T. J. 2004, MNRAS, 354, 935
- Peder et al. (2002) Peder, N., et al. 2002, MNRAS, 332, 827
- Rupke, Veilleux & Sanders (2005) Rupke, D. S., Veilleux, S., & Sanders, D. B. 2005, ApJS, 160, 115
- Saripalli et al. (1986) Saripalli, L., Gopal-Krishna, Reich, W., & Kühr, H. 1986, A&A, 170, 20
- Saripalli (1988) Saripalli, L. 1988, Ph.D thesis, Indian Institute of Science, Bangalore, India.
- Saripalli et al. (2002) Saripalli, L., Subrahmanyan, R., & Udaya Shankar, N. 2002, ApJ, 565, 256
- Saripalli et al. (2005) Saripalli, L., Hunstead, R. W., Subrahmanyan, R., & Boyce, E. 2005, AJ, 130, 896
- Sault et al. (1999) Sault, R., J., Bock, D. C.-J., & Duncan, A. R. 1999, A&AS, 139, 387
- Scheuer (1995) Scheuer, P. A. G. 1995, MNRAS, 277, 331
- Schoenmakers et al. (2000) Schoenmakers, A. P., Mack, K. H., de Bruyn, A. G., Rottgering, H. J. A., Klein, U., & van der Laan, H. 2000, A&AS, 146, 293
- Spergel et al. (2006) Spergel, D. N., et al. 2007, ApJS, 170, 377
- Subrahmanya & Hunstead (1986) Subrahmanya, C. R., & Hunstead, R. W. 1986, A&A, 170, 27
- Subrahmanyan et al. (2008) Subrahmanyan, R., Ekers, R. D., Saripalli, L., & Sadler, E. M. 2008, to appear in From planets to dark energy: the modern radio universe, Proceedings of Science.
- Tasker et al. (1994) Tasker, N. J., Condon,J. J., Wright, A. E., & Griffith, M. R. 1994, AJ, 107, 2115
- Valageas, Schaeffer & Silk (2003) Valageas, P., Schaeffer, R., & Silk, J. 2003, MNRAS, 344, 53
- Wardle et al. (1998) Wardle, J. F. C, Homan, D. C., Ojha, R., & Roberts, D. H. 1998, Nature, 395, 457
- Yoshida, Furlanetto & Hernquist (2005) Yoshida, N., Furlanetto, S. R., & Hernquist, L. 2005, ApJ, 618, L91
- Zappacosta et al. (2005) Zappacosta, L., Maiolini, R., Mannucci, F., Gilli, R., & Schuecker, P. 2005, MNRAS, 357, 929
| Freq. (MHz) | Survey/Telescope | N lobe (Jy) | S lobe (Jy) | Total (Jy) | Reference |
|---|---|---|---|---|---|
| 34.5 | GEETEE | Dwarakanath & Udayashankar (1990) | |||
| 85.5 | MSH | Mills, Slee & Hill (1960) | |||
| 408 | 408-MHz all-sky survey | Haslam et al. (1982) | |||
| 843 | MOST | 2.82 | 2.04 | This paper | |
| 1520 | VLA | 1.55 | 1.41 | This paper | |
| 2695 | Effelsberg | 0.85 | 0.77 | Saripalli (1988) | |
| 4850 | PMN | 0.45 | 0.38 | Tasker et al. (1994) | |
| 10700 | Effelsberg | 0.193 | 0.17 | Jamrozy et al. (2005) |