The Sixth VLBA Calibrator Survey — VCS6
Abstract
This paper presents the sixth part to the Very Long Baseline Array (VLBA) Calibrator Survey. It contains the positions and maps of 264 sources of which 169 were not previously observed with very long baseline interferometry (VLBI). This survey, based on two 24 hour VLBA observing sessions, was focused on 1) improving positions of 95 sources from previous VLBA Calibrator surveys that were observed either with very large a priori position errors or were observed not long enough to get reliable positions and 2) observing remaining new flat-spectrum sources with predicted correlated flux density in the range 100–200 mJy that were not observed in previous surveys. Source positions were derived from astrometric analysis of group delays determined at the 2.3 and 8.6 GHz frequency bands using the Calc/Solve software package. The VCS6 catalogue of source positions, plots of correlated flux density versus projected baseline length, contour plots and fits files of naturally weighted CLEAN images, as well as calibrated visibility function files are available on the Web at http://vlbi.gsfc.nasa.gov/vcs6.
Subject headings:
astrometry — catalogues — surveys — radio continuum: galaxies1. Introduction
This work is a continuation of the project of surveying the sky for bright compact radio sources. These sources can be used as phase referencing calibrators for imaging of weak objects with very long baseline interferometry (VLBI) and as targets for space navigation, monitoring the Earth’s rotation, differential astrometry, and space geodesy. Precise positions of radio sources are needed for these applications. Since 1979 more than 4400 24 hour VLBI experiments have been scheduled in geodetic mode. These observations also determined parameters associated with the Earth orientation and rotation, antenna position and motions and other astrometric/geodetic parameters. By November 01, 2007, 1137 sources were observed in these experiments and 1045 of them were detected. The observations are described by Ma et al. (1998) and the latest catalog of 776 sources is given as the ICRF-Ext2 catalog (Fey et al. 2004).
Because the astrometric and image quality of the radio sources (targets) improve with decreasing angular separation of the calibrator and the target, a higher density of sources than that from the ICRF catalogue was needed. Since 1994, 22 dedicated 24-hr experiments with the VLBA, called the VLBA calibrator survey (VCS), were made in order to increase the density of suitable VLBI phase reference sources (Beasley et al. 2002, Fomalont et al. 2003, Petrov et al. 2005, 2006, Kovalev et al. 2007). In these experiments, 3601 sources with declinations were observed, including 764 objects previously observed under geodetic programs, and 3301 of them were detected. The catalogue of source positions derived from a single least square (LSQ) solution using all geodetic and VCS observations forms the pool of sources with positions at a milliarcsec level of accuracy that is widely used for phase referencing observations, for statistical analysis, and for other applications. Improving the precision of this catalogue and an increase in the number of objects is an important task.
In this paper we present an extension of the VCS catalogue, called the VCS6 catalogue. The objectives of this campaign were to improve the catalogue of compact radio sources. Our approach to this problem was 1) to improve positions of sources observed in the previous VCS campaigns that had a) poor a priori positions; b) were not observed long enough in the first two VCS1 24-hour experiments recorded at the 64 Mbit/sec rate; and 2) to get positions of new sources. The new sources were taken from the lists of a) intra-day variable sources observed in the framework of the MASIV survey (Lovell et al. 2003), not observed before with the VCS, and b) leftovers from the list of candidate sources prepared for the VCS5 campaign (Kovalev et al. 2007) that were not observed due to lack of resources.
Since the observations, calibrations, astrometric solutions and imaging are similar to that of VCS1–5, most of the details are described by Beasley et al. (2002), Petrov et al. (2005), and Petrov et al. (2006). In §2 we describe the strategy for selecting 285 candidate sources observed in two 24 hour sessions with the VLBA. In §3 we briefly outline the observations and data processing. We present the VCS6 catalogue in §4, and summarize our results in §5.
2. Source selection
Improvement of the astrometric catalogue of compact radio sources can be made in two ways: 1) improve of position accuracy of the sources with coordinate errors significantly worse than the median error; 2) increase the total number of sources. We selected both ways.
It should be noted that in general the problem of improving the catalogue is mainly the question of optimization of resource allocation. Had we had unlimited resources, it would be sufficient to observe all sources for a long time and with the highest data rate the current technology can offer. But we would like to achieve the best catalogue improvement with the relatively small resources that were available.
The formal position uncertainty of a source detected in two scans at all VLBA baselines is below 0.3 mas, which is believed to be the level of systematic errors (refer to Ma et al. 1998 for justification of this limit) caused by mismodeling troposphere path delay and unaccounted source structure. At the same time, the formal uncertainties of 13% of the sources in the astrometric pool are worse than 5 mas. This means there were not enough detections of these sources, especially at long baselines, for deriving precise coordinates. The longer the baseline, the more sensitive observations are to source position with a given signal to noise ratio. There may be a number of reasons why a source is not detected at long baselines. First, the source may be too resolved, and its correlated density at long baselines falls below the detection limit. This is the most common reason. Since for many sources the correlated flux density drops rapidly with increasing baseline length, this would require a significant improvement in sensitivity in order to detect the source at all baselines. A second reason is that the a priori source positions were so bad that interferometric fringes were not found in the search window. A third reason is that the source was not scheduled at long baselines at all. This often happens when a scheduling algorithm for geodetic VLBI observations is used. Geodetic schedules are optimized to have uniform source sky coverage at each station every 1–3 hours and this goal often contradict with having observations at long baseline for every targeted source. A fourth reason is instrumental failure or especially bad weather at one or more stations.
We selected sources from several lists. The first list marked “r” contains 68 sources that were observed in the first two 24-hour VCS1 experiments and had from 1 to 9 detections only. The VCS experiments in 1994–1995 were recorded at the 64 Mbit s-1 rate, half the rate of later experiments, and each source was observed for 90 s. We re-observed them in two scans of 188 s with 128 Mbit s-1, i.e. lowered the detection limit by a factor of 2. The second list marked “a” contains 27 sources correlated with a priori position errors ranging from to . With such huge errors in a priori positions, the process of fringe search may fail, especially at long baselines, because correction to the group delay and delay rate may be outside the search window. Even if fringes are detected, the fringe amplitude and phase may be significantly distorted. The sources from lists “r” and “a” have a good chance to be detected at long baselines, therefore they are considered to be the best candidates for improvement with a minimal resource allocation.
The second way to improve an astrometric catalogue is to observe new sources. There is a strong evidence (e.g., Jauncey & Macquart 2001, Rickett et al. 2001, Dennett-Thorpe & de Bruyn 2002) that the intra-day variability (IDV) is caused by scattering in the galactic media. Ojha et al. (2004) observed with the VLBA a sample of 75 IDV sources with flux density below 300 mJy and made images; they confirmed that these sources have a very compact, core-dominated morphology. Kovalev et al. (2005) analyzed properties of 250 strong active galactic nuclei including 43 known IDV sources; they have shown that the VLBI compactness parameter reaches its highest value for the IDV sub-sample of objects. Unfortunately, Ojha et al. (2004) did not make images, even the source list, publicly available in digital form, so we were unable to use their results for source selection. H.E. Bignall provided us preliminary estimates of the mean flux density at 5 GHz from VLA observations of the final sample of 482 sources (private communication, 2006) observed in the MASIV program (Lovell et al. 2003). We removed from this list the sources previously observed with the VLBA in astrometry/geodesy mode and ordered the remaining 124 sources by decreasing their flux densities. The first top 30 objects with the highest flux densities derived from analysis of the MASIV VLA observations exceeding 130 mJy at 5 GHz were scheduled in the VCS6 campaign in two scans, each with integration time of 193 s. The list of these sources is marked as “i”.
The other list of candidate sources are the leftover sources from the VCS5 campaign which aimed to observe all the remaining flat-spectrum sources with expected correlated flux density mJy (Kovalev et al. 2007). For each source the probability of detection was computed based on published multi-frequency single dish flux densities. The probability of detection at the VLBA was computed according to the algorithm proposed by Petrov et al. (2006) that is based on estimates of the extrapolated flux density at the frequency 8.6 GHz and the spectral index. Unfortunately, these estimates are often either incomplete or unreliable, especially for sources with flux density below 300 mJy. We visually inspected each spectrum plot and assigned to each spectrum a class in accordance to our estimation of a probability to detect correlated flux density greater than 200 mJy at 8.6 GHz. All the sources from the first class with the highest probability of detection were observed by Kovalev et al. (2007). In this paper we have observed 160 objects of the second class with an intermediate probability (list “v”).
In addition to target sources, tropospheric calibrators have to be observed extensively in astrometric experiments. The list of troposphere calibrators111http://vlbi.gsfc.nasa.gov/vcs/tropo_cal.html was selected from the sources which, according to the 2 cm VLBA survey results (Kovalev et al. 2005), showed the greatest compactness index, i.e. the ratio of the correlated flux density measured at long VLBA spacings to the flux density integrated over the VLBA image.
3. Observations and data analysis
Observations were performed in two 24 hour sessions with the VLBA on 2006 December 18 and 2007 January 11. The target sources were observed in a sequence designed to minimize loss of time from antenna slewing. In addition to these objects, observations of 3–4 strong sources from a list of 62 tropospheric calibrators were made every 1–1.5 hours during the sessions. These observations were scheduled in such a way, that at each VLBA station at least one of these sources was observed at an elevation angle less than 20°, and at least one at an elevation angle greater than 50°. The purpose of observing tropospheric calibrators is twofold. First, they significantly improve separation of variables that parameterize variable zenith path delay modeled as an expansion over the B-spline basis with equidistant nodes with a time span of 20 minutes. Second, their positions are listed in the ICRF catalogue (Ma et al. 1998), so they tie positions of VCS6 sources to this catalogue. In total, 347 sources were observed, including 285 targeted objects. The antennas were scheduled to be on-source 70.2% of the time.
Similar to the previous VLBA Calibrator Survey observing campaigns, we used the VLBA dual-frequency geodetic mode, observing simultaneously at 2.3 GHz and 8.6 GHz, right circular polarization. Each band was separated into four 8 MHz channels (IFs) which spanned 140 MHz at 2.3 GHz and 490 MHz at 8.6 GHz (Table 1), in order to provide precise measurements of group delays for astrometric processing. The data were correlated with an accumulation period of 0.5 second in 64 frequency channels per IF in order to provide a wide window for fringe searche.
| IF | Frequency range (MHz) |
|---|---|
| (1) | (2) |
| 1 | 2232.99 — 2240.99 |
| 2 | 2262.99 — 2270.99 |
| 3 | 2352.99 — 2360.99 |
| 4 | 2372.99 — 2380.99 |
| 5 | 8405.99 — 8413.99 |
| 6 | 8475.99 — 8483.99 |
| 7 | 8790.99 — 8898.99 |
| 8 | 8895.99 — 8903.99 |
| Source list | Detected | Non-detected |
|---|---|---|
| (1) | (2) | (3) |
| a | 27 | 0 |
| r | 68 | 0 |
| v | 139 | 21 |
| i | 30 | 0 |
| T | 62 | 0 |
Note. — Column designation: (1) The name of the list; (2) the number of detected sources; (3) the number of not detected sources.
Processing of the VLBA correlator output was done in three steps. In the first step the data were calibrated and fringed using the Astronomical Image Processing System (AIPS) (Greisen 1988) in a standard way. An amplitude shift was present in the calibrated data because of the following. Our IFs are widely spread over receiver bands (Table 1) while the VLBA S band and X band gain-curve parameters applied are measured around 2275 GHz and 8425 MHz respectively (Ulvestad & Wrobel 2007), and the noise diode spectrum is not ideally flat. We have used strong flat-spectrum sources in the sample in order to estimate global amplitude correction factors which differ from 1.00 by more than 0.09 (Table 3). These coefficients were applied to the data in both observing sessions.
In the second step, data were imported to the Caltech DIFMAP package (Shepherd 1997), data flagged, and images were produced using automated hybrid imaging procedure originally suggested by Greg Taylor (Pearson et al. 1994) which we optimized for our experiment. We were able to reach the VLBA image thermal noise level for most of our CLEAN images (Ulvestad & Wrobel 2007). Errors on our estimates of correlated flux density values for sources stronger than 100 mJy were dominated by the accuracy of amplitude calibration, which for the VLBA, according to Ulvestad & Wrobel (2007), is at the level of 5 % at 1 GHz to 10 GHz. Our error estimate was confirmed by comparison of the flux densities integrated over the VLBA images with the single-dish flux densities which we measured with RATAN–600 in 2006 and 2007 for slowly varying sources without extended structure. The methods of RATAN–600 single-dish observations and data processing can be found in Kovalev et al. (1999).
| Antena | IF | Coefficient |
|---|---|---|
| (1) | (2) | (3) |
| Bruster | 4 | 1.75 |
| Los Alamos | 3 | 0.83 |
| Los Alamos | 4 | 0.70 |
| Ovens Valey | 4 | 0.90 |
| Source name | J2000.0 Coordinates | Errors (mas) | Correlated flux density (Jy) | |||||||||||
|---|---|---|---|---|---|---|---|---|---|---|---|---|---|---|
| 8.6 GHz | 2.3 GHz | |||||||||||||
| Class | IVS | IAU | Right ascension | Declination | Corr | # Obs | Total | Unres | Total | Unres | Band | List | ||
| (1) | (2) | (3) | (4) | (5) | (6) | (7) | (8) | (9) | (10) | (11) | (12) | (13) | (14) | (15) |
| N | 0000199 | J00031941 | 00 03 15.949411 | 19 41 50.40190 | 2.59 | 6.88 | -0.814 | 11 | X/S | v | ||||
| C | 0003123 | J00061235 | 00 06 23.056110 | 12 35 53.09745 | 0.92 | 1.08 | 0.280 | 24 | X/S | v | ||||
| C | 0005683 | J00086837 | 00 08 33.472899 | 68 37 22.04848 | 1.81 | 0.58 | -0.190 | 90 | X | r | ||||
| C | 0007439 | J00104412 | 00 10 30.046481 | 44 12 42.50407 | 0.52 | 0.97 | 0.295 | 48 | X/S | i | ||||
| C | 0008300 | J00102945 | 00 10 45.177362 | 29 45 13.17767 | 0.68 | 2.25 | -0.352 | 43 | X/S | v | ||||
| C | 0009148 | J00111434 | 00 11 40.455912 | 14 34 04.63437 | 0.77 | 1.28 | 0.356 | 38 | X/S | v | ||||
| C | 0010155 | J00131513 | 00 13 20.701815 | 15 13 47.78346 | 1.16 | 2.69 | -0.334 | 16 | X/S | v | ||||
| C | 0013184 | J00151807 | 00 15 34.324495 | 18 07 25.58298 | 1.63 | 3.08 | -0.608 | 20 | X/S | v | ||||
| U | 0016223 | J00192205 | 00 19 22.939314 | 22 05 19.75395 | 20.67 | 59.79 | 0.977 | 2 | X | v | ||||
| C | 0018729 | J00217312 | 00 21 27.374710 | 73 12 41.93114 | 6.68 | 1.48 | 0.251 | 24 | X/S | r | ||||
Note. — Table 4 is presented in its entirety in the electronic edition of the Astronomical Journal. A portion is shown here for guidance regarding its form and contents. Units of right ascension are hours, minutes and seconds, units of declination are degrees, minutes and seconds. Assigned source class in (1) is ‘C’ for calibrator, ‘N’ for non-calibrator with reliable coordinates, ‘U’ for non-calibrator with unreliable coordinates; see § 4 for details.
In the third step, the data were imported to the Calc/Solve software, group delay ambiguities were resolved, outliers eliminated and coordinates of new sources were adjusted using ionosphere-free combinations of X band and S band group delay observables of the two VCS6 sessions, 22 VCS1–5 experiments and 4453 twenty four hour International VLBI Service for astrometry and geodesy (IVS) experiments222http://vlbi.gsfc.nasa.gov/astro in a single least square solution. A boundary condition requiring zero net-rotation of new coordinates of the 212 sources listed as “defining” in the ICRF catalogue with the respect to their positions from that catalogue was imposed in order to select a unique solution of differential equations of photon propagation.
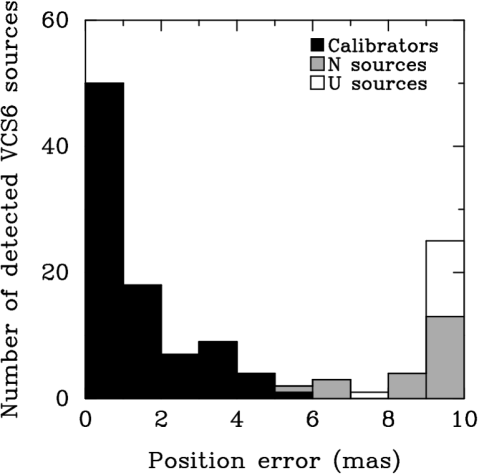
Among 285 observed sources, 264 were detected (refer to Table 2), including 169 new sources. Of the 95 sources re-observed in VCS6, all were detected, and the image and astrometric precision were significantly improved. Among these 95 re-observed objects, 27 sources had position accuracies better than 5 mas before the VCS6 campaign, after the VCS6 campaign this number increased to 63 objects. The histogram of source position errors is presented in Figure 1.
4. VCS6 catalogue
The VCS6 catalogue is listed in Table 4. Although the positions of 3913 sources were adjusted in the LSQ solution that used all observations from 4400 observing sesions, only coordinates of targeted sources observed in the VCS6 campaign are presented. Some of targeted sources were alswo observed in previous campaigns.


The first column gives the calibrator class: “C” — calibrator, i.e. the semi-major axis of the inflated error ellipse is less than 5 mas and more than 8 good pairs of X/S group delay measurements are available. If a source does not satisfy these criteria, it is assigned either class “N” — non-calibrator with reliable positions, i.e. more than 8 good group delay measurements at X or S band are available; or class “U” — non-calibrator with unreliable positions, i.e. less than 8 detections at any band are available, and therefore, there is a risk that group delay ambiguities were resolved incorrectly. The second and third columns give IVS source name (B1950 notation), and IAU name (J2000 notation). The fourth and fifth columns give source coordinates at the J2000.0 epoch. Columns /6/ and /7/ give inflated source position uncertainties in right ascension (without factor) and declination in mas, and column /8/ gives the correlation coefficient between the errors in right ascension and declination. The number of group delays used for position determination is listed in column /9/. Columns /10/ and /12/ give the estimate of the flux density integrated over entire map in Janskies at X and S band respectively. This estimate is computed as a sum of all CLEAN components if a CLEAN image was produced. If we did not have enough detections of the visibility function to produce a reliable image, the integrated flux density is estimated as the median of the correlated flux density measured at projected spacings less than 25 and 7 M for X and S bands respectively. The integrated flux density is the source total flux density with spatial frequencies less than 4 M at X band and 1 M at S band filtered out, or in other words, this is the flux density from all details of a source with size less than 50 mas at X band and 200 mas at S band. Column /11/ and /13/ give the flux density of unresolved components estimated as the median of correlated flux density values measured at projected spacings greater than 170 M for X band and greater than 45 M for S band. For some sources no estimates of the integrated and/or unresolved flux density are presented, because either no data were collected at the baselines used in calculations, or these data were unreliable. Column /14/ gives the data type used for position estimation: X/S stands for ionosphere-free linear combination of X and S wide-band group delays; X stands for X band only group delays; and S stands for S band only group delays. Some sources which yielded less than 8 pairs of X and S band group delay observables had 2 or more observations at X and/or S band observations. For these sources either X-band or S-band only estimates of coordinates are listed in the VCS6 catalogue, whichever uncertainty is less. Column /15/ gives the name of the input source list.
Table 5 presents 21 sources not detected in VCS6 VLBA observations. Source positions used for observations and correlation are presented. They are taken from the NVSS catalogue (Condon et al. 1998). The correlated flux density for the non-detected sources is estimated to be less than 60 mJy at 2.3 GHz and 8.6 GHz.
| Source name | J2000.0 Coordinates | |||
|---|---|---|---|---|
| IVS | IAU | Right ascension | Declination | List |
| (1) | (2) | (3) | (4) | (5) |
| 0123-015 (catalog ) | J0126-0118 (catalog ) | 01 26 04.77 | -01 18 16.2 | v |
| 0428-252 (catalog ) | J0430-2507 (catalog ) | 04 30 16.05 | -25 07 38.6 | v |
| 0741-182 (catalog ) | J0743-1825 (catalog ) | 07 43 34.76 | -18 25 03.1 | v |
| 0829+140 (catalog ) | J0831+1353 (catalog ) | 08 31 59.12 | +13 53 15.4 | v |
| 0916-219 (catalog ) | J0918-2206 (catalog ) | 09 18 30.27 | -22 06 55.3 | v |
Note. — Table 5 is presented in its entirety in the electronic edition of the Astronomical Journal. A portion is shown here for guidance regarding its form and contents. Units of right ascension are hours, minutes and seconds; units of declination are degrees, minutes and seconds. The J2000 source positions are taken from the NVSS survey (Condon et al. 1998), they were used for VCS6 VLBA observing and correlation.
Including VCS6 observations raised the total number of calibrators with declination to 2853. The sky calibrator density for different radii of a search circle for declination is presented in Figure 2.
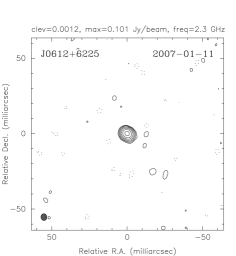
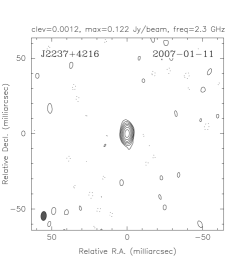
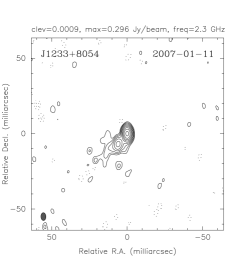
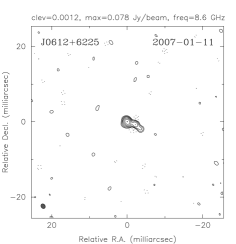
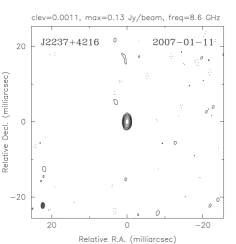
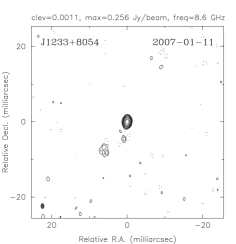
In addition to these tables, the html version of this catalogue is posted on the Web333http://vlbi.gsfc.nasa.gov/vcs6. For each source it has 8 links: to a pair of postscript maps of the source at X and S-band; to a pair of plots of correlated flux density as a function of the length of the baseline vector projection to the plane; to a pair of fits files with CLEAN components of naturally weighted source images; and to a pair of fits files with calibrated data. The coordinates and the plots are also accessible from the NRAO VLBA Calibration Search web-page444http://www.vlba.nrao.edu/astro/calib. Figure 3 presents examples of naturally weighted contour CLEAN images as well as correlated flux density versus projected spacing dependence for three sources from the lists ‘r’, ‘i’, and ‘v’, respectively: J0612+6225 (catalog ), J2237+4216 (catalog ), and J1233+8054 (catalog ).
5. Summary
The VCS6 Survey has added 169 new compact radio sources not previously observed with VLBI and significantly improved coordinates of 95 other objects. Among the new sources, 103 objects turned out to be suitable as phase referencing calibrators and as target sources for geodetic applications. Their coordinates have position accuracy better than 5 mas.
References
- Beasley et al. (2002) Beasley, A. J., Gordon, D., Peck, A. B., Petrov, L., MacMillan, D. S., Fomalont, E. B., & Ma, C. 2002, ApJS, 141, 13
- Condon et al. (1998) Condon, J. J., Cotton, W. D., Greisen, E. W., Yin, Q. F., Perley, R. A., Taylor, G. B., Broderick, J. J. 1998, AJ, 115, 1693
- Dennett-Thorpe & de Bruyn (2002) Dennett-Thorpe, J., & de Bruyn, A. G. 2002, Nature, 415, 57
- Fomalont et al. (2003) Fomalont, E., Petrov, L., McMillan, D. S., Gordon, D., Ma, C. 2003, AJ, 126, 2562
- Fey et al. (2004) Fey, A.L., Ma, C., Arias, E. F., Charlot, P., Feissel-Vernier, M., Gontier, A.-M., Jacobs, C. S., Li, J., MacMillan, D. S. 2004, AJ, 127, 3587.
- Greisen (1988) Greisen, E. W., 1988, in Acquisition, Processing and Archiving of Astronomical Images, ed. G. Longo & G. Sedmak (Napoli: Osservatorio Astronomico di Capodimonte), 125
- Jauncey & Macquart (2001) Jauncey, D. L., & Macquart, J.-P. 2001, A&A, 370, L9
- Kovalev et al. (1999) Kovalev, Y. Y., Nizhelsky, N. A., Kovalev, Yu. A., Berlin, A. B., Zhekanis, G. V., Mingaliev, M. G., & Bogdantsov, A. V. 1999, A&AS, 139, 545
- Kovalev et al. (2005) Kovalev, Y. Y., et al., 2005, AJ, 130, 2473.
- Kovalev et al. (2007) Kovalev, Y .Y., L. Petrov, E. Fomalont, D. Gordon, 2007, AJ, 133, 1236.
- Lovell et al. (2003) Lovell, J.E.J., Jauncey, D. L., Bignall, H. E., Kedziora-Chudczer, L.J, Macquart, J.-P., Rickett, B.J. & Tzioumis, A. K., 2003, AJ, 126, 1699.
- Ma et al. (1998) Ma, C., Arias, E. F., Eubanks, T. M., Fey, A. L., Gontier, A.-M., Jacobs, C. S., Sovers, O. J., Archinal, B. A., & Charlot, P., 1998, AJ, 116, 516
- Ojha et al. (2004) Ojha, R., Fey, A.L, Lovell, J.E.J., Jauncey, D.L., & Johnston, K.J., 2004, AJ, 128, 1570.
- Pearson et al. (1994) Pearson, T. J., Shepherd, M. C., Taylor, G. B., & Myers, S. T. 1994, BAAS, 185, 0808
- Petrov et al. (2005) Petrov, L., Kovalev, Y.Y., Fomalont, E., Gordon, D. 2005, AJ, 129, 1163.
- Petrov et al. (2006) Petrov, L., Y .Y. Kovalev, E. Fomalont, D. Gordon, 2006, AJ, 131, 1872.
- Rickett et al. (2001) Rickett, B. J., Witzel, A., Kraus, A., Krichbaum, T. P., & Qian, S. J. 2001, ApJ, 550, L11
- Shepherd (1997) Shepherd, M. C. 1997, in ASP Conf. Series. 125, Astronomical Data Analysis Software and Systems VI, ed. by G. Hunt & H. E. Payne (San Francisco: ASP), 77
- Ulvestad & Wrobel (2007) Ulvestad, J. S., & Wrobel, J. M., eds. 2007, VLBA observational status summary, http://www.vlba.nrao.edu/astro/obstatus/current/obssum.html, NRAO
- Verkhodanov et al. (1997) Verkhodanov, O. V., Trushkin, S. A., Andernach, H., & Chernenkov, V. N. 2005, Bull. Special Astrophys. Obs., 58, 118