M. Ablikim1, J. Z. Bai1, Y. Bai1, Y. Ban11, X. Cai1, H. F. Chen16, H. S. Chen1, H. X. Chen1, J. C. Chen1, Jin Chen1, X. D. Chen5, Y. B. Chen1, Y. P. Chu1, Y. S. Dai18, Z. Y. Deng1, S. X. Du1, J. Fang1, C. D. Fu14, C. S. Gao1, Y. N. Gao14, S. D. Gu1, Y. T. Gu4, Y. N. Guo1, Z. J. Guo15a, F. A. Harris15, K. L. He1, M. He12, Y. K. Heng1, J. Hou10, H. M. Hu1, T. Hu1, G. S. Huang1b, X. T. Huang12, Y. P. Huang1, X. B. Ji1, X. S. Jiang1, J. B. Jiao12, D. P. Jin1, S. Jin1, Y. F. Lai1, H. B. Li1, J. Li1, R. Y. Li1, W. D. Li1, W. G. Li1, X. L. Li1, X. N. Li1, X. Q. Li10, Y. F. Liang13, H. B. Liao1c, B. J. Liu1, C. X. Liu1, Fang Liu1, Feng Liu6, H. H. Liu1d, H. M. Liu1, J. B. Liu1e, J. P. Liu17, H. B. Liu4, J. Liu1, Q. Liu15, R. G. Liu1, S. Liu8, Z. A. Liu1, F. Lu1, G. R. Lu5, J. G. Lu1, C. L. Luo9, F. C. Ma8, H. L. Ma2, L. L. Ma1f, Q. M. Ma1, M. Q. A. Malik1, Z. P. Mao1, X. H. Mo1, J. Nie1, S. L. Olsen15, R. G. Ping1, N. D. Qi1, H. Qin1, J. F. Qiu1, G. Rong1, X. D. Ruan4, L. Y. Shan1, L. Shang1, C. P. Shen15, D. L. Shen1, X. Y. Shen1, H. Y. Sheng1, H. S. Sun1, S. S. Sun1, Y. Z. Sun1, Z. J. Sun1, X. Tang1, J. P. Tian14, G. L. Tong1, G. S. Varner15, X. Wan1, L. Wang1, L. L. Wang1, L. S. Wang1, P. Wang1, P. L. Wang1, W. F. Wang1g, Y. F. Wang1, Z. Wang1, Z. Y. Wang1, C. L. Wei1, D. H. Wei3, Y. Weng1, N. Wu1, X. M. Xia1, X. X. Xie1, G. F. Xu1, X. P. Xu6, Y. Xu10, M. L. Yan16, H. X. Yang1, M. Yang1, Y. X. Yang3, M. H. Ye2, Y. X. Ye16, C. X. Yu10, G. W. Yu1, C. Z. Yuan1, Y. Yuan1, S. L. Zang1h, Y. Zeng7, B. X. Zhang1, B. Y. Zhang1, C. C. Zhang1, D. H. Zhang1, H. Q. Zhang1, H. Y. Zhang1, J. W. Zhang1, J. Y. Zhang1, X. Y. Zhang12, Y. Y. Zhang13, Z. X. Zhang11, Z. P. Zhang16, D. X. Zhao1, J. W. Zhao1, M. G. Zhao1, P. P. Zhao1, Z. G. Zhao1i, H. Q. Zheng11, J. P. Zheng1, Z. P. Zheng1, B. Zhong9 L. Zhou1, K. J. Zhu1, Q. M. Zhu1, X. W. Zhu1, Y. C. Zhu1, Y. S. Zhu1, Z. A. Zhu1, Z. L. Zhu3, B. A. Zhuang1, B. S. Zou1
(BES Collaboration)
1 Institute of High Energy Physics, Beijing 100049, People’s Republic of China
2 China Center for Advanced Science and Technology(CCAST),
Beijing 100080,
People’s Republic of China
3 Guangxi Normal University, Guilin 541004, People’s Republic of China
4 Guangxi University, Nanning 530004, People’s Republic of China
5 Henan Normal University, Xinxiang 453002, People’s Republic of China
6 Huazhong Normal University, Wuhan 430079, People’s Republic of China
7 Hunan University, Changsha 410082, People’s Republic of China
8 Liaoning University, Shenyang 110036, People’s Republic of China
9 Nanjing Normal University, Nanjing 210097, People’s Republic of China
10 Nankai University, Tianjin 300071, People’s Republic of China
11 Peking University, Beijing 100871, People’s Republic of China
12 Shandong University, Jinan 250100, People’s Republic of China
13 Sichuan University, Chengdu 610064, People’s Republic of China
14 Tsinghua University, Beijing 100084, People’s Republic of China
15 University of Hawaii, Honolulu, HI 96822, USA
16 University of Science and Technology of China, Hefei 230026,
People’s Republic of China
17 Wuhan University, Wuhan 430072, People’s Republic of China
18 Zhejiang University, Hangzhou 310028, People’s Republic of China
a Current address: Johns Hopkins University, Baltimore, MD 21218, USA
b Current address: University of Oklahoma, Norman, Oklahoma 73019, USA
c Current address: DAPNIA/SPP Batiment 141, CEA Saclay, 91191,
Gif sur
Yvette Cedex, France
d Current address: Henan University of Science and Technology,
Luoyang
471003, People’s Republic of China
e Current address: CERN, CH-1211 Geneva 23, Switzerland
f Current address: University of Toronto, Toronto M5S 1A7, Canada
g Current address: Laboratoire de l’Accélérateur
Linéaire,
Orsay, F-91898, France
h Current address: University of Colorado, Boulder, CO 80309, USA
i Current address: University of Michigan, Ann Arbor, MI 48109,
USA
Partial wave analysis of
Abstract
Using events collected in the BESII detector, the radiative decay is studied. The invariant mass distribution exhibits a near-threshold enhancement that peaks around 2.24 GeV/. A partial wave analysis shows that the structure is dominated by a state () with a mass of GeV/ and a width of GeV/. The product branching fraction is: .
1 Introduction
In addition to the spectrum of ordinary light meson states, QCD-motivated models predict a rich spectrum of glueballs, hybrids and four quark states [1]. Radiative decays provide an excellent laboratory for testing these predictions, and systems of two vector particles have been intensively examined for signatures of gluonic bound states [2]. Pseudoscalar enhancements in and final states have been seen in radiative decays [3, 4, 5, 6, 7]. Recently, a near-threshold scalar, the or was reported in the invariant mass distribution from the doubly OZI suppressed decays of [8], thereby adding an additional puzzle to the already confusing spectrum of low-lying scalar mesons [9, 10].
Structures in the invariant-mass spectrum have been observed by several experiments both in the reaction [11] and in radiative decays [12, 13, 14]. The was first observed by the MARK III collaboration in radiative decays [12]. A fit to the invariant-mass spectrum gave a mass of MeV/ and a width of MeV/. The production branching fractions are for the mode and for the mode. An angular analysis of the structure found it to be consistent with a assignment. It was subsequently observed by the DM2 collaboration, also in decays [13, 14].
In this letter we present results from a high statistics study of in the final state, using a sample of events collected with the BESII detector at the Beijing Electron-Positron Collider (BEPC). The presence of a signal around 2.24 GeV/ and its pseudoscalar character are confirmed, and the mass, width, and branching fraction are determined by a partial wave analysis (PWA).
2 BES detector and Monte Carlo simulation
BESII is a large solid-angle magnetic spectrometer that is described in detail in Ref. [15]. Charged particle momenta are determined with a resolution of (with in GeV/) in a 40-layer cylindrical main drift chamber (MDC). Particle identification is accomplished using specific ionization () measurements in the MDC and time-of-flight (TOF) measurements in a barrel-like array of 48 scintillation counters. The resolution is = 8.0%; the TOF resolution is = 180 ps for the Bhabha events. Outside of the TOF counters is a 12-radiation-length barrel shower counter (BSC) comprised of gas tubes interleaved with lead sheets. The BSC measures the energies and directions of photons with resolutions of (with in GeV), = 7.9 mrad, and = 2.3 cm. The iron flux return of the magnet is instrumented with three double layers of counters that are used to identify muons.
In this analysis, a GEANT3-based Monte Carlo (MC) simulation program (SIMBES) [16], which includes detailed consideration of the actual detector responses (such as dead electronic channels), is used. The consistency between data and Monte Carlo has been checked with many high-purity physics channels [16].
3 Event selection
Since the is difficult to identify in BESII, its detection is not required in the selection of events. candidates are selected from events with four charged tracks with net charge zero in the MDC and with one or two isolated photons in the BSC. Charged tracks are required to be well fitted to a helix, be within the polar angle region , and have a transverse momentum larger than 50 MeV/. For each track, the time-of-flight (TOF) and specific ionization () measurements in the MDC are combined to form a particle identification confidence level for the and hypotheses; the particle type with the highest confidence level is assigned to each track. The four selected charged tracks are required to consist of an unambiguously identified , , and combination. Each candidate photon is required to have an energy deposit in the BSC greater than 60 MeV, to be isolated from charged tracks by more than , have an angle between the cluster development direction in the BSC and the photon emission direction less than 30∘, and have its first hit in the BSC within the first six radiation lengths. A one-constraint(1C) kinematic fit is performed with the hypothesis. For events with two isolated photons, the one that gives the smallest is selected. In order to improve the mass resolution, a 2C-kinematic fit is performed by adding a mass constraint. Events with and are retained.
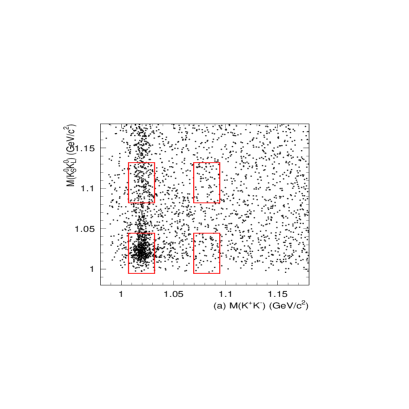


The versus invariant masses are plotted in Fig. 1 (a), where a cluster of events corresponding to production is evident. Because the processes and are forbidden by C-invariance, the presence of two ’s is a clear signal for the radiative decay . The histogram in Fig. 1 (b) shows the invariant mass distribution after the requirement that the invariant mass is inside the signal region ( GeV/). The histogram in Fig. 1 (c) shows the invariant mass distribution after the requirement that the invariant mass is inside the signal region ( GeV/). The histogram in Fig. 2 (a) shows the invariant mass distribution for events where the and invariant masses lie within the mass region ( GeV/ and GeV/). There are a total of 508 events, which survive the above-listed criteria (optimized for low masses), with a prominent structure around 2.24 GeV/. The phase space invariant mass distribution and the acceptance versus invariant mass are also shown in Fig. 2 (a) as the dashed histogram and dotted curve, respectively. The peak is also evident as a diagonal band along the upper right-hand edge of the Dalitz plot, shown in Fig. 2 (b). The asymmetry in the dalitz plot of data is caused by detection efficiency.


Non- backgrounds are studied using events in the sideband regions shown in Fig. 1 (a). Figure 3 (b) shows the invariant mass of events within the sideband region (1.069 GeV/ GeV/ and GeV/), and Fig. 3 (c) shows the corresponding spectrum of events within the sideband region ( GeV/ and 1.082 GeV/ GeV/). Figure 3 (d) shows the events in the corner region, which is defined as (1.069 GeV/ GeV/ and 1.082 GeV/ GeV/). The background, estimated by summing up the scaled event yields in Figs. 3 (b) and (c) and subtracting that in Fig. 3 (d), is shown as the dashed histogram in Fig. 3 (a). No sign of an enhancement near the mass threshold is evident in the non- background events.

The backgrounds in the selected event sample are studied with Monte Carlo simulations of a number of potential background decay channels listed in the PDG tables [17]. The main background originates from (+ c.c.). Using the PDG’s world average branching fraction for this mode, we estimate that about 40 events from this channel are in the invariant mass signal region. However, the simulation also shows that they do not peak at low masses. Using a Monte Carlo sample of 35.1M inclusive decay events generated with the LUND-charm model [18], we searched for other possible background channels. None of the simulated channels produce a peak at low invariant masses. The dotted histogram in Fig. 3 (a) shows the invariant mass distribution and the normalized background estimated with inclusive Monte Carlo samples where the events of and are removed.
4 Partial wave analysis
A partial wave analysis (PWA) of the events with 2.7 GeV/ was performed. The two-body decay amplitudes in the sequential decay process , and are constructed using the covariant helicity coupling amplitude method [19]. The intermediate resonance is described with the normal Breit-Wigner propagator , where is the invariant mass-squared and and are the resonance’s mass and width. The amplitude for the sequential decay process is the product of all decay amplitudes and the Breit-Wigner propagator. The total differential cross section is
| (1) |
where is the total amplitude for all resonances whose spin-parity are , and denotes the background contribution, which is described by a non-interfering phase space term.
The relative magnitudes and phases of the amplitudes are determined by an unbinned maximum likelihood fit. The basis of likelihood fitting is the calculation of the probability that a hypothesized probability distribution function would produce the data set under consideration. The probability to observe the event characterized by the measurement is
| (2) |
where and is the detection efficiency. The normalization integral is done with a weighted phase space MC sample; the details are described in Ref. [20]. The joint probability density for observing the events in the data sample is
| (3) |
For technical reasons, rather than maximizing , is minimized, i.e.
| (4) |
For a given data set, the second term is a constant and has no impact on the determination of the parameters of the amplitudes or on the relative changes of values. So, for the fitting, , defined as:
| (5) |
is used. The free parameters are optimized by MINUIT [21]. In the minimization procedure, a change in log likelihood of 0.5 represents a one standard deviation effect for the one parameter case.
For the production of a pseudoscalar, only waves are allowed in both the radiative decay and the hadronic decay . For the case of a scalar, both and waves are possible in both the radiative and hadronic decays; only the wave is considered in the fit. For the production of a resonance, there are five possible amplitudes for both the radiative and the hadronic decays, one wave, three waves and one wave. In this case, only and waves in both decays, corresponding to the lower overall spin of the system, are considered. (The wave is ignored in this analysis.)
When , is fitted with both the and systems in a wave, which corresponds to a pseudoscalar state, the fit gives events with mass GeV/, width GeV/, and a statistical significance larger than 10 . The errors are statistical only. Using a selection efficiency of 3.29%, which is determined from the Monte-Carlo simulation using the magnitudes and phases of the partial amplitudes from the PWA, we obtain a product branching fraction of:
Details of the fitting procedure and the detection efficiency determination can be found in Ref. [20]. Figure 4 (a) shows a comparison of the data and MC projections of the invariant mass distribution for the fitted parameters. Comparisons of the projected data and MC angular distributions for the events with invariant mass less than 2.7 GeV/ are shown in Figs. 4 (b)-(f).

We also tried to fit the resonance with and spin-parity hypotheses using all possible combinations of orbital angular momenta in the and systems. The log-likelihood values of the best fits are worse than that of the assignment by 95 and 27 for the and assignments, respectively. We therefore conclude that the of the resonance strongly favors ().
Because of the possible existence of a coherent phase space amplitude, we also fitted with an interfering phase space () term included. The log-likelihood value improves by 0.4, which suggests that the contribution from phase space is negligible.
If an additional resonance is included in the fit, the significance of the additional resonance after reoptimization is 0.8 , 2.1 and 3.3 for the , and assignments of the additional resonance, respectively. The differences between the results including and not including the additional or are included in the systematic errors; the systematic uncertainty contributions for the mass, width, and branching fraction of the are GeV/, GeV/, and , respectively.
5 Systematic error
The systematic uncertainties are estimated by considering the following: the uncertainties in the modeling of the background, different Breit-Wigner parameterizations, the possible presence of additional resonances, the simulation of the MDC wire resolution, as well as possible biases in the fitting procedure. The uncertainties in the background include the uncertainty in the treatment of the background in the fitting. We also tried to subtract the backgrounds determined from the sidebands in the fit, and the differences are taken as systematic errors. Since the enhancement is in the near-threshold region of the invariant mass spectrum, a fit using a Breit-Wigner with a momentum dependent width [22] is also performed, and the differences between the fit with a constant width Breit-Wigner are included as systematic errors. Possible fitting biases are estimated from the differences obtained between input and output masses and widths from Monte Carlo samples, which are generated as using the fitted parameters. The total systematic errors are obtained by adding the individual errors in quadrature. The total systematic errors on the mass and width are determined to be GeV/ and GeV/, respectively.
For the systematic error on the branching fraction measurement, the systematic uncertainties of the photon detection efficiency and the particle identification efficiency, as well as the and decay branching fractions, the mass and width uncertainties of , and the total number of events [23] are also included. The total relative systematic error on the product branching fraction is .
6 Summary
Using events measured in the BESII detector, we studied the radiative decay . A structure () in the near-threshold region of invariant mass spectrum is observed.
A PWA shows that the structure is dominated by a state with a mass GeV/ and a width GeV/. The product branching fraction is measured to be:
7 Acknowledgments
The BES collaboration thanks the staff of BEPC and computing center for their hard efforts. This work is supported in part by the National Natural Science Foundation of China under contracts Nos. 10491300, 10225524, 10225525, 10425523, 10625524, 10521003, the Chinese Academy of Sciences under contract No. KJ 95T-03, the 100 Talents Program of CAS under Contract Nos. U-11, U-24, U-25, and the Knowledge Innovation Project of CAS under Contract Nos. U-602, U-34 (IHEP), the National Natural Science Foundation of China under Contract No. 10225522 (Tsinghua University), and the Department of Energy under Contract No. DE-FG02-04ER41291 (U. Hawaii).
References
- [1] C. Amsler and N. A. Tornqvist, Phys. Rept. 389, 61 (2004).
- [2] E. Klempt and A. Zaitsev, Phys. Rept. 454, 1 (2007)
- [3] R. M. Baltrusaitis et al. [MARK-III Collaboration], Phys. Rev. D 33, 1222 (1986).
- [4] D. Bisello et al. [DM2 Collaboration], Phys. Rev. D 39, 701 (1989).
- [5] R. M. Baltrusaitis et al. [MARK-III Collaboration], Phys. Rev. Lett. 55, 1723 (1985).
- [6] D. Bisello et al. [DM2 Collaboration], Phys. Lett. B 192, 239 (1987).
- [7] M. Ablikim et al. [Bes Collaboration], Phys. Rev. D 73, 112007 (2006)
- [8] M. Ablikim et al. [BES Collaboration], Phys. Rev. Lett. 96, 162002 (2006)
- [9] D. V. Bugg, Phys. Rept. 397, 257 (2004)
- [10] F. E. Close and N. A. Tornqvist, J. Phys. G 28, R249 (2002)
- [11] A. Etkin et al., Phys. Lett. B 201, 568 (1988).
- [12] Z. Bai et al. [MARK-III Collaboration], Phys. Rev. Lett. 65, 1309 (1990).
- [13] D. Bisello et al. [DM2 Collaboration], Phys. Lett. B 179, 294 (1986).
- [14] D. Bisello et al. [DM2 Collaboration], Phys. Lett. B 241, 617 (1990).
- [15] J. Z. Bai et al. [BES Collaboration], Nucl. Instrum. Meth. A 458, 627 (2001).
- [16] M. Ablikim et al. [BES Collaboration], Nucl. Instrum. Meth. A 552, 344 (2005).
- [17] W. M. Yao et al. [Particle Data Group], J. Phys. G 33, 1 (2006) and references therein.
- [18] J. C. Chen, G. S. Huang, X. R. Qi, D. H. Zhang and Y. S. Zhu, Phys. Rev. D 62, 034003 (2000).
-
[19]
N. Wu and T. N. Ruan,
Commun. Theor. Phys. 35, 547 (2001).
N. Wu and T. N. Ruan, Commun. Theor. Phys. 35, 693 (2001).
N. Wu and T. N. Ruan, Commun. Theor. Phys. 37, 309 (2002). - [20] M. Ablikim et al. (BES Collaboration), Phys. Rev. D 72, 092002 (2005).
- [21] Cern Program Library Long Writeup D506
- [22] J. H. Kuhn and A. Santamaria, Z. Phys. C 48, 445 (1990).
- [23] The total number of decays in the data sample is inferred from the total number of inclusive 4-prong hadronic decays; see FANG Shuangshi et al., HEP&NP 27, 277 (2003).