Giant Dipole Resonance Width in near-Sn Nuclei at Low Temperature and High Angular Momentum
Abstract
High energy -rays in coincidence with low energy yrast -rays have been measured from 113Sb, at excitation energies of 109 and 122 MeV, formed by bombarding 20Ne on 93Nb at projectile energies of 145 and 160 MeV respectively to study the role of angular momentum (J) and temperature (T) over Giant Dipole Resonance (GDR) width (). The maximum populated angular momenta for fusion were 67 and 73 respectively for the above-mentioned beam energies. The high energy photons were detected using a Large Area Modular BaF2 Detector Array (LAMBDA) along with a 24-element multiplicity filter. After pre-equilibrium corrections, the excitation energy E∗ was averaged over the decay steps of the compound nucleus (CN). The average values of temperature, angular momentum, CN mass etc. have been calculated by the statistical model code CASCADE. Using those average values, results show the systematic increase of GDR width with T which is consistent with Kusnezov parametrization and the Thermal Shape Fluctuation Model. The rise of GDR width with temperature also supports the assumptions of adiabatic coupling in the Thermal Shape Fluctuation Model. But the GDR widths and corresponding reduced plots with J are not consistent with the theoretical model at high spins.
pacs:
24.30.Cz, 24.60.Dr, 25.70.Gh, 27.60.+jI introduction
The study of nuclear structure and dynamics under extreme conditions of internal energy and angular momentum is important in understanding the diverse properties of atomic nuclei. The measurements of high energy gamma rays emitted when isovector Giant Dipole Resonances (GDR) in highly excited nuclei are damped can provide information on the various nuclear properties at finite temperature (T) and angular momentum (J) Gaar ; Snov . Although the excited state GDR in heavy ion fusion reactions was observed in the early eighties, the study of this resonance still continues to be a very interesting and useful tool in the field of nuclear structure and dynamics Thon . The systematics of GDR width () as a function of T and J still remains a hotly debated and puzzling topic. The central issue is to understand the role of different damping mechanisms viz. collisional damping Bar and adiabatic thermal shape fluctuation Ormond ; Orm with their dependence on T and rotational frequency of the nucleus.
Till now most of the measurements of GDR cross-section built on excited states have been made with Sn and near-Sn nuclei formed by heavy ion fusion reactions. Previous measurements Bor ; Gaar ; Brac ; Hof ; Pier suggest the continuous growth of GDR width with excitation energy () up to 120-130 MeV (T 2 MeV) and attribute the same to rapid increase of spin-induced deformations and thermal shape fluctuations. As per the experimental observations, beyond the bombarding energy at which angular momentum saturates, the increase in GDR width is very small. This saturation of width is interpreted as the evidence for the onset of maximum angular momentum the nucleus can sustain without fissioning. Theoretically, the Thermal Shape Fluctuation Model (TSFM), in general, can predict the trend of the experimental data for 120-130 MeV but after that it fails to show any saturation of GDR width with increasing E∗. On the contrary, the effect of temperature on GDR width, as is revealed from the work of Kelly et al. Kelly is quite inconsistent with the saturation previously observed. Kelly et al. emphasized that at higher bombarding energies the excitation energy and temperature should be correctly redefined. Their work results in a very interesting observation that if nuclear temperature is estimated using average E∗ after proper pre-equilibrium corrections, previous results could also indicate the increase of GDR width up to T 3.5 MeV (unlike up to 2 MeV as previoulsy observed). The general trend of those experimental data agrees well with the predictions of the TSFM. In spite of that, some recent observations, in the region T 2 MeV, show that the experimental findings of GDR width are smaller than the predictions of TSFM in at least 4 different mass regions (Cu, Sn, Pb, Au) Thon ; Kus ; Bau ; Heck .
Very recently, the study of angular momentum dependence of keeping unchanged has become more controversial. Previous experimental findings agree with the fact that remains constant up to J 30-40 which is in conformity with Kusnezov parametrization of TSFM. However, at higher J values a few recent results seem to violate this parametrization. In the region T 2 MeV and with higher angular momenta, the TSFM can explain the variation of in the case of 106Sn and 176W Bracco ; Mati but fails for 86Mo to do so Rathi . The recent investigation by Chakrabarty DRC emphasizes that the average values of temperature, angular momentum and mass must be smaller than those of the initial compound nucleus considered. Interestingly, if the average values of those parameters are taken into account, Kusnezov parametrization can successfully explain the experimental data of 86Mo but it fails in the case of Sn DRC . Thus though the model of thermal shape fluctuation describes rather well, on the average, many experimental results, it fails to reproduce the data corresponding to the lowest temperatures and highest spins.
Under these circumstances, it comes out to be that plenty of experimental data are needed in the region of T 2 MeV with higher angular momenta to understand the limits of the TSFM and Kusnezov parametrization.
The present experiment revisits excited state GDR in 113Sb - a near Sn nuclide, to provide new results at higher spins (in the region of 40-60 ) in order to test the simple parametrization given by Kusnezov, which is based on, mainly, the data at low and medium spins. The values of E∗, J and mass (A) have been estimated by averaging over the decay steps of the compound nucleus. In this work an effort is made to provide the temperature of the emitting nucleus applying all the necessary corrections including that of the pre-equilibrium emission. The pre-equilibrium corrections have been done using the parametrization of Kelly et al. Kelly .
II Experimental details
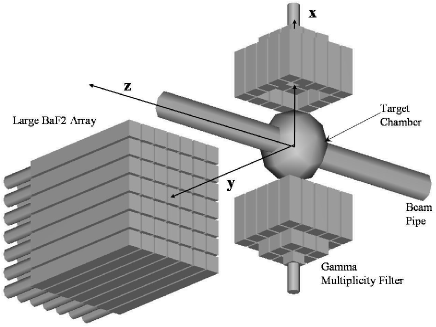
The experiment was performed at the Variable Energy Cyclotron Centre (VECC), Kolkata. A 1 mg/cm2 thick target of 99.9% pure 93Nb was bombarded with a beam of 20Ne produced by the K130 Cyclotron of VECC. Two different beam energies of 145 MeV and 160 MeV were employed forming the compound nucleus 113Sb at the excitation energies of 109 MeV and 122 MeV respectively. The maximum populated angular momenta for fusion were 67 and 73 respectively at the two bombarding energies. The inclusive high energy -rays were detected with a part of the BaF2 detector array LAMBDA Sri1 ; NIM . The array comprised of 49 detectors arranged in a 77 square matrix configuration, each detector having a length of 35 cm and a square face of 3.53.5 cm2 area. The detector array was positioned at a distance of 50 cm from the target and at an angle of w.r.t. the beam axis. The array subtended a solid angle of 0.227 sr (1.8% of 4). Lead sheets of 3 mm thickness were placed in front and sides of the array to cut down the low energy -rays and X-rays. The beam dump was heavily shielded with borated paraffin and lead bricks to decrease the neutron and -ray background. A 24-element multiplicity filter detector array was used along with the LAMBDA spectrometer to measure the multiplicity of low energy -rays in coincidence with the high energy -rays. The multiplicity detector assembly also consists of BaF2 detectors, each 3.5 3.5 5.0 cm3 in dimension, packed in two groups of 12 each and placed on the two sides of the target chamber at a distance of 10 cm from the target. The complete detection system is shown schematically in the Fig. 1.
The response of the LAMBDA spectrometer NIM was generated using the Monte Carlo Code GEANT 3.21 CERN incorporating realistic geometry of the array, the energy resolution of the detectors, experimental conditions of shielding, discriminator thresholds etc. The energy calibration of the individual detectors was done using the low energy -ray sources viz. 22Na (0.511 MeV, 1.274 MeV, and the sum peak 1.785 MeV), 60Co (Sum Peak 2.505 MeV), 241Am-9Be (4.43 MeV) and also by minimum ionising peak (23.1 MeV) of cosmic muons. The energy response of the detectors was found to be linear up to 23.1 MeV. The time resolution of individual detectors was 960 ps. The response of the -ray multiplicity detector array was also generated using GEANT 3.21 simulation code Sri . A dedicated electronics setup (consisting of multi-inputs CAMAC and NIM modules and a VME based data acquisition system capable of handling 4K events/second without appreciable dead-time loss) was used to register the energy and time from each detector in an event by event mode. An event was treated as a valid event only when the deposited energy in any detector crosses a high threshold (Th) of 4 MeV. The details of high energy gamma spectrometer LAMBDA, its response, electronics setup and event reconstruction method have already been described in S.Mukhopadhyay et al. NIM .
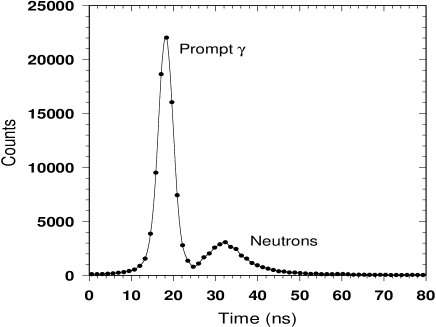
Time of Flight (TOF) technique was used to eliminate neutrons. For TOF measurements, the time reference was taken from the multiplicity detector assembly. A clear separation between the neutrons and prompt -rays was seen for all the detector elements in the experimental time spectra (Fig. 2). Pulse Shape Discrimination (PSD) method by long (2 s) – short (50 ns) integration technique was adopted to reject pile-up events. Since the detector array is highly segmented, pile-up events were very small.
In triggered data acquisition mode the probability of cosmic events is small (rejection ratio better than 1:3300) and also those events can be rejected effectively from the hit pattern utilizing the square detector geometry and high segmentation of the array.
III Experimental Data Analysis
The high energy -ray spectra were generated from the event-by-event data during offline analysis. For reconstructing the events, a nearest neighbor (cluster) summing technique was adopted. In this technique, first, the detector with highest energy deposited above a high threshold ( 4 MeV) within the array was identified and named as primary detector. For obtaining the full energy information of the incident photons, it is important to confine the secondary electromagnetic shower within the array volume as far as possible. Therefore, in the above-mentioned event reconstruction technique a checking was done to find whether the primary detector was surrounded by all its neighbors i.e., all the 8 elements (irrespective of any hits in them). The event was treated as valid, if this condition was satisfied. Otherwise, due to the possibility of losing a part of the electromagnetic shower, the event was rejected. In the case of a valid event, for the final adding back, only those detectors were considered among the 8 nearest neighbors, having an energy deposit 250 keV. The same scheme had been adopted while simulating the response of the array using GEANT. During the adding back, the hit events in the individual elements in the cluster were validated by the prompt gamma cuts in TOF spectra and long-short PSD selections. Next by gating on different coincidence folds of low energy -multiplicities in the multiplicity array the high energy -ray spectra were generated for each beam energy. The contributions due to the chance coincidence events within the prompt window in the TOF spectrum were also subtracted. Finally the spectra were Doppler corrected.
The conversion between the measured coincidence fold (the number of measured coincident -rays of low energy in each event) to the multiplicity (the number of -rays emitted in the reaction) was established using the response matrix . This response matrix was generated by making use of the GEANT, where, realistic multiplicity detector setup was considered and low energy -rays were thrown isotropically with incident multiplicity distribution P(M). It has been assumed that the multiplicity distribution following fusion reaction is given by Mati ,
P(M) = M
The maximum of multiplicity M0 and diffuseness M were obtained by fitting the equation,
where f is the measured multiplicity spectrum in the region 2 F7. Typical experimental fold distributions are shown in the Fig. 3.
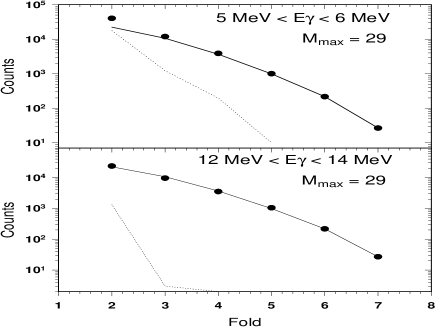
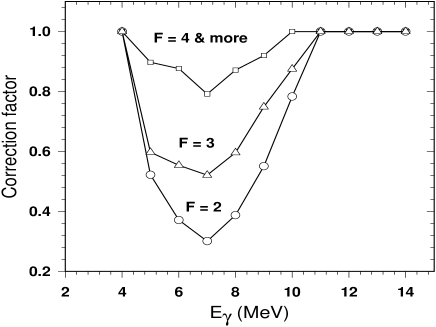
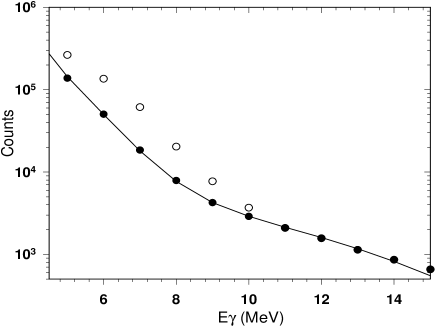
The theoretical fold distributions were found to be matching well with the experimental fold distributions for 145 and 160 MeV for 12 MeV. For 4 MeV Eγ 12 MeV, another low multiplicity component had to be added. This actually is the difference between experimentally measured and theoretically predicted fold distributions and is shown by the dotted line in the Fig. 3 . The intensity of the low multiplicity component peaks at around 7 MeV and falls on either side becoming negligible beyond 12 MeV. Its contribution was estimated for each fold from the fits of the fold distributions. The correction factors for the high energy -ray spectra were generated from the percentage contribution of the above-mentioned low multiplicity component. The correction factors are plotted in the Fig. 4 against the -ray energies corresponding to different folds for 160 MeV incident energy. The corrections decreased as a function of fold and became negligibly small for fold F 4. The high energy -ray spectra corresponding to selected folds were multiplied (in the region below 12 MeV) by the energy dependent correction factors and corrected accordingly. The Fig. 5 shows a typical high energy -ray spectrum (for fold = 2 at 160 MeV projectile energy) thus corrected (filled circles) along with the raw uncorrected one (open circles). The measured enhanced yield at low folds could be due to non-fusion events. Since the reaction studied has an asymmetry between N/Z of the target and projectile, there might be a possibility of pre-equilibrium -ray emissions as those are related to the dynamic dipole formation in the fusion entrance channel. However, since the recoiling nucleus was not directly measured it is not possible to disentangle the different effects.
From the multiplicity distributions for different folds, the angular momentum (J) distributions of the compound nucleus have been extracted and the average value of J (JCN) for the compound nucleus was calculated. The conversion from multiplicity to angular momentum was done assuming J = 2M+k, k = 4 takes into account the angular momentum removed by nonstatistical gamma rays, particle emission and gamma rays below trigger thresholds. The fitted values of parameters M, , with corresponding beam energies are shown in Table 1. The average angular momenta and the corresponding widths for different folds are shown in Table 2.
| Eproj | Mmax | M | Jmax |
|---|---|---|---|
| (MeV) | () | ||
| 145 | 28 | 3 | 60 |
| 160 | 29 | 3 | 62 |
| Eproj | fold | JCN | FWHM in J |
|---|---|---|---|
| (MeV) | () | () | () |
| 145 | 2 | 49 | 24 |
| 145 | 3 | 53 | 22 |
| 145 | 4 | 57 | 18 |
| 145 | 5 | 59 | 16 |
| 160 | 2 | 50 | 24 |
| 160 | 3 | 54 | 20 |
| 160 | 4 | 59 | 18 |
III.1 Statistical Model Analysis
The high energy -ray data collected in the experiment were sorted into 4 different classes corresponding to folds 2, 3, 4 and 5. The measured high energy spectra associated with different folds were fitted with a modified version of statistical model code CASCADE Pul along with a bremsstrahlung component. There is enough experimental evidence that at projectile energy above 6 MeV/u, contribution of pre-equilibrium particle emission becomes important and should be included in CASCADE. For calculation of proper E∗, pre-equilibrium estimates were done on the basis of the empirical formula Kelly
where is the Coulomb barrier. This parametrization based on the demonstrated scaling with (insensitive to the target-projectile combinations Tri ) have been used in this work to estimate the energy lost in pre-equilibrium emission and to correct the excitation energy ( = 57.0 MeV at r = rc = 10.35 fm). Corresponding pre-equilibrium energy loss is 5.28 MeV at = 145 MeV (5% of initial excitation energy) and 11.8 MeV at = 160 MeV (10% of initial excitation energy). The corrected excitation energy was used within CASCADE, in which Reisdorf level density prescription Reis had been used. The asymptotic level density parameter dios was taken as = A/8.0 MeV-1. In the statistical model calculation, a single lorentzian GDR strength function was assumed, having centroid energy (EGDR), strength (S), width () as parameters . In the CASCADE calculation, the moment of inertia I of the compound nucleus was taken as, where is the spherical moment of inertia. The parameters , and were kept at default values of 1.22 fm, and respectively within the CASCADE. The spin distributions for different folds of the compound nucleus deduced from the experimental multiplicity distribution were used as inputs in CASCADE. The critical angular momenta , fusion cross sections and the corresponding projectile energies are shown in Table 3.
| Ebeam | Jcr | ||
|---|---|---|---|
| (MeV) | () | (mb) | |
| 145 | 67 | 1390 | |
| 160 | 73 | 1450 |
III.2 Bremsstrahlung Contribution
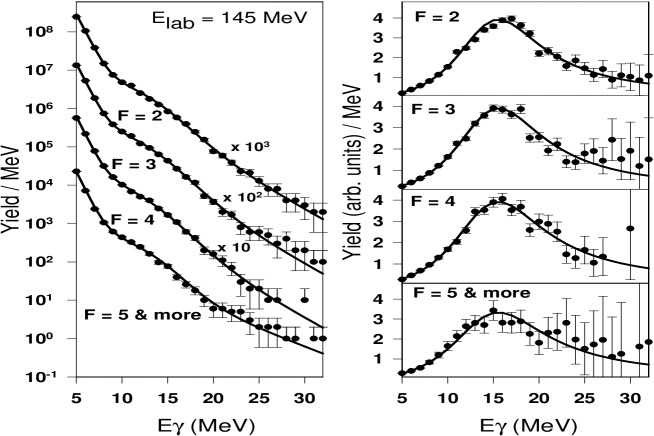
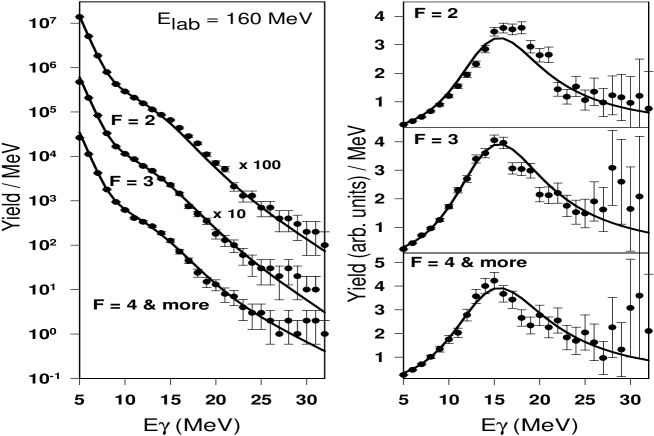
The non-statistical contributions to the experimental -ray spectra arising from bremsstrahlung processes were assumed to have an energy dependence of , where the slope parameter E0 was chosen according to bremsstrahlung systematics Nife ; Ram . The contribution was normalized to the experimental spectra at 25-30 MeV and was added to the calculated -ray spectra from CASCADE after folding with detector response. The measured -ray spectra were fitted within the region Eγ = 8-25 MeV with CASCADE using a minimisation routine. The experimental spectra fitted with CASCADE plus bremsstrahlung for different folds are shown in figures 6 and 7 for Ebeam = 145 and 160 MeV respectively . The linearized GDR plots were extracted by the transformation for Ebeam = 145 and 160 MeV and shown in figures 6 and 7 respectively, where, is the experimental spectrum and is the prediction from CASCADE folded with the detector response. f(Eγ) is the GDR strength function and is given by,
The values of GDR parameters are shown in Table 4.
| Ebeam | Fold | Strength | EGDR | E0 | |
|---|---|---|---|---|---|
| (MeV) | (F) | (SGDR) | (MeV) | (MeV) | (MeV) |
| 145 | 2 | 1.01 0.01 | 15.55 0.10 | 11.5 0.25 | 3.0 |
| 145 | 3 | 0.98 0.02 | 15.55 0.10 | 11.8 0.25 | 3.0 |
| 145 | 4 | 0.99 0.01 | 15.55 0.12 | 12.4 0.25 | 3.0 |
| 145 | 5 | 0.98 0.02 | 15.55 0.12 | 12.8 0.25 | 3.0 |
| 160 | 2 | 0.98 0.02 | 15.55 0.12 | 11.9 0.25 | 3.5 |
| 160 | 3 | 0.98 0.02 | 15.55 0.12 | 12.5 0.25 | 3.5 |
| 160 | 4 | 0.98 0.02 | 15.55 0.12 | 13.0 0.25 | 3.5 |
III.3 Temperature Estimation
At high excitation energy the compound nucleus decays through a large number of decaying steps, and hence the mass (A), charge (Z), excitation energy (E∗) and angular momentum (J) of the compound nucleus should be averaged over all the decay steps. The average values of E∗, J, A, Z should be different and less than those of the initial compound nucleus. While estimating the average temperature, in accordance with the prescription adopted by Wieland et al. Wieland , a lower limit in excitation energy during the CN decay process was employed in the statistical model calculation. This cut in E∗ affects the low energy part of the high energy -spectra, without affecting the region of our interest = 12-25 MeV. The average values of mass, atomic number, pre-equilibrium corrected excitation energy and angular momentum were calculated using the above-mentioned E∗ limit. Within this E∗ limit, the estimated average values correspond to approximately 50% of the total high energy -ray yield ( = 12-25 MeV) in CN decay chain. The average temperature was estimated from by using the relation,
where is the average of the excitation energy after pre-equilibrium subtraction weighed over the daughter nuclei for the -emission in the GDR region from = 12-25 MeV:
is the excitation energy of ith nuclei in the decay steps and is the yield in the region = 12-25 MeV. Erot is the energy bound in the rotation computed at the average J calculated within the CASCADE corresponding to analysed fold Kim ; ger . EGDR is the centroid energy of the GDR, given by 15.55 MeV and is the pairing energy. The details of the parameters for different beam energies calculated by CASCADE for this experiment are shown in Table 5.
| Ebeam | JCN | Jmean | Tmean |
|---|---|---|---|
| (MeV) | () | () | (MeV) |
| 145 | 49.0 | 41.0 | 1.94 |
| 145 | 53.2 | 48.0 | 1.87 |
| 145 | 56.7 | 50.0 | 1.81 |
| 145 | 59.5 | 54.0 | 1.72 |
| 160 | 50.0 | 44.0 | 1.98 |
| 160 | 54.3 | 47.0 | 1.90 |
| 160 | 58.7 | 53.0 | 1.86 |
IV Experimental Results
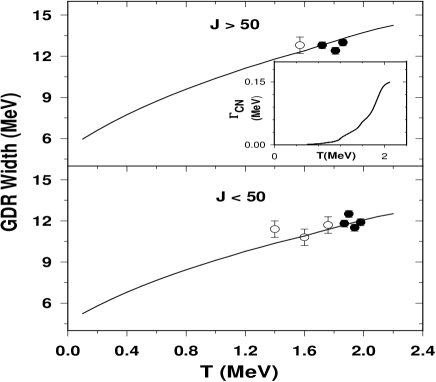
The GDR widths (T, J, A) measured in this work are plotted against average values of T. These are shown as filled circles in the top panel of the Fig. 8 for angular momenta greater than or equal to 50 and in the bottom panel for angular momenta less than 50 . The TSFM predictions using Kusnezov parametrization for J 50 and J 50 are also represented by solid lines in the top and the bottom panels. The average mass in this case is 111. TSFM calculation (indicated by solid line) includes the average compound nucleus particle decay width calculated with an asymptotic level density parameter = A/8.0 MeV-1 . The graph in the inset of the Fig. 8 shows the average compound nucleus particle decay width plotted against temperature. In this E∗ range, the has small magnitude and grows with increase in T. The inclusion of improves the fitting in Fig 8 marginally.
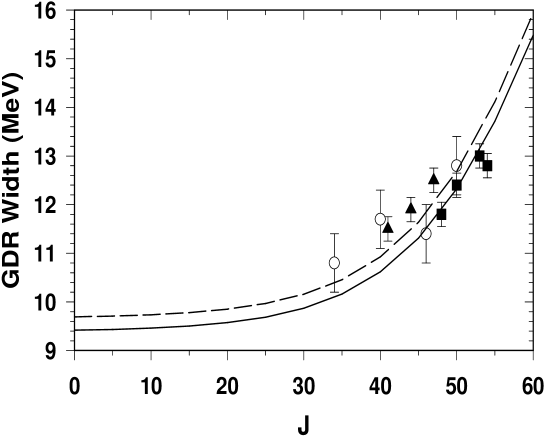
There exist an earlier measurement of the GDR width from 109,110Sn at similar temperature and angular momentum by Bracco et al. Bracco . A reasonable agreement between those sets of data and predictions by Kusnezov parametrization has been shown in Thon . But recently by employing a new scheme of analysis a large mismatch between the data and the prediction has been seen DRC . The average values of T and J have been estimated for this data set also following the approach adopted in this work and is compared with the corresponding TSFM predictions. The results are shown in Figs. 8, 9 & 10 as open circles (see Table 6 for details of the parameters). While the temperature dependence is well-described by the TSFM calculation, the dependence of GDR width on J is under-predicted as shown in the Fig. 9 (for some points it is more than the error bar).
In Tables 5 and 6 the errors in T indicate the average temperature ranges associated to 80 (lower value) and 20 (upper value) of the total high energy -yield in CN decay chain.
The averaging scheme followed in this work, considers only the high energy -rays which really influence the GDR width in the CN decay chain and neglects the remaining -decay cascade. In this low E∗ region, the average values of T do not differ too much with the initial CN values primarily due to the emission of GDR -rays in the first few steps of the CN decay cascade. As GDR decay is an average process, the averaging of E∗, T, A and J is important in the CN decay chain. The change of the value of A after averaging from that of the CN is not expected to make a significant change in the conclusion. But the same is not true for J. Even a change in J by a few units, by the averaging, can indeed alter the reduced width measurements.
The GDR widths measured in this work are also plotted against the average values of J’s along with the theoretical predictions for T = 1.85 MeV and 2.0 MeV (solid and dashed lines respectively in the Fig. 9). The data points represented by solid squares and triangles are for T 1.85 MeV and 1.85 T 2.0 MeV respectively. They are agreeing well with Kusnezov parametrization. If the CN decay widths are considered (not shown in the figure), the matching improves marginally.
| Ebeam | JCN | Jmean | Tmean | EGDR | FWHM in J | |
|---|---|---|---|---|---|---|
| (MeV) | () | () | (MeV) | (MeV) | (MeV) | () |
| 223 | 44.0 | 40.0 | 1.76 | 15.0 0.5 | 11.7 0.6 | 16 |
| 223 | 54.0 | 50.0 | 1.57 | 14.7 0.5 | 12.8 0.6 | 14 |
| 203 | 40.0 | 34.0 | 1.60 | 15.7 0.5 | 10.8 0.6 | 18 |
| 203 | 49.0 | 46.0 | 1.40 | 15.6 0.5 | 11.4 0.6 | 16 |
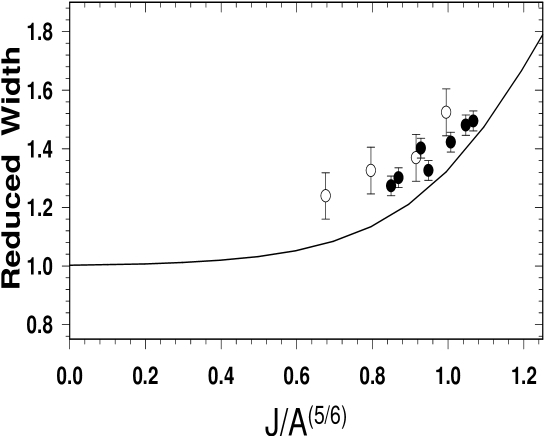
In the Fig. 10, reduced GDR widths are plotted for this experiment as well as for the other set of existing data. The solid line corresponds to the global phenomenological free energy surface calculation shown in Kus at T = 1.8 MeV within the TSFM. Reduced GDR widths for this experiment are shown in the figure by filled circles and the data for Bracco et al. are shown by open circles. Those reduced GDR widths are calculated using the parametrization,
and plotted against , where T0 = 1 MeV and ground state GDR width = 3.8 MeV. Although the simple parametrization proposed by Kusnezov reproduces reasonably well the trend of the experimental findings as a function of spin, it would be interesting to see whether the more detailed calculation with the Thermal Shape Fluctuation Model for specific nuclei can improve further the agreement with the data in reduced width plot for higher spins.
V Summary and Conclusion
The GDR width built on excited states of 113Sb has been studied in the interval J = 40-60 and at a temperature ranging from T = 1.7-2.0 MeV using a part of the LAMBDA array. To decouple the effect of T and J from each other on GDR width, multiplicity detector assembly has been used. The angular momentum information was obtained from the low energy -multiplicity filter. Pre-equilibrium corrections on the excitation energies were performed. The temperature has been found from the average values of corrected excitation energy and angular momentum which provided a more stringent test for the existing TSFM for explaining the systematics of GDR width. Another set of existing data from earlier measurement of GDR width of Sn nuclei have been used for comparison. In spite of the fact that the simple parametrization of Kusnezov describes the trend well, there remains a scope of detail TSFM calculation for further improvement in the parametrization of GDR width with J. Keeping J constant, the increase of with T, for T 2.0 MeV, is well understood by TSFM although the matching improves to some extent by the addition of CN decay width. So for a complete understanding of thermal shape fluctuation and parametrization of GDR width, more experiments in this mass range are needed. Also in the higher temperature region it is important to find out the detail pre-equilibrium energy loss involved.
Acknowledgements.
The authors wish to thank I.Dioszegi and D.Hoffman for their help and suggestion regarding the modification of CASCADE.References
- (1) J.J.Gaardhoje, Annu. Rev. Nucl. Part. Sci, 42, 483 (1992).
- (2) K.Snover, Annu. Rev. Nucl. Part. Sci, 36, 545 (1986).
- (3) M.Thoennessen, Nucl. Phys. A731, 131 (2004).
- (4) V.Baran et al., Nucl. Phys. A599, 29c (1996).
- (5) W.E.Ormand et al., Nucl. Phys. A614, 217 (1997).
- (6) W.E.Ormand et al., Phys. Rev. Lett, 77, 607 (1996).
- (7) P.F.Bortignon et al., Giant Resonances Nuclear Structure at Finite Temperature, Harwood Academic Pub.
- (8) A.Bracco et al., Phys. Rev. Lett, 62, 2080 (1989).
- (9) H.J.Hofman et al., Nucl. Phys. A571, 301 (1994).
- (10) D.Pierroutsakou et al., Nucl. Phys. A600, 131 (1996).
- (11) M.P.Kelly et al., Nucl. Phys. A649, 123c (1999).
- (12) D. Kusnezov et al., Phys. Rev. Lett, 81, 542 (1998).
- (13) T. Baumann et al., Nucl. Phys. A635, 428 (1998).
- (14) P. Heckman et al., Phys. Lett B555, 43 (2003).
- (15) A.Bracco et al., Phys. Rev. Lett, 74, 3748 (1995).
- (16) M.Matiuzzi et al., Nucl. Phys. A 612, 262 (1997).
- (17) S.K.Rathi et al., Phys. Rev. C67, 024603 (2003).
- (18) D.R.Chakrabarty et al., Phys. Rev. C74, 017601 (2006).
- (19) Srijit Bhattacharya et al., Proc. I.N.P.C, Tokyo, 2007.
- (20) S. Mukhopadhyay et al., Nucl. Instr. Meth. A 582, 603 (2007).
- (21) R. Brun et al., GEANT3 CERN-DD/EE/84-1, 1986.
- (22) Srijit Bhattacharya et al., Proc. DAE-BRNS Symposium, Banaras, 2004.
- (23) F.Puhlhoffer et al., Nucl. Phys. A 280, 267 (1967).
- (24) H.Tricoire et al., Z. Phys. A 306, 127 (1982).
- (25) W.Reisdorf et al., Z. Phys. A 300, 227 (1981).
- (26) I.Dioszegi et al., Phys. Rev. C61, 024613 (2000).
- (27) H. Nifenecker et al., Annu. Rev. Nucl. Part. Sci, 40, 113 (1990).
- (28) Ramakrishnan et al., Phys. Rev. Lett, 76, 2025 (1996).
- (29) Wieland et al., Phys. Rev. Lett, 97, 012501 (2006).
- (30) M.Kmiecik et al., Nucl. Phys. A674, 29 (2000).
- (31) G.Gervais et al., Nucl. Phys. A649, 173c (1999).