Empirical shape function of limit-order books in the Chinese stock market
Abstract
We have analyzed the statistical probabilities of limit-order book (LOB) shape through building the book using the ultra-high-frequency data from 23 liquid stocks traded on the Shenzhen Stock Exchange in 2003. We find that the averaged LOB shape has a maximum away from the same best price for both buy and sell LOBs. The LOB shape function has nice exponential form in the right tail. The buy LOB is found to be abnormally thicker for the price levels close to the same best although there are much more sell orders on the book. We also find that the LOB shape functions for both buy and sell sides have periodic peaks with a period of five. The 1-min averaged volumes at fixed tick level follow lognormal distributions, except for the left tails which display power-law behaviors, and exhibit long memory. Academic implications of our empirical results are also discussed briefly.
keywords:
Econophysics; Stock markets; Continuous double action; Limit-order book shape; Microstructure theoryPACS:
89.65.Gh, 02.50.-r, 89.90.+n, ,
1 Introduction
In an order-driven market, limit-order book (LOB) is a queue of orders waiting to be executed and it is the base of continuous double auction mechanism. Orders in the book are sorted according to price-time priority. The construction of LOB is a dynamic process. Effective limit orders whose prices do not penetrate the opposite best price are stored in the book, while an effective market order with the price penetrating the opposite best immediately causes a transaction and removes the corresponding orders in the opposite book. In addition, cancelations can also remove the orders in the LOB.
The price levels in the limit-order book are discrete. The difference between two adjacent price levels is the tick size . It is 0.01 RMB for all stocks in the Chinese market. The price level at any given time can be defined as follows
| (1) |
where is an allowed price in the LOB and and are the best bid and best ask, respectively. According to the definition, stands for the position at the best bid (ask) in the buy (sell) LOB. Denote (respectively ) as the volume at level in the buy (respectively sell) LOB at event time . and can be viewed as the instant LOB shape functions on the buy and sell sides, respectively.
The LOB shape function is of crucial importance in the research of market microstructure theory of order-driven markets. A brief discussion is in order. The shape of the LOB affects a trader’s strategy and thus influences order aggressiveness Ranaldo-2004-JFinM . Second, the LOB shape determines the virtual price impact. The price impact of a virtual market order of size can be determined as follows Challet-Stinchcombe-2001-PA , Maslov-Mills-2001-PA , Weber-Rosenow-2005-QF
| (2) |
It is found that the virtual price impact is much stronger than the actual impact Weber-Rosenow-2005-QF and large price fluctuations are not necessarily caused by large orders but rather the liquidity Farmer-Gillemot-Lillo-Mike-Sen-2004-QF , Weber-Rosenow-2006-QF . It is rational that a large trader prefers to split his large order and submit when the opposite LOB is thick such that the price does not change much. In contrast, an impatient small trader might submit an small order when the opposite LOB is thin for small ’s, since usually he does not have ensuing orders. The optimal trading strategy of a large order also depends on the average LOB shape Obizhaeva-Wang-2008-JFinM , Alfonsi-Schied-Schulz-2007-xxx , which could be improved if one considers the instant LOB shape function rather than the average.
When we want to investigate the aforementioned topics analytically, the LOB shape function is usually treated as continuous. In the derivation of an optimal execution strategy, many unrealistic LOB shape functions have been proposed Obizhaeva-Wang-2008-JFinM , Alfonsi-Schied-Schulz-2007-xxx . This makes the framework less useful in practice and calls for a realistic shape function. Indeed, the empirical LOB shape function has been investigated in different stock markets. Bouchaud et al. found that the LOB shape of individual liquid stocks on the Paris Bourse (February 2001) is symmetrical for buys and sells and has a maximum away from the current bid (ask) Bouchaud-Mezard-Potters-2002-QF . They also found that the distribution of order size at the bid (or ask) can be fitted by a gamma distribution Bouchaud-Mezard-Potters-2002-QF . Potters and Bouchaud investigated three stocks traded on the Nasdaq Stock Market and found that all the LOB shape functions are buy/sell symmetric and only one stock reaches a maximum before relaxation Potters-Bouchaud-2003-PA . Similar results on the shape function are also reported using other market data Challet-Stinchcombe-2001-PA , Maslov-Mills-2001-PA , Weber-Rosenow-2005-QF , Eisler-Kertesz-Lillo-2007-PSPIE .
In this paper, we shall study in detail the LOB shape of 23 liquid stocks traded on the Shenzhen Stock Exchange (SZSE) in China. The rest of the paper is organized as follows. In Section 2, we describe briefly the database we adopt. Section 3 introduces the average shape of buy and sell LOBs. We then discuss in Section 4 the probability distributions and time dependency of volumes at the first three best. The last section concludes.
2 Data sets
The Chinese stock market is a pure order-driven market where orders are matched resulting in transactions. Our data contain ultra-high-frequency data of 23 liquid stocks listed on the Shenzhen Stock Exchange in 2003 Gu-Chen-Zhou-2008a-PA . We find that the results for different stocks are qualitatively similar. Hence we will present the results for a very liquid stock. In 2003, only limit orders were allowed to submit and the market constituted opening call auction, cooling period and continuous double auction. We focus on the LOB in continuous double auction.
As an example, our presentation is based on the order flow data for a stock named Shenzhen Development Bank Co., LTD (code 000001), whose time stamps are accurate to 0.01 second including details of every event, with the information containing date, order size, limit price, time, best bid, best ask, transaction volume, and aggressiveness identifier (which identifies whether a record is a buy order, a sell order, or a cancelation). The database totally records events, including buy orders, sell orders, cancelations and invalid orders. Using this nice database, we rebuild the LOB according to the trading rules Gu-Chen-Zhou-2007-EPJB and study the statistical probabilities of LOB shape.
3 Averaged shape
In the continuous double auction mechanism, order placement adds volume to the book, while order cancelation or transaction removes volume from the book. It is clear that these three types of events (order placement, order cancelation and transaction) can change the shape of the LOB. In what follows we use event time, not clock time. In this way, the event time advances by 1 when an event occurs. At every time , we have an instant LOB shape on each side (buy or sell). The averaged shape of the buy (sell) LOB can be calculated as follows
| (3) |
where is the number of total events in 2003 for the stock we analyzed.
It is known that traders tend to place their orders on the same best price Bouchaud-Mezard-Potters-2002-QF , Potters-Bouchaud-2003-PA , Maskawa-2007-PA , Mike-Farmer-2008-JEDC , Gu-Chen-Zhou-2007-xxx . On the other hand, the orders placed near the same best have a higher execution probability, and impatient traders are likely to make a cancelation when these orders are not executed immediately. It is thus not clear what is the LOB shape under these opposite forces. Fig. 1 shows the shapes of buy and sell LOBs.
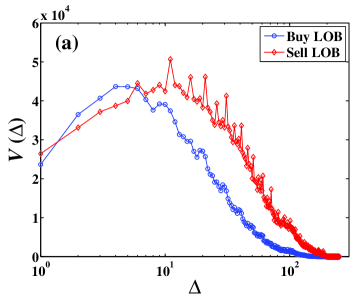
In Fig. 1(a), we in general find that the LOB shape function has a maximum away from the same best () and is roughly symmetrical to the maximum, which consists with the result of Bouchaud et al. Bouchaud-Mezard-Potters-2002-QF . The LOB shapes are asymmetric between buy orders and sell orders. The LOB shape increases when and decreases afterwards, where for buys and for sells. We note that only two (000088 and 000539) of the 23 stocks do not have clear maxima and the values of vary from stock to stock. In addition, the total volume of sell orders is greater than that of buy orders, which is especially visible for large . This phenomenon is also observed for other stocks except that two stocks (000088 and 000089) have comparable buy and sell volumes, which is consistent with the fact that the Chinese stock market in 2003 was in the middle of a long-lasting bearish antibubble from 2001 to 2005 Zhou-Sornette-2004a-PA and more market participators tended to sell their shares.
There are two more features arise in the empirical LOB shape function. Although there are more sell limit orders in the book, the buy LOB is still thinker than sell LOB for small in Fig. 1(a). In 2003, only the information on the first three visible levels (, , and such that the instant LOB shape function , and for other relative distances less than ) were disposed to traders. We find that, 10 stocks have thicker sell books, 10 stocks have thicker buy books, and the other three have comparable book thickness. This observation is very interesting since the traders faced a very strong illusionary signal that there were more buy orders while the market was bearish. Another interesting feature is the presence of periodic peaks at for , which are observed in all 23 stocks. The periodic peaks are higher for sell orders than buy orders. The underlying mechanism of this universal behavior is unclear, which might be related to the trading strategy of larger traders or people’s irrational preference of some numbers like 5, 10 or their multiples Dorogovtsev-Mendes-Oliveira-2006-PA . These two features call for further investigation, which is however beyond the scope of this work.
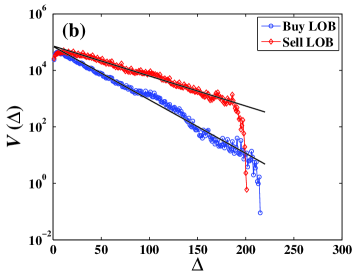
In Fig. 1(b), we show the shape functions in linear-log coordinates to study the functional form for large . The volumes in both buy and sell LOBs decrease exponentially,
| (4) |
Using least-squares fitting method, we obtain that for buy LOB and for sell LOB. The decreasing speed of buy LOB is faster than that of sell LOB, which means that there is a larger proportion of more aggressive orders in the buy LOB than in the sell LOB. It seems that buyers pay more attention to the execution probability, while sellers consider the return of their investigation more important. We notice that most of other stocks have similar exponentially decreasing shapes. In contrast, Bouchaud et al. have found that the LOB shape tails have power-law behaviors for the three liquid stocks traded on the Paris Bourse Bouchaud-Mezard-Potters-2002-QF . In addition, abruptly plummet to zero at the tail ends, which is caused by the 10% price fluctuation limitation compared to the close price on the previous trading day.
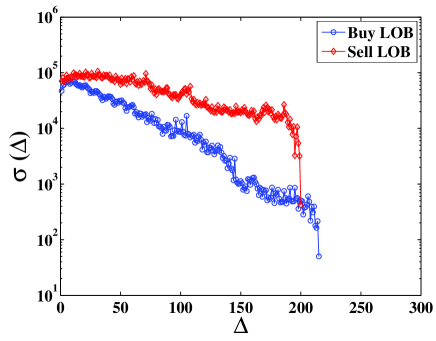
We have studied the event-time averaged volume placed at each tick levels in the LOB. However, the volume may have large fluctuations and greatly deviate from the mean. It is necessary to analyze the fluctuations of volumes at each tick levels. Here, we study the standard deviation as a function of the relative distance , that is,
| (5) |
The standard deviations for buy and sell LOBs are presented in Fig. 2. We find that the functional form of is very similar to that of the shape for both buy and sell LOBs. The standard deviation increases with at the first few levels and then decreases exponentially. When comparing the buy and LOBs, the sell LOB is found to be thicker with larger fluctuations.
4 Statistical properties of volumes at individual tick levels
4.1 Probability distribution
We have analyzed the averaged volume above. Here we focus on the time averaged volume over a fixed clock time interval at individual levels
| (6) |
where is the time moments of the events occur in the interval and is a function of and . We use min to calculate the time-averaged volume at each price level.
Fig. 3 shows the probability density functions (PDFs) for , 2, and 3. In Fig. 3 (a), we find that in general is normally distributed
| (7) |
that is, is log-normally distributed with the PDF being111Denote and the PDFs of and , respectively. If is a function of , we have . It follows immediately that .
| (8) |
This is also different from the Paris Bourse stocks where the volumes on the best are distributed according to a Gamma distribution Bouchaud-Mezard-Potters-2002-QF . With the increase of the relative distance , the mean of , , increases, which is line with the result in Fig. 1. We can also project that decreases for large . More generally, we find that the 1-min volumes at other tick levels for different stocks are basically lognormally distributed.
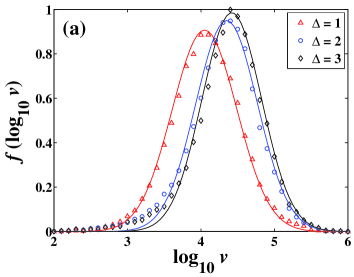
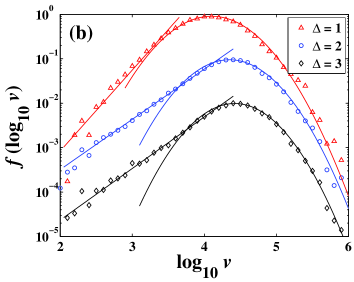
When is small, we find that the empirical curves deviate from the lognormal distribution . We plot the probability density functions of in a linear-log scale, which is presented in Fig. 3 (b). It is clear that the small volumes deviate from the corresponding lognormal distributions and exhibit power-law behaviors
| (9) |
Using least-squares fitting, we obtain that () for , () for , and () for .
4.2 Long memory
Temporal dependency can be quantitatively assessed by the autocorrelation function , which describes the average correlation between two points with time lag . Many processes have the autocorrelation function decaying exponentially ( for ), which means these processes exhibit short memory with a characteristic timescale . On the other hand, when the autocorrelation function is not integrable, for example, decaying as a power-law behavior (), the process has long memory without any characteristic timescale, which means that the values in the past have potential predictive power for the future.
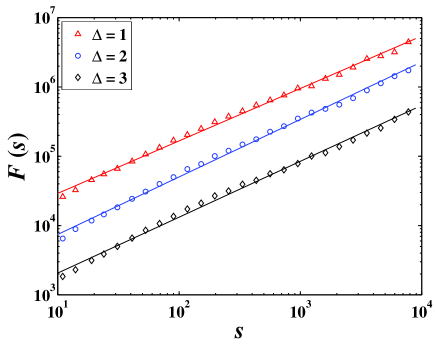
The property of temporal dependency is equivalently characterized by the Hurst index , and the relationship between the autocorrelation exponent (assuming ) and the Hurst index can be expressed by Kantelhardt-Bunde-Rego-Havlin-Bunde-2001-PA , Maraun-Rust-Timmer-2004-NPG . Detrended fluctuation analysis (DFA) is a popular method to estimate the Hurst index Peng-Buldyrev-Havlin-Simons-Stanley-Goldberger-1994-PRE , Hu-Ivanov-Chen-Carpena-Stanley-2001-PRE , Kantelhardt-Bunde-Rego-Havlin-Bunde-2001-PA . We perform DFA on the 1-min averaged volumes at the first three tick levels on the buy LOB. The detrended fluctuation functions are presented in Fig. 4. Sound power-law relations are observed in the three curves and the Hurst indexes are for , for , and for , respectively. With the Hurst indexes significantly larger than 0.5, we argue that the 1-min averaged volumes at the first three tick levels exhibit long memory. Quantitatively similar results are observed for the sell LOB and for other stocks. This agrees well with the fact that order signs have long memory Bouchaud-Gefen-Potters-Wyart-2004-QF , Lillo-Farmer-2004-SNDE .
5 Conclusion
We have investigated the limit-order book shapes of 23 stocks traded on the Shenzhen Stock Exchange in the whole year 2003. For brevity, we presented the results of a very liquid stock (Shenzhen Development Bank Co., LTD, 000001). For most of the stocks, the averaged shape has a maximum away from the same best and the volumes in the LOBs decrease exponentially. The LOB shapes are asymmetric between buy and sell orders and the sell LOB shape relaxes much slower. The probability density functions of 1-min averaged volumes at the first three tick levels follow lognormal distributions with a power-law behavior for small volumes in the left tails. Using detrended fluctuation analysis, we confirmed that the 1-min averaged volumes at a fixed tick level on the LOB exhibit long memory. When compared with the Paris Bourse stocks Bouchaud-Mezard-Potters-2002-QF , we find that the LOB shapes are qualitative similar but quantitatively different.
Several problems arise that need to be addressed: why the buy LOB is abnormally thicker for the price levels close to the same best and why there are relatively large volume on the tick levels of ? It is also noteworthy that our results on the empirical LOB shape functions can be used to develop more realistic optimal trading strategy for large traders.
Acknowledgments:
This work was partly supported by the National Natural Science Foundation of China (Grant Nos. 70501011 and 70502007), the Fok Ying Tong Education Foundation (Grant No. 101086), and the Program for New Century Excellent Talents in University (Grant No. NCET-07-0288).
References
- [1] A. Ranaldo, Order aggressiveness in limit order book markets, J. Fin. Markets 7 (2004) 53–74.
- [2] D. Challet, R. Stinchcombe, Analyzing and modeling 1 + 1d markets, Physica A 300 (2001) 285–299.
- [3] S. Maslov, M. Mills, Price fluctuations from the order book perspective - Empirical facts and a simple model, Physica A 299 (2001) 234–246.
- [4] P. Weber, B. Rosenow, Order book approach to price impact, Quant. Finance 5 (2005) 357–364.
- [5] J. D. Farmer, L. Gillemot, F. Lillo, S. Mike, A. Sen, What really causes large price changes?, Quant. Finance 4 (2004) 383–397.
- [6] P. Weber, B. Rosenow, Large stock price changes: Volume or liquidity, Quant. Finance 6 (2006) 7–14.
- [7] A. Obizhaeva, J. Wang, Optimal trading strategy and supply/demand dynamics, J. Fin. Markets XX (2008) in press.
- [8] A. Alfonsi, A. Schied, A. Schulz, Optimal execution strategies in limit order books with general shape functions, arXiv:0708.1756v2 (2007).
- [9] J.-P. Bouchaud, M. Mézard, M. Potters, Statistical properties of stock order books: empirical results and models, Quant. Finance 2 (2002) 251–256.
- [10] M. Potters, J.-P. Bouchaud, More statistical properties of order books and price impact, Physica A 324 (2003) 133–140.
- [11] Z. Eisler, J. Kertész, F. Lillo, The limit order book on different time scales, in: J. Kertész, S. Bornholdt, R. N. Mantegna (Eds.), Proc. SPIE, Vol. 6601, AIP, Florence, Italy, 2007, p. 66010G.
- [12] G.-F. Gu, W. Chen, W.-X. Zhou, Empirical distributions of Chinese stock returns at different microscopic timescales, Physica A 387 (2008) 495–502.
- [13] G.-F. Gu, W. Chen, W.-X. Zhou, Quantifying bid-ask spreads in the Chinese stock market using limit-order book data: Intraday pattern, probability distribution, long memory, and multifractal nature, Eur. Phys. J. B 57 (2007) 81–87.
- [14] J.-I. Maskawa, Correlation of coming limit price with order book in stock markets, Physica A 383 (2007) 90–95.
- [15] S. Mike, J. D. Farmer, An empirical behavioral model of liquidity and volatility, J. Econ. Dyn. Control 32 (2008) 200–234.
- [16] G.-F. Gu, W. Chen, W.-X. Zhou, Empirical regularities of order placement in the Chinese stock market, arXiv: 0712.0912 (December 2007).
- [17] W.-X. Zhou, D. Sornette, Antibubble and prediction of China’s stock market and real-estate, Physica A 337 (2004) 243–268.
- [18] S. N. Dorogovtsev, J. F. F. Mendes, J. G. Oliveira, Frequency of occurrence of numbers in the World Wide Web, Physica A 360 (2006) 548–556.
- [19] J. W. Kantelhardt, E. Koscielny-Bunde, H. H. A. Rego, S. Havlin, A. Bunde, Detecting long-range correlations with detrended fluctuation analysis, Physica A 295 (2001) 441–454.
- [20] D. Maraun, H. W. Rust, J. Timmer, Tempting long-memory - on the interpretation of DFA results, Nonlin. Processes Geophys. 11 (2004) 495–503.
- [21] C.-K. Peng, S. V. Buldyrev, S. Havlin, M. Simons, H. E. Stanley, A. L. Goldberger, Mosaic organization of DNA nucleotides, Phys. Rev. E 49 (1994) 1685–1689.
- [22] K. Hu, P. C. Ivanov, Z. Chen, P. Carpena, H. E. Stanley, Effect of trends on detrended fluctuation analysis, Phys. Rev. E 64 (2001) 011114.
- [23] J.-P. Bouchaud, Y. Gefen, M. Potters, M. Wyart, Fluctuations and response in financial markets: The subtle nature of ‘random’ price changes, Quant. Finance 4 (2004) 176–190.
- [24] F. Lillo, J. D. Farmer, The long memory of the efficient market, Stud. Nonlin. Dyn. Econometr. 8 (3) (2004) 1–33.