Scalar mesons from heavy flavor decays
Abstract
In the past few years the B-factories became unexpected players in the scalar mesons business: in order to access the CP violation effects, it is necessary to handle the dynamics of the strong interaction between the final state hadrons. A number of large statistics studies heavy flavor decays involving a scalar component have been performed recently by Belle and BaBar, who have joined CLEOc, BES, E791 and FOCUS in the effort to understand the physics of the scalar mesons. In this talk, the most recent results from these experiments will be reviewed, with emphasis on the low energy system and on the f0(1370).
1 Introduction
The identification of the scalar mesons is a long standing problem. There are too many candidates with mass bellow 2 GeV/c2, although some states, like the and the , are still controversial. In addition to the regular mesons, the observed spectrum may contain other types of states, like glueballs, hybrids, tetraquarks or molecules.
There are difficulties from both experimental and theoretical points of view. Scalars are, in general, broad overlapping states. Since there is no spin, they decay isotropically. In scattering experiments the production rates for low mass states, like the and , are suppressed by the Adler zeroes. At higher masses, disentangling the broad, spinless states, like the , from the smooth background is complicated by the interference with other scalars and with the continuum, which distorts the line shapes.
The precise determination of pole positions and couplings to specific modes of all existing scalar particles is an essential step towards the identification of the genuine states. Such an ambitious task could not be accomplished by one single type of experiment. One has to look at the scalars problem from all possible perspectives, exploring the different constraints imposed by different reactions.
In the past six or seven years there has been lots of new results on scalar mesons from heavy flavor (HF) decays to light quarks (LQ), exploring the unique features of these processes. In this paper we will focus on two crucial problems: the nature of the meson and the existence of the . More specifically, we will present the latest results from lepton and three-body decays of and mesons to light hadrons.
The paper is organized as follows. In Section 1 we discuss why HF decays are a very useful tool for the study of scalar mesons. We will also discuss some aspects of the basic analysis techniques in HF decays. In Section 2 we discuss the situation of the low mass spectrum. In Section 3 we discuss the issue of the , in the light of hadronic and decays. The last Section contains a summary and conclusions.
2 Heavy flavor to light quarks
There are unique features that make decays of and mesons to light hadrons very suitable for the study of scalar mesons. These particles are copiously produced in and decays, especially when there is a pair of identical particles in the final state. The B-factories already have very large charm samples, with a high degree of purity. Soon there will be also large samples of decays () from the LHC experiments. With these high quality data, the and spectra can be accessed continuously, starting from threshold, and covering the entire elastic range.
Another appealing feature, especially in decays, is the close connection between the quark content of the initial state and the observed resonances. In the decay of a meson the weak decay of the quark is embedded in a strongly interacting system that leads to the final state hadrons. However, if one goes through the PDG listing, one realizes that, in spite of the complexity of the decay, nearly the entire hadronic and semileptonic rates can be described by a rather simple scheme, in terms of tree-level valence quark diagrams, and the regular mesons from the Constituent Quark Model. The dominant amplitudes in decays are the external (spectator) and internal radiation. The ’final state valence quarks’ result from transition plus the ’spectator’ . These quarks define the possible intermediate states. This simple picture works very well for intermediate states having either a vector, an axial-vector or a tensor resonance. If one excludes the scalar mesons, in decays there is nothing else than the members of the usual nonets of the Constituent Quark Model. In other words, decays can be seen as a ’ filter’: if a resonance is observed in decays, then it is very likely to be a meson. One can expect that this holds also for the scalar resonances, so decays would also provide clues about the nature of these mesons.
Semileptonic decays of the type , and hadronic decays of the lepton, , provide a particularly clean environment for the study of the scalar mesons, since there is no strong interaction between the pair and the leptons. However, the system is dominantly in P-wave in both cases. The S-wave contribution is typically less than 10%, so very large samples are required. An additional difficulty is the fact that the neutrinos are not reconstructed, so the background level in these decays is relatively large.
Hadronic decays of mesons, on the other hand, are much easier to be reconstructed. In some final states the S-wave component is largely dominant, like in the and in the decays. Background levels are typically of the order of a few percent. The problem here is how to disentangle the desired information. The final states are strongly interacting three-body systems, with a complex and unknown production dynamics. The pure is certainly the main ingredient, but there is no direct route to extract it in a model independent way. Approximations, and, therefore, interpretation of the results, are unavoidable, unfortunately.
Most of the existing data on HF LQ come from hadronic three-body decays. The event distribution in the Dalitz plot is given by,
| (1) |
where is the mass of the decaying particle and , are the two-body invariant masses squared. The phase space density is constant, so any structure in the Dalitz plot reflects directly the dynamics of the decay.
The analysis technique of such decays is by now standard[1]. The decay amplitude is written as a coherent sum of phenomenological amplitudes corresponding to the possible intermediate states,
| (2) |
with
| (3) |
In the above equations and are form factors, with being the orbital angular momentum at the or at the resonance decay vertex; is a function accounting for the angular momentum conservation, and is a relativistic Breit-Wigner function (with an energy dependent width, in general). The complex coefficients are usually the fit parameters.
Analyzes differ by the way the S-wave, , is modeled. There are three basic approaches.
The most used model is the so called isobar model[2, 3], in which the S-wave is represented by a sum, of Breit-Wigner functions and a nonresonant amplitude, with unknown complex coefficients. The nonresonant amplitude is assumed to be uniform in decays, but varies across the Dalitz plot in the case of decays. This model is simple and intuitive, but there are well known conceptual problems with this approach[4]. As we will see, it provides an effective description of the data but, in some cases, the physical interpretation of the results is rather ambiguous.
Another approach is the K-matrix model[5]. This is a very sophisticate tool, but it is based on a very strong assumption: in the decay, the resonant system and the bachelor particle recoil against each other without any interaction. This would greatly simplify the problem, although one must acknowledge the lack of experimental evidence supporting this assumption. If the three-body rescattering is negligible, the evolution of the system must be the same as in elastic scattering. In the K-matrix approach the S-wave amplitude is, therefore, fixed by other type of reactions, whereas the production of the pair is an unknown function to be determined by the fit. This universality of the S-wave is often seen as the most appealing feature of the K-matrix approach. We should not forget that the same constraint should be applied to all partial waves, which, unfortunately, is not the case of the analyzes published so far. In general, good fits are achieved only if an extra energy-dependent phase is added. In the framework of the K-matrix model, the origin of such a phase is attributed to the production of the pair. This is simply a matter of interpretation, since this phase could also be due to the rescattering of the final state particles. There is no way, with the existing measurements, to distinguish between these two effects.
Finally, there is the PWA approach[6]. Here no assumption is made about the content of the S-wave, which is treated as a generic complex function of the mass, . The spectrum is divided in bins. At each bin edge the amplitude is defined by two real constants, and , which are fit parameters. The amplitude at any value of the mass is given by a polynomial interpolation. This method relies on a precise modeling of the P- and D-waves. The problem resides, once more, in the interpretation of the results. The measured S-wave phase includes any rescattering/production effects, which should be disentangled in order to determine the ’bare’ amplitude.
One last remark is in order. A consequence of representing the decay amplitude by a coherent sum of amplitudes is that the decay fractions do not add to 100%. Different amplitudes populate the same region of the phase space, so they are expected to interfere. The amplitudes have phases that vary across the Dalitz plot. The interference can be destructive in some regions of the phase space and constructive in other ones. One should be very careful, though, when the sum of fractions largely exceeds 100%. In almost all cases this large interference occur between the broad amplitudes in the S-wave, involving, in general, the nonresonant amplitude. This is a symptom of a poor modeling of the S-wave. In other words, one may find a mathematical solution to the fit problem, but with a misleading physical interpretation. In the following Sections we will see several instances of this problem.
3 The low energy spectrum: the problem
There are two crucial questions to be answered in the low mass spectrum. The neutral has been observed by different experiments in several types of heavy flavor decays[3, 11, 7], but so far evidence for its charged partner has been scarce and controversial. This casts doubts about the being a regular state. The other issue is the pole position of the . There is no data on elastic scattering bellow 825 GeV/c2. Determination of the pole position[8] must rely on extrapolations of the existing data. New data that fill the existing gap would be highly desirable. This section is devoted to these two issues.
3.1 The decay – BaBar
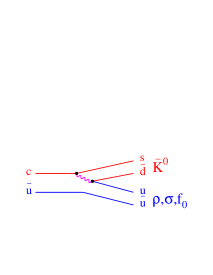
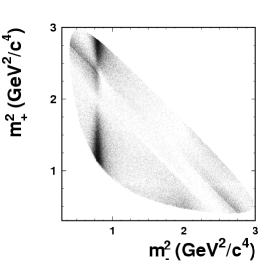
In a recent analysis of the decay , performed by the BaBar collaboration[9], the issue of the charged has been addressed. The data sample has 11K signal events with 98% purity. The Dalitz plot of this decay is shown in Fig. 1. Resonances can be formed in all three axes (the third axis, , is along the diagonal, starting at high mass) of the Dalitz plot.
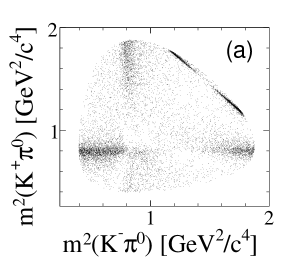
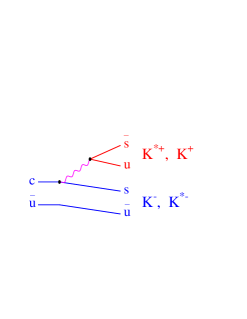
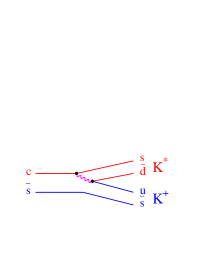
The main diagrams for this decay are shown in Fig. 2. There is a well defined pattern in decays that proceed via the external -radiation amplitude (Fig. 2-a): due to the - nature of the weak interactions, the couples much more strongly to a vector or an axial-vector meson than to a pseudoscalar. According to this pattern, one expects a dominant contribution from the channel, compared to . Important contributions from the and modes are also expected. We can see in Fig. 1 clear structures corresponding to these resonances.
The Dalitz plot of Fig. 1 was fitted using three different models for the S-wave. In the first fit, the S-wave was represented by the usual isobar model – a constant nonresonant amplitude plus two Breit-Wigner functions for the and modes – with parameters taken from E791[3]. The second fit used the E791 PWA S-wave[6] measured from the decay. Finally, the third fit used the LASS S-wave amplitude[10]. The isobar model has the smaller fit probability ( prob. 5%). The E791 PWA S-wave provides a good description of the data ( prob. 23%), but the best fit was obtained using the LASS S-wave. Results of the fits with LASS S-wave are summarized in Table 1. Note that in Model II the exclusion of the amplitudes – a 5% contribution in Model I – has a minor impact on the other P-wave components, but causes a dramatic change in the S-wave fraction. Moreover, in Model II the sum of the decay fractions largely exceeds 100%, indicating the existence of large destructive interference effects.
| mode | model I | model II |
|---|---|---|
| 45.20.9 | 44.40.9 | |
| 3.71.5 | - | |
| 16.30.1 | 71.14.2 | |
| 19.30.7 | 19.40.7 | |
| 6.71.8 | 10.51.4 | |
| 16.00.9 | 15.90.9 | |
| 2.71.5 | - | |
| prob. | 62% | 47% |
The fit with the LASS amplitude is much better than the one having explicitly the amplitude.Note that this result does not rule out the charged , since its pole can be found in LASS data[8]. It simply says that the isobar representation of the S-wave in the decay, from E791[3] and FOCUS[11] analysis, is not a good model for the S-wave amplitude in the decay. In both E791 and FOCUS analyzes of the decay, the LASS S-wave amplitude fails to provide a good description of the data, whereas a very good fit was achieved with the isobar model. The origin of this discrepancy is yet to be understood. With a larger sample, a model independent measurement of the S-wave amplitude could be performed and directly compared to the results of the E791 MIPWA[6].
3.2 The decay – Belle
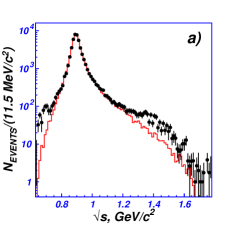
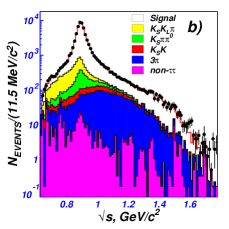
In hadronic decays of the lepton, , the system is not affected by strong interaction with the leptonic current. This would be as close as one could get to the elastic scattering using HF decays. The Belle Collaboration published recently[12] a study of the decay . A sample with 53K signal events was selected from the reaction . The decays to a muon plus two neutrinos, so the signature of the event is one lepton recoiling against three charged prongs in the opposite hemisphere. With a total of three missing neutrinos, it is very difficult to reconstruct the event topology. Immediate consequences are a high background level (20% in this analysis) and the lack of an angular analysis.
The angular distribution of the helicity angle was used in FOCUS study[13] of the decay. The helicity angle is formed by the momentum and the line of flight of the , measured in the rest frame. In this decay there is a 5% scalar component. The line shape of the spectrum, which is dominated by the , is not sensitive to the different models for the S-wave component. However, the different possibilities – a complex constant, a Breit-Wigner function, or the LASS S-wave amplitude – lead to different angular distributions, so one can explore this feature in order to understand the nature of the scalar component.
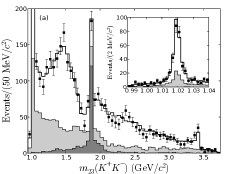
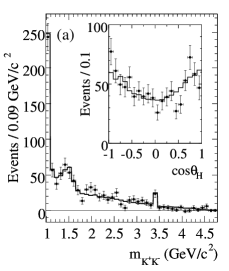
In the case of the decay, the alone is not enough to describe the spectrum, as we can see in Fig. 3-a. There is an excess of events in the lower and in the upper part of the spectrum. The spectrum was fit with two classes of models : the dominant plus the charged and one high mass state (either a vector or a scalar resonance); the plus the LASS S-wave amplitude. The best fit was obtained with the plus a pure S-wave, that is, a sum of the and the . The confidence level of this fit is 41% (Fig. 3-b). The fit using the LASS amplitude, on the other hand, yielded a C.L. of only 10-8.
The result of Belle analysis is in conflict with those of the BaBar study of the decay. One could expect that, in the absence of strong interactions, the S-wave phase would match that of LASS, whereas in the case of the rescattering would cause deviations from the elastic phase. This is a rather intriguing result. In both cases the statistics is limited to a few thousands of events, though. The angular analysis on a larger sample may confirm the resonant behavior of the S-wave at low mass. In this case we would have a compelling evidence of the charged .
3.3 The decay – FOCUS
The is a golden mode for the study of scalar mesons. The S-wave accounts for over 60% of the decay rate. In addition, the large branching fraction (9.5%), combined with the long lifetime and a final state having only charged tracks (the odd charge track being always a kaon), makes the the easiest charm decay mode to be reconstructed. Using this decay one can measure the S-wave amplitude near threshold, filling the existing gap in LASS data.
FOCUS has published recently a study of this decay using the K-matrix approach[11]. A good fit was obtained combining the and LASS S-wave phases with an additional energy dependent phase. This extra phase was interpreted as being originated from the production dynamics of the system, but it could also be attributed to the rescattering of the final state particles. One important aspect should be stressed. The component is purely nonresonant, whereas all resonances are in the amplitude. The latter has also a nonresonant background. The fractions of each isospin component in the K-matrix fit are (20728)% and (40 10)% for the and , respectively. The total S-wave fraction amounts to (832)%. Here is another instance of large interference between broad components within the S-wave.
The PWA approach for the S-wave was used recently by CLEOc[14] and FOCUS[15]. In this new FOCUS study, the Dalitz plot is fitted using also the isobar model for the S-wave. This is a work in progress, based on a sample of 93K signal events and with 98% purity. From here to the end of this Section we will discuss the preliminary results this FOCUS PWA/isobar Dalitz plot analysis.
In the isobar fit, the S-wave model was that of E791[3]: a sum of an uniform nonresonant amplitude, plus two Breit-Wigner functions for the and modes. In order to make a direct comparison with E791 and CLEOc, the S-wave Breit-Wigner functions are multiplied by the same Gaussian form factors, . Masses and widths of the scalar resonances are fit parameters.
The fit fractions and resonance parameters are shown in Table 2. Results from the three experiments are in reasonable agreement, except for the S-wave fraction in CLEOc analysis, which is a bit smaller than E791 and FOCUS. But the most remarkable feature in Table 2 is shown in the last three columns. The isobar fit to FOCUS data was repeated with a little variation of the S-wave parameterization. In FOCUS(b) the value of the scalar form factor parameter, , was set to 6 GeV-1 (instead of 5 GeV-1 in FOCUS(a)). In FOCUS(c) the value of was set to zero, which is equivalent of having no scalar form factor. All the three FOCUS fits have an equally good confidence level. We observe a dramatic change in the S-wave composition, while the P- and D- waves remain unaltered. The nonresonant fraction varies by a factor of four.
| mode | E791 | CLEOc | FOCUS(a) | FOCUS(b) | FOCUS(c) |
|---|---|---|---|---|---|
| 12.31.4 | 11.21.4 | 11.30.3 | 11.70.3 | 11.20.3 | |
| - | - | 1.20.3 | 1.10.3 | 1.30.3 | |
| 2.50.8 | 1.40.2 | 3.30.3 | 2.70.3 | 3.80.3 | |
| 0.50.2 | 0.40.4 | 0.200.05 | 0.200.05 | 0.200.05 | |
| 12.51.4 | 10.51.3 | 16.80.8 | 14.30.7 | 18.71.2 | |
| 47.813.2 | 31.23.6 | 43.54.5 | 71.35.5 | 22.33.2 | |
| 10.41.4 | 13.07.3 | 14.33.0 | 7.53.1 | 31.64.5 | |
| mass | 79748 | 80511 | 83712 | 82914 | 86714 |
| width | 41097 | 45321 | 44321 | 43318 | 48527 |
| mass | 14613 | 14595 | 14664 | 14684 | 14664 |
| width | 1695 | 17516 | 1937 | 1937 | 1927 |
This instability can be readily explained by the interference between the broad Breit-Wigner and the uniform nonresonant component. In Fig. 4 the effect of the scalar form factor is illustrated. Fig. 4-a shows the modulus squared of the Breit-Wigner. The mass dependence of the width, in the denominator of the Breit-Wigner, shifts the maximum of the function to a value bellow the threshold. The introduction of the Gaussian form factor modifies the line shape near threshold (Fig. 4-b). The resulting amplitude has a more reasonable behavior. The same effect can be achieved if, instead of multiplying the Breit-Wigner by the Gaussian form factor, we add the correct amount of a constant nonresonant amplitude, with the right phase difference. This is shown in Fig. 4-c.
The case of the is didactic: the isobar model yields a good fit, but it fails to provide an unambiguous physical picture of the decay dynamics. The model for the S-wave is clearly inadequate. We need to go beyond the isobar model in order to understand the composition of the S-wave.
The Dalitz plot is also fitted using the PWA method. The spectrum is divided in forty equally spaced intervals. At the edge of each interval the S-wave amplitude is defined by two fit parameters, . The value of the S-wave amplitude at any point in the spectrum is given by a spline interpolation of these forty points. The S-wave is determined by an iterative procedure. A first fit is performed fixing the P-wave to that of the isobar analysis. The S-wave is determined (80 fit parameters). A second fit is performed fixing now the S-wave and varying the P-wave. The process is repeated until it converges.
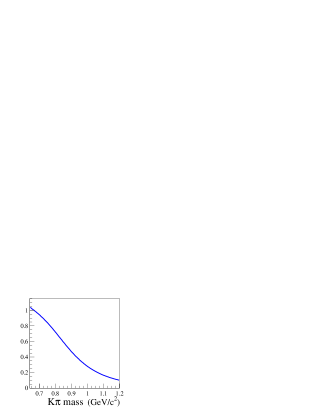
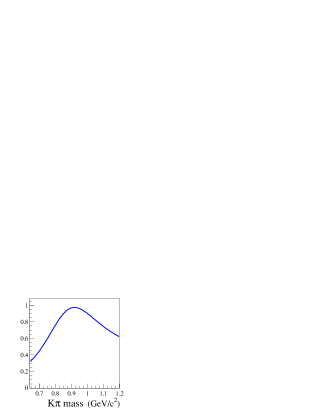
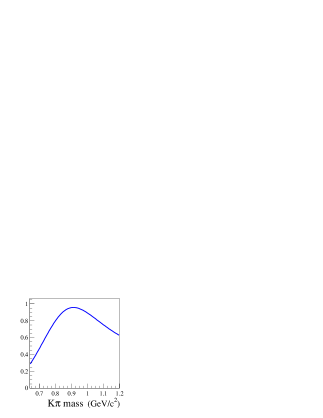
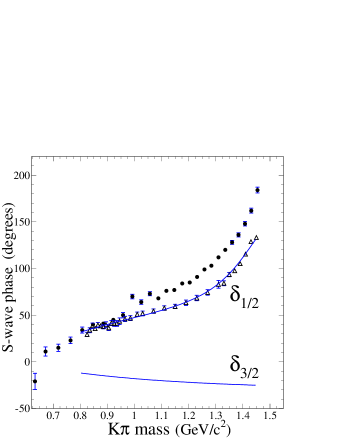
Fig. 5 shows the FOCUS PWA S-wave phase, , as a function of the mass squared. A 80o overall phase was added to for a better comparison with the and phases from LASS. There is a clear discrepancy between the S-wave phase measured by FOCUS and that of LASS amplitude. The agreement between FOCUS and LASS cannot be achieved even combining both isospin phases. An extra phase, which depends smoothly on the mass, is necessary for the matching of the two amplitudes. The origin of such a phase is unclear.
The PWA is as close as one can get to a model independent method, since no hypothesis is assumed for the S-wave. But the method has some technical limitations arising from the large number of free parameters. One limitation is the existence of multiple solutions. With so many parameters, the fit has freedom to cure eventual problems with the P-wave model. A precise representation of the P-wave is mandatory, otherwise some ’leakage’ into the S-wave would be unavoidable.
The interpretation of the results is not trivial. The amplitude measured with the PWA method includes not only the dynamics, but also any possible contribution from the production of the pair and rescattering of the final state particles. Some urgent input from theory is required in order to disentangle these effects.
4 Is there an ?
In the low energy spectrum the pole is now well established, but the situation between 1-2 GeV/c2 is still controversial. There may be three neighbor scalar states, namely the , the and the . The is a narrow, well established state, with mass, width and couplings know to a good degree of accuracy[16], but the uncertainty on the parameters is very large: GeV/c2 and GeV/c2. The existence of this state is often questioned.
The has been observed mostly in central production and annihilation (see, for instance D. Bugg’s recent review on this state [17]). BES has also reported on this state from the decay [18]. This state is very difficult to be detected because it is broad and very close to the . Its line shape may also be sensitive to the opening of the channel.
An interesting and related issue: the mass of the lightest scalar glueball is expected to be around 1.5 Gev/c2. It is widely accepted that the three scalars would mixed states, having both and components in their wave functions.
Heavy flavor decays are particularly useful here, since in these decays the component of the intermediate resonances are probed.
4.1 The decay – FOCUS and E791
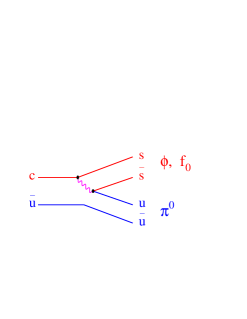
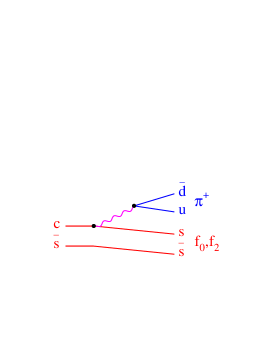
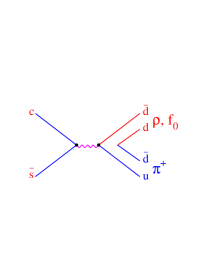
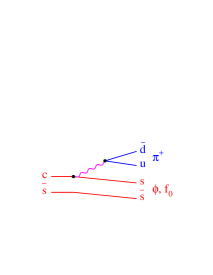
The decay is particularly suited to the study of scalar mesons. In this decay the S-wave component amounts to over 80% of the decay rate. The dominant diagram is shown in Fig. 6-a, with a small contribution from the annihilation diagram (Fig. 6-b). The should be the dominant mode. The has a large coupling to and, therefore, it must have a strong component in its wave function. An important contribution from the channel is also expected.
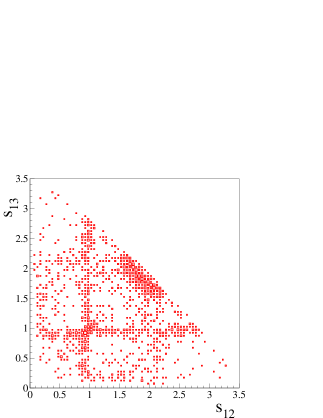
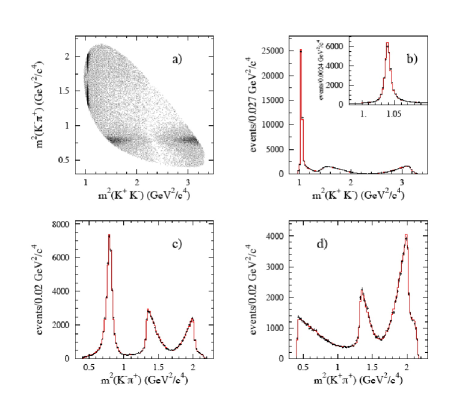
FOCUS has collected a sample of 1400 signal events. The Dalitz plot, shown in Fig. 7, was fitted with the K-matrix approach[5]. It was also fitted using the isobar model, but the results of this analysis were not published.
There are two remarkable features in Fig. 7: a very clear structure at 1 (GeV/c2)2, corresponding to the ; the concentration of events near the border, at 2 (GeV/c2)2, which is due to the , and to a scalar state, which we refer to as . The Dalitz plot was fit[19] using the isobar model for the S-wave, which has three components: the , the and the nonresonant modes. The mass and width of the are fit parameters.
The fit fractions, as well as the mass and width of the , are shown in Table 3 (FOCUS errors are statistical only). FOCUS has about twice as many events as E791. In both analysis the is the dominant component, followed by the . The BES Collaboration[18] measured the mass and width of the in the decay, obtaining GeV/c2 and GeV/c2. Comparing these values to the ones of the , we conclude that the state observed in the is not the same as the one observed by BES.
Several variations of the S-wave model were tested. The mode was added to the S-wave, but its contribution is consistent with zero. A fit including the (with BES parameters) was performed, yielding a null contribution of this mode. In both FOCUS and E791, only one is necessary to describe the data, and this state is consistent with being the . The decay fraction of the is very large. Given the diagram of Fig. 6-a, one may conclude that this state has a significant component in its wave function. In this case we may also expect a large fration of this mode in the decay.
| mode | FOCUS | E791[20] |
|---|---|---|
| 76.94.9 | 56.55.9 | |
| 23.30.5 | 32.47.9 | |
| 13.25.7 | 12 | |
| 1.20.1 | 5.84.4 | |
| 4.01.0 | 4.42.1 | |
| 9.71.4 | 19.73.4 | |
| (GeV/c2) | 1.4765.7 | 1.43418 |
| (GeV/c2) | 11918 | 17332 |
4.2 The decay – BaBar
The and the decays share the same dominant diagram (Fig. 6-a). The latter mode can also proceed via the internal -radiation amplitude (Fig. 8-b). A dominant contribution from the , and modes is expected, but there should also be a large component.
BaBar collected a very large (100K signal events) and clean (95% purity) sample[21] of the decay . The Dalitz plot is shown in Fig. 9. BaBar is currently analyzing this data using the PWA method for the S-wave. Here we present preliminary results of the Dalitz plot analysis using the isobar model.
The fit result is shown in Table 4. In Fig. 9 we have the Dalitz plot projections with the fit result superimposed. In the low mass region there could also be a contribution from , in addition to the and the . In practice, is nearly impossible to fit the data with a model having, at the same time, these three amplitudes. The interference between them is very large, the coefficients become highly correlated and the individual fractions become too unstable. A stable fit is obtained with a model having only one of the two scalar amplitudes. The values reported here are from a fit with the . Note that there is still a large uncertainty in the fraction.
| mode | fraction(%) |
|---|---|
| 3514 | |
| 6.34.8 | |
| 2.01.0 | |
| 37.91.9 | |
| 48.71.6 |
The most surprising result is the absence of the . We can see in Fig. 9-b that there are very few events in the region. There is, on the other hand, a small excess of events next to the region, which is not well described by an uniform nonresonant amplitude. Instead, a scalar state was introduced. The fitted mass and width of this state are GeV/c2 and GeV/c2. The large errors reflect the sensitivity to the details of the S-wave parameterization. One could not really interpret this result as an indication of the , since this is a very complicated region of the spectrum.
The absence of a contribution in may indicate that the S-wave model used in the study of the is not the most correct. BaBar is currently analyzing a sample of the decay which is a factor of 10 larger than that of FOCUS. The most important result would be a simultaneous PWA measurement of the S-wave in both final states. The statistics is not a problem for the , but, unfortunately, it is still a bit limited in the case of , even considering the BaBar sample.
4.3 The decay – Belle
Belle and BaBar have collected very large samples of the decay. The Dalitz plot analysis performed by both experiments used the isobar model, and the results are in very good agreement. Here we will discuss the Belle analysis, based on a sample of 534K events[22] with 98% purity.
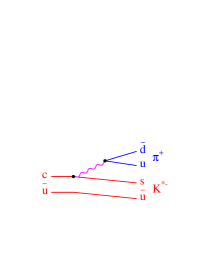
The diagrams for this decay are shown in Fig. 10. The dominant amplitude should be the channel, with important contributions from the mode and form the S-wave. The Dalitz plot, shown in Fig. 11, is very complex, since there could be resonances in all three axis. Moreover, there is a small contribution from the doubly Cabibbo suppressed decay . In Fig. 11 the label refer to the mass squared, if the parent is a , or to the the combination, in case the parent is a .
The fit model has 19 amplitudes leading to the final state. The S-wave contains four amplitudes: , the , and an extra scalar state, the . The parameters were taken from E791 (see Table 3), whereas the parameters were determined by the fit. This extra amplitude was introduced to account for a structure near 1 GeV/c2, but it does not correspond to a real state. The parameters obtained by the fit are GeV/c2 and GeV/c2.
The dominant contribution is, as expected, the (62%), followed by the (21%) and the S-wave (15%). The contribution of the is small but significant (1.6%). No errors on the fractions were quoted.
In spite of the large number of amplitudes, including the extra ’’, a good fit was not obtained. It is very hard to obtain a good C.L. in fits to very large samples. The goodness-of-fit is accessed by -like tests, in which the phase space is divided in bins of variable area, so that the number of events is similar in all bins. The isobar approach is, perhaps, too simplistic. With such a large sample, relatively small and localized deviations from the observed Dalitz plot distribution have, in general, large impact in the fit C.L.
The goal of this analysis is to study the mixing phenomenon. The technique is a time dependent Dalitz plot analysis. For this purpose, an effective representation of the data would suffice, according to the authors. Unfortunately the treatment given to the S-wave do not allow us to draw any conclusion. We cannot interpret the fraction attributed to the as an evidence for this state, since the S-wave is not well understood. No attempt to measure its parameters was reported. A study of the decay focused at the S-wave and using the PWA method is in order.
4.4 Charmless hadronic three-body decays of mesons.
Charmless hadronic three-body decays of mesons are a very promising tool, but there is still a long way to go. The data samples resemble those of mesons from the late 80’s. There are two main problems: statistics is still limited and the background is still high. The nonresonant component is another problem. It is likely to be larger in than in decays. A constant nonresonant amplitude is the usual parameterization in the case of decays, which may be a good approximation given the limited phase space. In decays, however, the understanding of the nonresonant amplitude is a crucial issue[23], as one can already conclude from the existing data.
There has been intense activity in this area, with many studies from the B-factories. Here we will focus on two analyzes from Belle, the [24] and [25] decays, and on two analysis by BaBar, the [26] and [27] decays.
The signal and the Dalitz plot are shown in Fig. 12. Fig. 12-b illustrates how large is the phase space and how much the action is concentrated near the border.
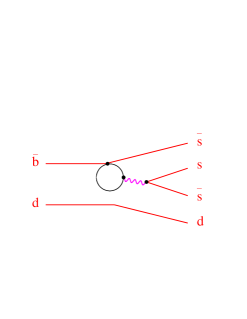
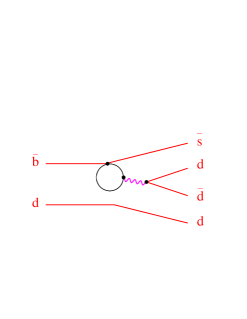
In these decays the dominant mechanism for the transition are penguin diagrams, shown in Fig. 13. The diagram of Fig. 13-a leads to final states having three kaons. The final states proceed via the diagram in Fig. 13-b. We expect dominant contributions from the , , and modes, in addition to the nonresonant component. We also expect the decay fractions in both and to be similar, since the replacement of the by the quark in Fig. 13-b turns the to the decay.
All studies of charmless hadronic three-body decays of mesons are performed with the isobar model. The nonresonant is parameterized by empirical formulae, with independent coefficients for each axis. In the two analyzes by Belle the expression for the nonresonant amplitude is . In both studies the data is better described by a model having one scalar state at 1.5 GeV/c2. The results of Dalitz plot fit are in Tables 5 and 6.


The decay fractions are similar in both decays, and correspond to the modes one expect from the diagram of Fig. 13-b. In both and decays there is a large interference between the and the nonresonant component, which causes the fraction of the to be very high. The S-wave seems to be not well understood. The interference between the S-wave and the corresponding nonresonant amplitude is small, though. The state was represented by a Breit-Wigner function, whose parameters were determined by the data: GeV/c2 and GeV/c2. These values are in good agreement with the ones obtained from the decay by FOCUS and E791.
| mode | fraction(%) |
|---|---|
| 13.01.0 | |
| 65.54.5 | |
| 7.91.0 | |
| 17.73.6 | |
| 4.10.9 | |
| 34.02.7 |
| mode | fraction(%) |
|---|---|
| 11.81.7 | |
| 64.87.8 | |
| 12.92.0 | |
| 16.04.2 | |
| 3.72.4 | |
| 41.95.5 |
It is interesting to these results to those from . From the diagram in Fig. 13-a one expect significant contributions from the and . The nonresonant amplitude is parameterized by empirical formulae similar to those used in Belle analysis. In the case of the the nonresonant amplitude has three independent terms. Like in the decays, a scalar resonance was introduced, with mass and width determined by the fit.
The projections of the Dalitz plot are shown in Fig. 14. We see a clear bump next to the peak, at 1.5 GeV/c2. The fit results are shown in Tables 7 and 8. The contribution of the decay is similar in both cases. As in the case of the decay, the fraction of the mode suffers from large uncertainties. There is a small contribution from the , but only in the decay. The most striking features, though, are the very different S-wave composition and the enormous interference between the nonresonant term and what BaBar calls the state. In the fit the sum of decay fractions amounts to 300%!.
The Breit-Wigner parameters of the state were determined in the analysis. In the analysis the parameters were fixed at the values obtained in the analysis. These are: and . GeV/c2. The parameters are very different from the ones of the state in . However, before drawing any definitive conclusions, the S-wave is understood, as well as the role and form of the nonresonant amplitude.
| mode | fraction(%) |
|---|---|
| 11.81.2 | |
| 198 | |
| 12120 | |
| 4.82.9 | |
| 14117 |
| mode | fraction(%) |
|---|---|
| 12.51.3 | |
| 40.29.6 | |
| 4.11.3 | |
| - | |
| 11215 |
5 Summary and conclusions
Two of the most challenging problems in the scalar mesons physics have been discussed from the point of view of heavy flavor decays.
In the low energy spectrum, the neutral is now established. An analysis of the elastic scattering data revealed the position of the neutral pole, in spite of the lack of data bellow 825 GeV/c2, and of the suppression of the amplitude due to the Adler zero. The existence of the charged partners remain unsettled, though. These issues can be addressed by heavy flavor decays. The S-wave amplitude was measured in the decay, including the region bellow 825 GeV/c2 where LASS data starts. There is, however, one unavoidable task: to extract the elastic scattering phase from the measured amplitude one has to handle other strong interaction effects.
Evidences for a charged are still scarce. The recent results from BaBar () and Belle () are rather intriguing. In the decay the system is isolated from any other strong interaction. We would expect that the phase from this decay to match that of LASS, whereas in the case of the decay the three-body FSI, or a complex production amplitude, would cause some deviations from the pure elastic scattering phase. The experimental results, however, show exactly the opposite picture. More data and refined analysis techniques are clearly necessary. In the case of the decay, the angular analysis is the crucial and missing piece. If such analysis is performed and confirm the resonant behavior at low mass, the we will have a compelling evidence for the charged .
In the system, the existence of the has been also addressed in studies of HF decays. The analysis of the and decays show that only one scalar state with mass near 1.5 GeV/c2 is necessary to describe the data. The measured parameters of this state are consistent with those of the . If we exclude the scalar mesons, in three body decays the only intermediate states observed are those having a regular resonance. We could say that it is very likely that the is a genuine meson, or has, at least, a strong component in its wave function. On the other hand, the evidence for the in HF decays is weak and inconclusive. The puzzling fact, though, is that the fraction of the mode in the decay is very large, suggests that the has a fairly large component and, therefore, a significant coupling to . But this is not true for the , and no indication of this state was found in decay. One possible interpretation is that the S-wave model used in the analysis is incomplete. There are also indications of a scalar state in with mass near 1.5 GeV/c2, but no conclusions can be drawn before the nonresonant component is understood.
We have seen that hadronic decays of heavy flavor are a very rich environment for the study of the scalar mesons. Thanks to their unique features, the information provided by HF decays are complementary to the traditional hadronic collisions. One must also keep in mind that HF decays have been the only new data available in the past ten years, and this will be so until the commissioning of the new facilities. The B-factories already have very large and clean samples of decays. As for the , data with equivalent quality will be available in a few years, from LHCb and the other LHC experiments.
The existence of good data, however, is not enough. The experimentalists need to develop better analysis techniques, going beyond the isobar model. The limitations of the latter appear either when one moves to really high statistics, or when complex final states are analyzed. Even with a better understanding of the S-wave, it seems that a simple coherent sum of amplitudes may be too simplistic. The improvement of the analysis techniques does not depend only on the experimentalists creativity, but also on a deeper understanding of the decay dynamics, of the role of final state interactions, of the nonresonant amplitude, form factors and line shapes. This requires the urgent intervention of the theoreticians.
In high energy physics most of the attentions are turned to the searches for new physics. There is a widespread belief that we are on the verge of great discoveries, that new particles are right at the corner. One of the most promising fields is the phenomenon of CP violation. The correct measurement of the CP violation effects, however, depends on the accurate understanding of the low energy strong interaction dynamics. That’s where the flavor physics and the hadron physics communities meet. Even with somewhat limited analysis tools, there are plenty of good data from the B-factories that should be analyzed in a systematic way, with the focus on the physics of the light quarks and, in particular, of the scalar mesons. This is a very rich and challenging program that needs to be implemented.
References
- 1 . Particle Data Group, D. Asner et al., J.Phys. G: Nucl. Part. Phys. 33,716 (2006)
- 2 . E.M.Aitala et al. (E791 Collaboration), Phys. Rev. Lett. 86, 770 (2001)
- 3 . E.M.Aitala et al. (E791 Collaboration), Phys. Rev. Lett. 89, 121801 (2002)
- 4 . S.Gardner and U.G.Meissner, Phys. Rev. D 65, 094004 (2002).
- 5 . J.M.Link et al. (FOCUS Collaboration), Phys. Lett B585, 200 (2004).
- 6 . E.M.Aitala et al. (E791 Collaboration), Phys. Rev.D73, 032004 (2006).
- 7 . M.Abiklim et al. (BES Collaboration), hep-ex/0506055.
- 8 . S.Descotes-Genon and B.Moussallam, Eur. Phys. J. C48, 553 (2006).
- 9 . Babar Collaboration internal note, unpublished.
- 10 . D.Aston et al. (LASS Collaboration), Nucl. Phys. B296, 493 (1988).
- 11 . J.M.Link et al. (FOCUS Collaboration), Phys. Lett B653, 1 (2007).
- 12 . D.Epifanov et al. (Belle Collaboration), arXiv:0706.2231.
- 13 . J.M.Link et al. (FOCUS Collaboration), Phys. Lett B621, 72 (2005).
- 14 . G.Bonvicini et al. (CLEOc Collaboration), arXiv:0707.3060.
- 15 . FOCUS Collaboration, in preparation.
- 16 . Particle Data Group, W.-M.Yao et al., J.Phys. G: Nucl. Part. Phys. 33,1 (2006).
- 17 . D.V.Bugg, arXiv:0706.1254.
- 18 . M.Abiklim et al. (BES Collaboration), Phys. Lett B607, 243 (2005).
- 19 . FOCUS Collaboration internal note, unpublished.
- 20 . E.M.Aitala et al. (E791 Collaboration), Phys. Rev. Lett. 86, 765 (2001).
- 21 . B.Aubert et al. (Babar Collaboration), Phys. Rev. D76, 011102 (2007).
- 22 . L.M.Zhang et al. (Belle Collaboration), arXiv:0704.1000.
- 23 . I.Bediaga et al., arXiv:0709.0075.
- 24 . A. Garmash et al. (Belle Collaboration), Phys. Rev. D71, 092003 (2005).
- 25 . A. Garmash et al. (Belle Collaboration), Phys. Rev. D75, 012006 (2007).
- 26 . B.Aubert et al. (Babar Collaboration), Phys. Rev. D74, 032003 (2006).
- 27 . B.Aubert et al. (Babar Collaboration), arXiv:0706.3885.