The Influence of Dust Formation Modelling on Na I and K I Line Profiles in Substellar Atmospheres
Abstract
We aim to understand the correlation between cloud formation and alkali line formation in substellar atmospheres.We perform line profile calculations for Na I and K I based on the coupling of our kinetic model for the formation and composition of dust grains with 1D radiative transfer calculations in atmosphere models for brown dwarfs and giant gas planets. The Na I and K I line profiles sensibly depend on the way clouds are treated in substellar atmosphere simulations. The kinetic dust formation model results in the highest pseudo-continuum compared to the limiting cases.
keywords:
Stars: atmospheres – Line: profiles – Stars: low-mass, brown dwarfs1 Introduction
Dust influences the environment from which it forms by consuming elements from the gas phase. Hence, dust selectively alters the local metallicity in the atmosphere of a brown dwarf as well as in planetary atmospheres (Woitke & Helling 2004, Helling, Woitke & Thi 2008). Dust clouds furthermore efficiently absorb photons which can result in m-broad absorption features (Helling et al. 2006, 2007; Cushing et al. 2006, Burgasser et al. 2007). The absorbed energy is redistributed inside the lattice structure of the solid grain causing an isotropic irradiation of IR photons into the atmosphere, a process, which considerably alters the atmospheric temperature profile (Tsuji et al. 1996, Tsuji 2005, Ackerman & Marley 2001, Allard et al. 2001). Both processes, the selective alteration of local element abundances and the changing atmospheric temperature, have a distinct influence on the gas-phase chemistry which determines the atomic and molecular concentrations. These intricate effects are important even for elements not or only marginally involved into the dust formation process as we will show in this letter.
Alkali lines are dominant features in the optical spectrum of brown dwarfs and the far line wings of the most abundant alkali metals, sodium and potassium, determine the pseudo-continuum in this spectral range (Johnas et al. 2007a, Allard et al. 2007). Another alkali, Li, is used to determine fundamental parameter of substellar objects (e.g. Martin, Rebolo & Maguzza 1994, Johnas et al. 2007c). They all can be a powerful tool to study the cloud formation in substellar objects if combined with an atmosphere simulation which allows to correlate the line profiles with an analysis of the atmosphere regarding the structure ( - gas temperature, - gas pressure, - convective velocity) and the chemistry.
In this letter we show that the modelling of dust formation has a strong impact on the line shapes and the depth of the Na I and K I alkali lines in dust-enshrouded L-dwarfs. We utilise our kinetic model for dust cloud formation in atmosphere simulations of substellar objects (brown dwarfs and extrasolar planets) in comparison to two limiting cases in order to demonstrate the sensitive dependence of alkali line profiles on the local profile ( - element abundance) of the atmosphere. We show that the treatment of dust cloud formation has a much stronger impact on the alkali line profiles than the details of the line profile calculation.
2 Atmosphere Models
We present our studies based on simulations carried out with the general purpose model atmosphere code PHOENIX111This is the same code as used by Allard et al. (2001) except for the dust chemistry and line-profile calculations., version 15, (Hauschildt & Baron 1999). We combine the study of line profiles of Johnas (2007) with the kinetic dust cloud modelling by (Helling & Woitke 2007) which has recently been incorporated into PHOENIX by Dehn (2007) (also Dehn et al. 2008). We concentrate here on the following two different line profile approaches for which the model atmospheres are calculated:
-
•
impact – line profiles:
van der Waals profiles applying the impact approximation for near line wings (Schweitzer et al. 1996) -
•
modern1 – line profiles:
Detailed non-analytical, semi-classical line profiles (Allard et al. 2005, Allard & Spiegelman 2006, Johnas et al. 2006) including H2 in two symmetries, and , and He as perturber. The alkali line profiles are represented by two terms, one describing the near line wing with the impact approximation (Baranger 1958b, Royer 1971) and the other describing the far line wing with the one–perturber approximation in the density expansion (Royer 1971). 222 Johnas et al. (2007a,b) show that alternative alkali near line wing profiles (Mullamphy et al. 2007) result in negligible effects on the atmospheric structure and synthetic spectrum.
For our study of the influence of different dust model approaches on alkali line profiles, we compare simulations for the two limiting cases Cond and Dusty (Allard et al. 2001), and our new Drift module (Dehn et al. 2008) which includes a detailed modelling of dust formation:
-
•
Cond approach:
The Cond approximation assumes the dust to be in chemical and phase equilibrium with the surrounding gas phase. The dust is ignored as opacity source because it is assumed that after the dust grains have formed they sink down below the photosphere, thus resulting in a depleted gas phase with no dust absorption or emission. This scenario was used to model T-type brown dwarfs (e.g. Lodieu et al. 2007) or planetary objects (e.g. Seifahrt et al. 2007) with Teff lower than 1400K but does not allow to consider the cloud formation process. These models are not realistic for the parameter range considered here and are included for comparison only. -
•
Dusty approach:
The dust is assumed to have formed in chemical and phase equilibrium, as in the Cond models but is assumed to remain at the place of formation. In both Cond and Dusty, the amount of elements bound in grains is subtracted from the gas phase. No dust settling is taken into account. The interstellar grain size distribution is used for the dust opacity calculation. Dusty models were used at higher Teff representing the case of a thick cloud layers inside the atmosphere of L - dwarfs (e.g. Leggett et al. 2001) and do not consider the actual formation process. -
•
Drift approach:
The Drift package (Dehn et al. 2008) is based on a kinetic treatment of dust formation (Woitke & Helling 2003, 2004; Helling & Woitke 2006; Helling, Woitke & Thi 2008). A stationary dust formation process is assumed for application in static model atmospheres. In these model atmospheres, seed particles (here: TiO2) nucleate from the gas phase if an appropriate super-saturation is achieved, subsequently grow a mantle made of various compounds (SiO2[s], Al2O3[s], Fe[s], MgO[s], MgSiO3[s], Mg2SiO4[s], and TiO2[s]) by 32 chemical surface reactions (Dehn 2007), settle gravitationally, and evaporate. The dust formation cycle is completed by convective overshooting of uncondensed material which is modelled by an exponential decrease of the mass exchange frequency into the radiative zone (Ludwig et al. 2006). The material composition of the grains, the amount and the size of dust particles formed – which are needed to evaluate the cloud’s opacity in the radiative transfer calculation – are results of our model.
3 Results
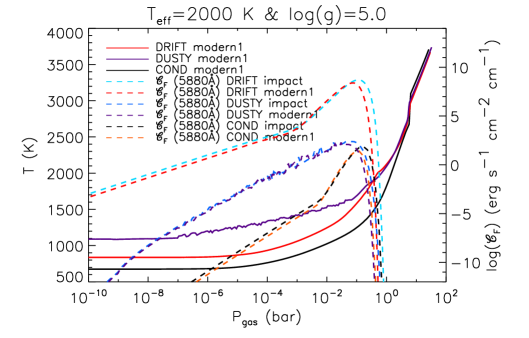


We demonstrate our results for a L-type brown dwarf with K, , and solar composition (Anders & Grevesse 1986). Figure 1 shows that the atmospheric –structures are very similar for bar for Drift-Phoenix and Dusty-Phoenix models, but can differ by up to 300K (i.e. 30 %) at lower pressures. All models agree well in the innermost atmospheric layers. The Drift-Phoenix temperature gradient is steeper compared to the Dusty-Phoenix case. The Drift-Phoenix model structure falls basically between the two limiting cases Dusty and Cond. The different line profiles cause negligible differences in the –structures for all three cloud models (Johnas 2007).
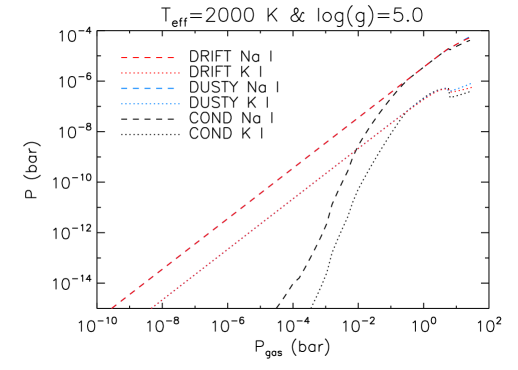
In addition to the –structures in Fig. 1, the flux contribution function (see Fuhrmeister et al. 2006) of each of the simulations is shown at 5880 Å which is a line wing wavelength in the Na I D2 resonance line (Fig. 5). The maximum of is correlated to the location in the atmosphere at which the line wing is formed at that specific wavelength (Magain 1986, Fuhrmeister et al. 2006). Note, however, that should only be considered for strong lines like Na I and K I. Figure 1 demonstrates that in general the Na I D2 line wings at 5880 Å form at comparable local gas pressures in the model atmospheres despite the different dust cloud approaches considered here. We furthermore find that Na and K appear with comparable concentrations in the line forming regime in all models (Fig. 2). This leaves the local temperature as only candidate for potential differences in the Na I and K I line profile for different dust cloud treatment.
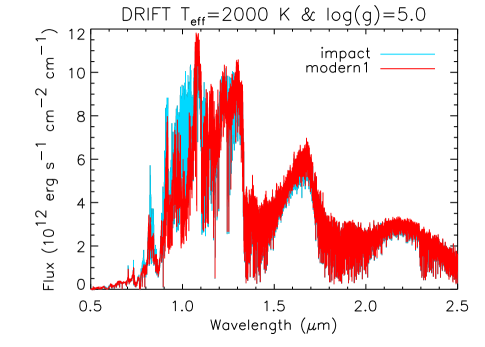
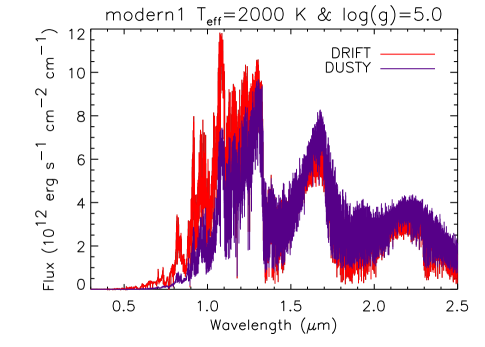
Figure 3 shows that the low resolution Drift-Phoenix spectrum for two different line profile setups will basically differ in the optical and near-IR region which is, hence, the spectral region predominantly influenced by the line profile treatment. Although one might have expected more effects in larger spectral ranges, the relative changes shown in the bottom-panel of Fig. 3 are relatively small. On the contrary, the differences in the low-resolution spectra between the different dust approaches (Drift, Dusty) for fixed line profile treatment are quite remarkable (Fig. 4). These strong differences are no surprise because the atmospheric –structures differ substantially (Fig. 1), and therefore the amount of molecular opacity carriers does change. For example, Dusty-Phoenix produces a TiO-concentration of two orders of magnitude less than Drift-Phoenix at bar. The temperature-dependent gas-phase composition does also influence the dust formation by providing the constituents from which the dust forms. We find similar discrepancies when comparing spectra between Drift-Phoenix and Cond-Phoenix models (not shown).
3.1 Alkali lines
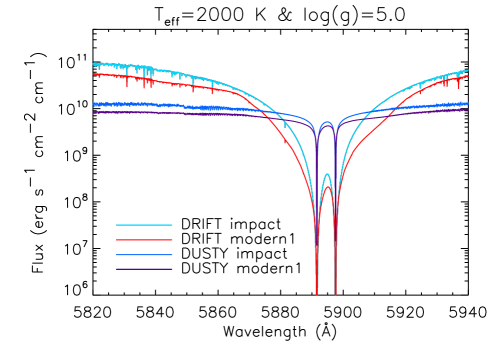
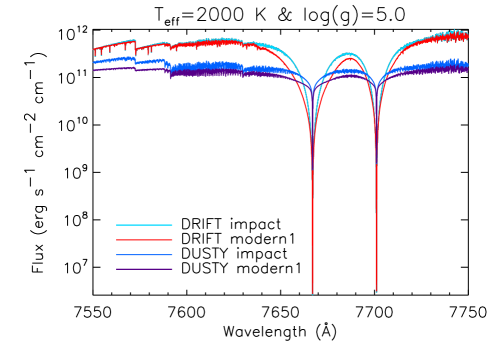
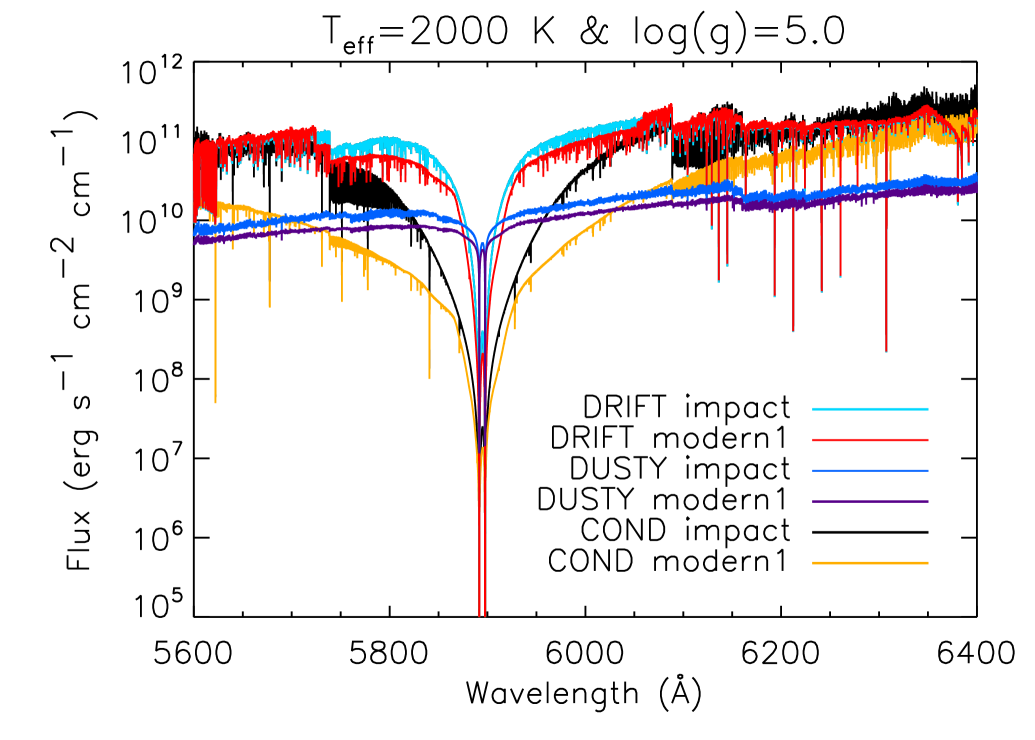
The classical Dusty-Phoenix simulation result in a lower pseudo–continuum for both, the Na I D and K I doublets compared to the Drift-Phoenix results (Fig. 5). The Dusty-Phoenix models have a higher dust opacity than the Drift-Phoenix models which results in strongly differing -structures. Hence, also the line shapes for the Na I D and K I doublets differ considerably. It appears that the local gas pressure and the concentration of Na I and K I are very similar in the line forming region in these models but large differences occur in the local temperatures. Comparing Fig. 6 visualises that the Cond-Phoenix line profiles match up with the Drift results better in the far wings since here the differences in the local temperature are somewhat smaller (Fig. 1). Generally, the Drift-Phoenix atmosphere simulations, which are based on a detailed kinetic cloud model, yield a stronger pseudo-continuum and deeper line cores. The similarity of the alkali partial pressures especially between the Drift and Dusty approach point to the local temperature as main cause for the large differences in the line-profiles. All figures show that the observable line shapes depend more on the dust model than on the line profile model.
4 Conclusion
We have demonstrated that the dust treatment in an atmosphere simulation for substellar objects has a large influence on the resulting line-profile of the alkalies Na I and K I. We conclude that the main cause for these large differences is the strongly changing local temperature which is directly linked to the dust treatment by the resulting dust opacity. The different treatments of the alkali line profiles result in negligible changes compared to the effect of dust treatment.
The pseudo-continuum of alkali line-profiles are strongest if based on a microphysical dust model taking into account the kinetic nature of dust formation (Drift-Phoenix). This findings may foster studies on Li I and Rb I lines since Johnas (2007) has shown that in particular the far K I line wings can mask the Rb I doublet, but both the Na I and the K I overlap the Li I doublet cores.
Acknowledgments
We thank the referee for valuable commends on the manuscript. This work was supposed in part by the DFG via Graduiertenkolleg 1351. Some of the calculations presented here were performed at the Höchstleistungs Rechenzentrum Nord (HLRN); at the NASA’s Advanced Supercomputing Division’s Project Columbia, at the Hamburger Sternwarte Apple G5 and Delta Opteron clusters financially supported by the DFG and the State of Hamburg; and at the National Energy Research Supercomputer Center (NERSC), which is supported by the Office of Science of the U.S. Department of Energy under Contract No. DE-AC03-76SF00098. We thank all these institutions for a generous allocation of computer time.
References
- (1) Ackerman A., Marly M. 2001, ApJ 556, 872
- (2) Allard F., Huaschildt P.H., Alexander D.R., Tamanai A., Schweitzer A. 2001, ApJ 556, 357
- Allard et al. (2005) Allard, N. F., Allard, F., & Kielkopf, J. F. 2005, A&A, 440, 1195
- Allard & Spiegelman (2006) Allard, N. F. & Spiegelman, F. 2006, A&A, 452, 351
- (5) Anders E., Grevesse N. 1986, GeCoA 53, 197
- Baranger (1958b) Baranger, M. 1958b, Phys. Rev., 111, 494
- (7) Burgasser A.J., Looper D.L., Kirkpatrick J.D., Cruz K.L., Swift B.J. 2007 ApJ, in press (arXiv:0710.1123)
- (8) Cushing M.C., Roellig T.L., Marley M.S., Saumon D., Leggett S.K. et al. 2006, ApJ 648, 614
- (9) Dehn M. 2007, PhD Thesis, University Hamburg
- (10) Dehn M., Helling Ch., Woitke P., Hauschildt P.H. 2008, ApJ, submitted
- Fuhrmeister et al. (2006) Fuhrmeister, B., Short, C., & Hauschildt, P. H. 2006, A&A , 452, 1083
- Hauschildt & Baron (1999) Hauschildt, P. H. & Baron, E. 1999, JCAM, 109, 41
- Helling & Woitke (2006) Helling, Ch. & Woitke, P. 2006,A&A , 455, 325
- Helling & Woitke (2006) Helling, Ch., Woitke, P., Thi W.-F., Fridlund, M. 2006, A&A , 451, L9
- Helling et al. (2007) Helling, Ch., Woitke, P., & Thi, W.-F. 2008, A&A, submitted
- Johnas et al. (2006) Johnas, C. M. S., Allard, N. F., Homeier, D., Allard, F., & Hauschildt, P. H. 2006, AIP Conf. Proc., 874, 354
- Johnas et al. (2007a) Johnas, C. M. S., Hauschildt, P. H., Schweitzer, A., et al. 2007a, A&A, 466, 323
- Johnas et al. (2007b) Johnas, C. M. S., Hauschildt, P. H., Schweitzer, A., et al. 2007b, A&A 466, 323 (Erratum: A&A 475, 1039)
- (19) Johnas C. M. S., Guenther E.W., Joergens V., Schweitzer A., Hauschildt P.H. 2007c, A&A 475, 667
- (20) Leggett S.K., Allard F., Geballe T.R., Hauschildt P.H., Schweitzer A. 2007, ApJ 548, 908
- (21) Lodieu N., Pinfield D.J., Leggett S.K. et al. 2007, MNRAS 379, 1423
- (22) Ludwig H.-G., Allard F., Hauschildt P.H. 2006, A&A 459, 599
- Magain (1986) Magain, P. 1986, A&A, 163, 135
- (24) Martin E.L., Rebolo R., Magazzu A. 1994, ApJ 436, 262
- Mullamphy et al. (2007) Mullamphy, D. F. T., Peach, G., Venturi, V., Whittingham, I. B., & Gibson, S. J. 2007, J. Phys. B, 40, 1141
- Royer (1971) Royer, A. 1971, Phys. Rev. A, 3, 2044
- Schweitzer et al. (1996) Schweitzer, A., Hauschildt, P. H., Allard, F., & Basri, G. 1996, MNRAS, 283, 821
- (28) Seifahrt A., Neuhäuser R., Hauschildt P.H. 2007, A&A 463, 309
- (29) Tsuji T., Ohnaka K., Aoki W. 1996, A&A 305, L1
- (30) Tsuji T. 2005, ApJ 621, 1033
- Woitke & Helling (2003) Woitke, P. & Helling, Ch. 2003, A&A, 399, 297
- Woitke & Helling (2004) Woitke, P. & Helling, Ch. 2004, A&A, 414, 335