Extended Red Emission and the evolution of carbonaceous nanograins in NGC 7023. ††thanks: This work is based on observations made with the Spitzer Space Telescope, which is operated by the Jet Propulsion Laboratory, California Institute of Technology under a contract with NASA.Based on observations made with the NASA/ESA Hubble Space Telescope, obtained from the Data Archive at the Space Telescope Science Institute, which is operated by the Association of Universities for Research in Astronomy, Inc., under NASA contract NAS 5-26555. These observations are associated with program 9471. Based on observations obtained at the Canada-France-Hawaii Telescope (CFHT) which is operated by the National Research Council of Canada, the Institut National des Sciences de l’Univers of the Centre National de la Recherche Scientifique of France, and the University of Hawaii. Based on observations with ISO, an ESA project with instruments funded by ESA Member States (especially the PI countries: France, Germany, the Netherlands and the United Kingdom) and with the participation of ISAS and NASA.
Abstract
Context. Extended Red Emission (ERE) was recently attributed to the photo-luminescence of either doubly ionized Polycyclic Aromatic Hydrocarbons (PAH++), or charged PAH dimers (PAH2]+).
Aims. We analysed the visible and mid-infrared (mid-IR) dust emission in the North-West and South photo-dissociation regions of the reflection nebula NGC 7023.
Methods. Using a blind signal separation method, we extracted the map of ERE from images obtained with the Hubble Space Telescope, and at the Canada France Hawaii Telescope. We compared the extracted ERE image to the distribution maps of the mid-IR emission of Very Small Grains (VSGs), neutral and ionized PAHs (PAH0 and PAH+) obtained with the Spitzer Space Telescope and the Infrared Space Observatory.
Results. ERE is dominant in transition regions where VSGs are being photo-evaporated to form free PAH molecules, and is not observed in regions dominated by PAH+. Its carrier makes a minor contribution to the mid-IR emission spectrum.
Conclusions. These results suggest that the ERE carrier is a transition species formed during the destruction of VSGs. PAH2]+ appear as good candidates but PAH++ molecules seem to be excluded.
Key Words.:
astrochemistry — ISM: dust — ISM: lines and bands — reflection nebulae — infrared: ISM — methods: numerical — methods: observationalO. Berne,
1 Introduction
Unveiling the composition, structure and charge state of the smallest interstellar dust particles remains one of today’s challenges in astrochemistry. Progress in this field requires a detailed analysis of the spectral signatures of these dust populations. Amongst these signatures is the Extended Red Emission (ERE), a broad emission feature ranging from 540 to beyond 900 nm and with a peak wavelength longward of 600 nm to beyond 800 nm (Smith & Witt, 2002). ERE is likely due to the photo-luminescence of carbonaceous macromolecules or nanograins exposed to UV photons (see Witt et al. 2006 and references therein). The ERE is observed in many environments exposed to UV photons (Photo-dissociation Regions; PDR) found for instance in the diffuse interstellar medium, reflection nebulae and planetary nebulae. It has been observed in galaxies, NGC 3034 (Perrin et al., 1995) and NGC 4826 by (Pierini et al., 2002).
The possible link with the carriers of the Aromatic Infrared Bands (AIBs; also called unidentified infrared bands at 3.3, 6.2, 7.7, 8.6 and 11.3 m) has been discussed by several authors. Both types of emission features, ERE and AIBs, were found to be relatively cospatial although not matching (Furton & Witt, 1990), pointing to different but related materials for their carriers (Furton & Witt, 1992). Recently, a detailed study of the spatial distribution of the ERE in the northern PDR of NGC 7023 has been performed by Witt et al. (2006) who concluded that the ERE mechanism is a two-step process involving the formation of the carrier and then the excitation of the luminescence, and proposed doubly-ionized Polycyclic Aromatic Hydrocarbons (PAHs) as plausible carriers. On the other hand, recent quantum chemistry calculations point to PAH dimers (PAH2]+) as the carrier of ERE (Rhee et al., 2007).
In this letter, we provide an efficient and non biased way to extract the ERE map in NGC 7023 from the Hubble Space Telescope (HST) data and new Canada France Hawaii Telescope (CFHT) images using a blind signal separation method. We then compare the extracted ERE map to the maps of the different mid-IR emission carriers, namely Very Small Grains (VSGs), neutral and ionized PAHs (PAH0 and PAH+), as extracted by Rapacioli et al. (2005) and Berné et al. (2007) from the Infrared Space Observatory (ISO) and Spitzer Space Telescope (Spitzer) observations.
2 Observations
2.1 Infrared observations
The analysis of the mid-IR emission of the North-West (NW) and South PDRs was first performed by Rapacioli et al. (2005) using ISOCAM-CVF data from ISO. More recent data on the NW PDR obtained with the Infrared Spectrograph (IRS) onboard Spitzer in mapping mode was analysed by Berné et al. (2007). The achieved angular resolution is 3.6” for IRS and 5” for ISOCAM.
2.2 Visible observations
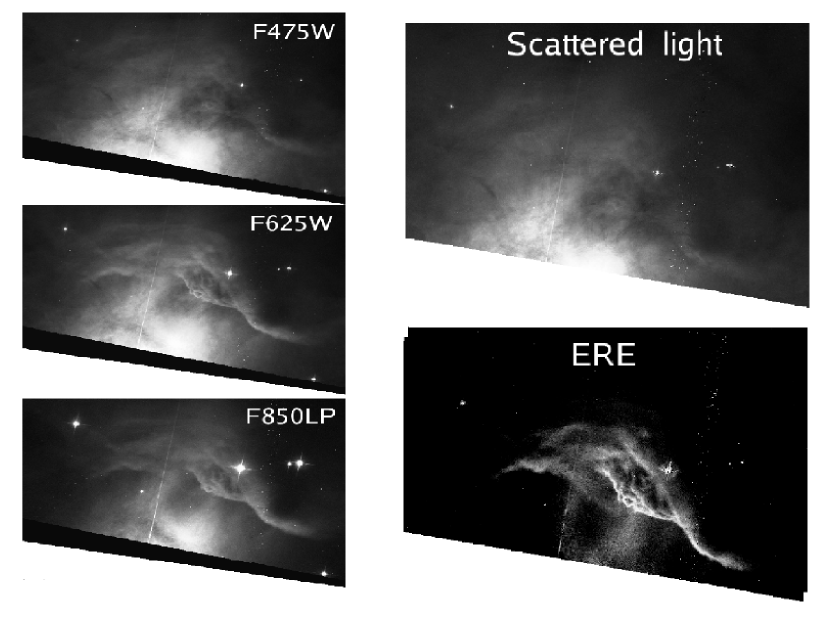
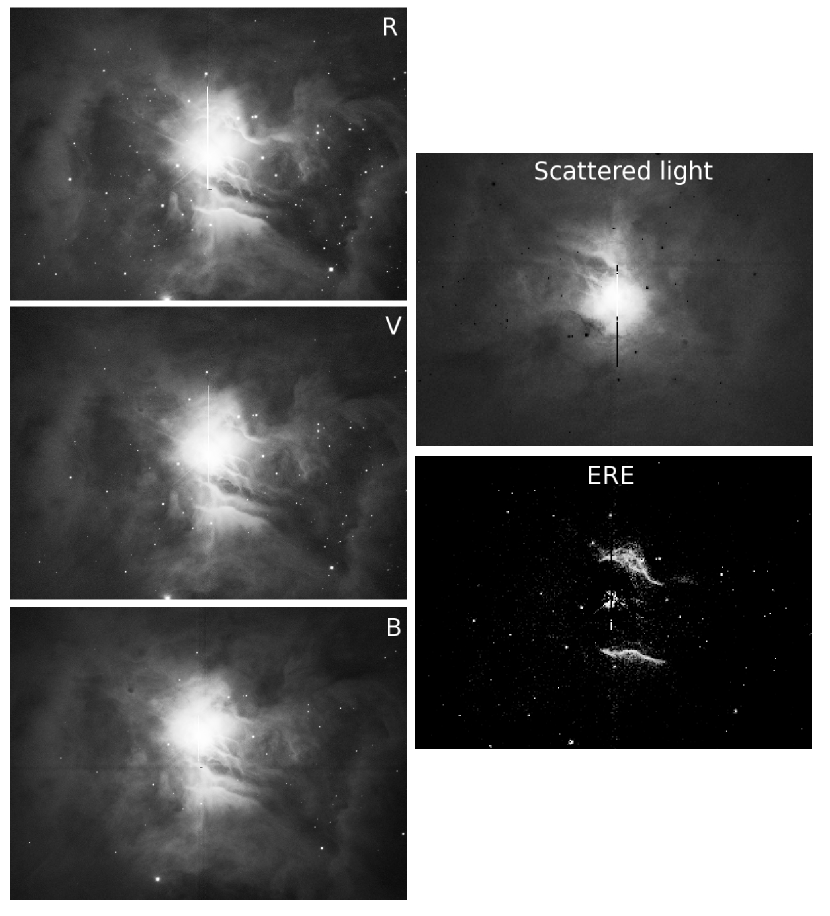
ERE was observed in NGC 7023 by Witt & Boroson (1990) and Witt et al. (2006). The NW PDR was observed with the HST by Witt et al. (2006), using the Advanced Camera for Surveys (ACS) and the Near Infrared Camera and Multi-Object Spectrometer (NICMOS). We retrieved from the archive the calibrated, geometrically corrected, dither-combined ACS images (Fig. 1) in three wide-band Sloan Digital Sky Survey filters (Smith et al., 2002): g, r, and z (respectively called F475W, F625W and F850LP on HST). The whole NGC 7023 nebula was observed in August 2002 in the B,V and R filters at the CFHT using the CFH12K CCD mosaic (Cuillandre et al., 2001) as part of the CFHT outreach program. A set of 5 dithered exposures of 60 seconds each were obtained in each filter in order to remove the mosaic gaps and other physical blemishes. No sky subtraction, nor convolution of any sort was applied to the data during the detrending and stacking process, ensuring no alteration of the intrinsic brightness features of the nebula.
3 Extraction of the ERE map
One of the difficulties in properly extracting the ERE map is to remove the contribution of the scattered light from the central Herbig Be star, HD 200775. To perform this analysis in an unbiased way, we applied a Blind Signal Separation (BSS) method successively to the ACS and CFHT images obtained in the three wide-band filters (F475W, F625W, F850LP, for ACS and B, V, R for CFHT: see Figs. 1-2). For a wide-band filter centered at , it is assumed that the observed image can be written as:
| (1) |
In this equation, it is assumed that the spatial patterns, ERE and Scattered are unknown but do not depend on wavelength. The ”mixing” coefficients and are unknown and vary with the filter central wavelength . ERE arises from the UV-illuminated layers of the cloud and therefore does not suffer from significant extinction in the studied reflection nebula. It is thus reasonable to assume that its spatial pattern (ERE in Eq. 1) is independent of wavelength. In the case of scattered light, this might not be true if strong radiative transfer is present as shown for instance by Nuzillard & Bijaoui (2000) in the case of galaxies. However, in the present object, the scattered light is subject to much less extinction than in galaxies, we therefore assume that its spatial pattern (Scattered in Eq. 1) is independent of wavelength. The BSS method we used here, called FastICA (Hyvarinen, 1999), enables us to recover the spatial patterns of ERE and scattered light using the statistical information available in the three images. FastICA uses the assumptions of independence and non-Gaussianity of the original sources (here the spatial patterns of ERE and scattered light) and thus belongs to the class of methods called Independent Component Analysis (ICA). The FastICA algorithm maximizes the non-Gaussianity of the output signals (i.e. estimations of the sources) by using a fixed-point algorithm. The extracted images of ERE and scattered light from ACS and CFHT images are presented on the right of Figs. 1 and 2 respectively. We can qualitatively compare these extracted ERE images to the one obtained by Witt et al. (2006). The images are very similar but we find a small contribution of ERE in the cavity. The CFHT and HST ERE patterns appear to be consistent with each other.
4 Linking ERE and mid-IR emission carriers
4.1 Comparing the spatial distribution of mid-IR emitting populations and ERE
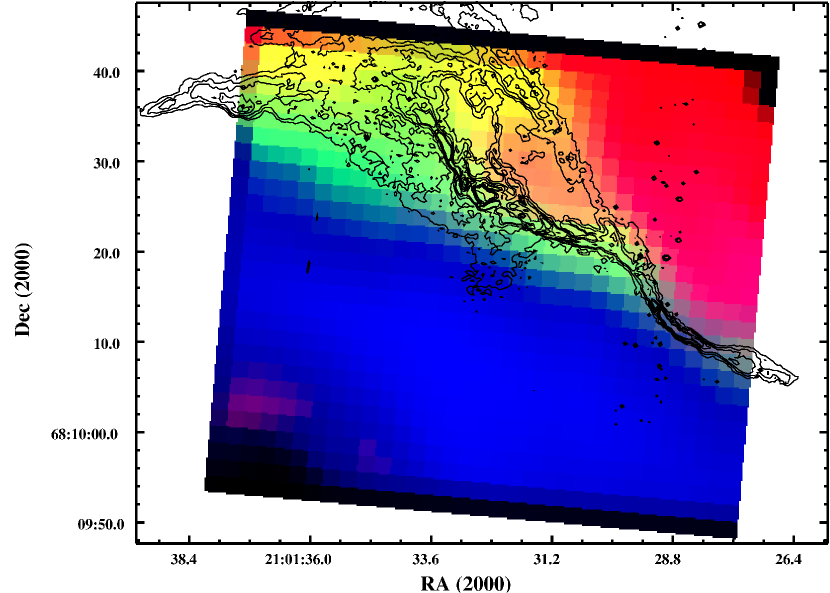
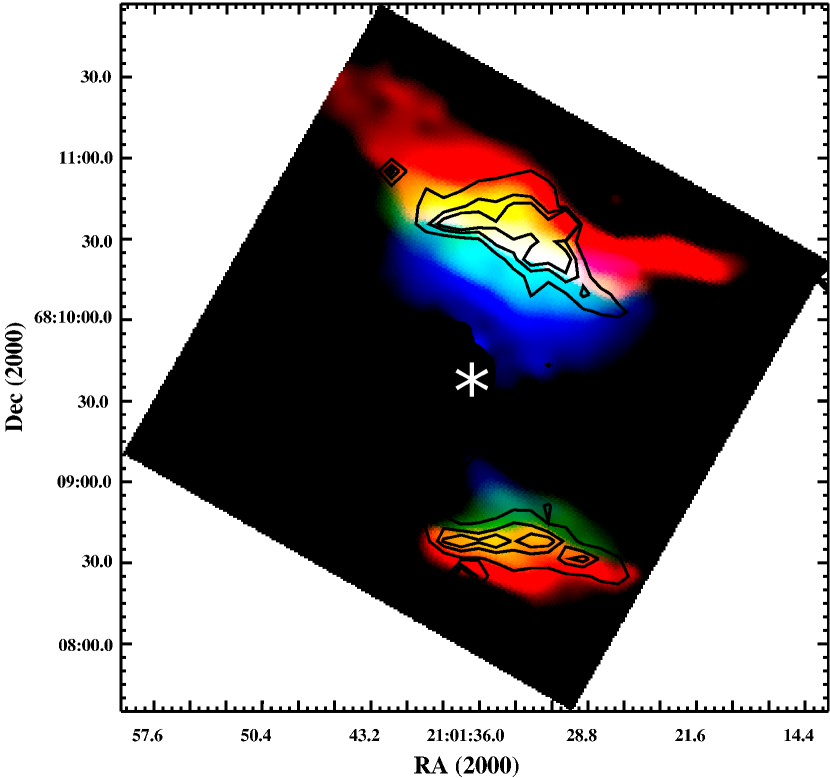
Rapacioli et al. (2005) and Berné et al. (2007) have used signal processing methods to analyse the mid-IR spectral cubes form ISO and Spitzer and extract the spectra and associated spatial distributions for the different emitting populations, VSGs, PAH0 and PAH+ as shown in Figs. 3-4. In Fig. 3, the HST ERE map was overlayed on the Spitzer maps showing that ERE arises from the region where the population identified as PAH0 dominates the mid-IR emission. In Fig. 4, we overlayed the ERE extracted from the CFHT observations on the maps extracted from ISOCAM data. The same correlation is found for the NW PDR as with Spitzer/HST, though the level of detail reached here is lower due to the lower spatial resolution of both ISOCAM vs IRS and CFHT vs HST. However, Fig. 4 provides the information on the South PDR, where again, the ERE filament is found in a region dominated by PAH0, and close to the frontier with VSGs.
4.2 Is the ERE carrier an important contributor to the mid-IR emission spectrum ?
A simple energy budget including ERE and the mid-IR emission can be made. First, we can consider that the ERE carrier is excited by photons of at least 7 eV energy. This corresponds to the mean energy absorbed by VSGs according to Rapacioli et al. (2005). If we assume that one ERE photon is emitted at an energy of about 1.7 eV (corresponding to a central wavelength of the ERE band at 680 nm detected by Witt & Boroson 1990), then the rest of the absorbed energy (5.3 eV) will be emitted in the IR. Thus, about 25 of the absorbed light is converted into ERE. Table 1 summarizes the values of the mid-IR and ERE fluxes for the regions of NGC 7023 where ERE is detected as well as for the prototypical case of the Red Rectangle. The gross ratio between ERE and mid-IR flux for NGC 7023 NW PDR is below 2 (0.4 for the South PDR). Considering the above approximation for the ratio of energy emitted in the IR vs visible for one particle, this yields a proportion of less than about of the mid-IR emission due to the ERE carrier in the NW PDR (1.2 for the South PDR ). As a comparison, in the Red Rectangle protoplanetary nebula, the strongest known source of ERE, we find that this ratio is around . This implies that the ERE carrier contributes to only a few percent of the mid-IR emission, and thus its signature will be difficult to identify in this spectral region. Following our assignment, PAH0 are excluded as possible candidates for the ERE, though they were initially proposed as potential carriers by d’Hendecourt et al. (1986).
| Mid-IR∗ | ERE∗∗ | ||
| PDR | (Wm-2sr-1) | (Wm-2sr-1) | |
| NGC 7023-S | 0.0035 | ||
| NGC 7023-N | 0.0164 | ||
| Red-Rect | 0.008 | ||
| ∗ Integrated Spitzer-IRS (5-14 m) spectrum at the positions at which ERE was observed by Witt and Boroson (1990), ∗∗ from Witt and Boroson (1990), integrated between 550 and 850 nm | |||
5 Possible carriers of ERE in NGC 7023
5.1 The case of PAH++
Using the ACS observations, Witt et al. (2006) showed that ERE is likely a two step process involving the formation of the carrier and then the excitation of the luminescence. The first step requires far-UV photons (E 10.5 eV) and supports the idea that the carrier of ERE is produced by the photo-dissociation/photo-ionization of a precursor. From this result, they proposed PAH++ as the carrier of ERE, invoking that these species have an ionisation potential above 10.5 eV and have strong absorption bands in the optical and near-UV regions. In the previous section, we have shown that the ERE in NGC 7023 arises from the region where PAH0 are abundant, which differs from the region where PAH+ are abundant. Thus, in the framework of our previous work (Rapacioli et al. 2005; Berné et al. 2007) this rules out the possibility that ERE is carried by doubly ionized PAHs as proposed by Witt et al. (2006).
5.2 The case of PAH
In a recent theoretical work (Rhee et al., 2007), it was shown that charged PAH dimers ([PAH), more specifically the subclass made of closed-shell species, can fluoresce in the ERE range with a quantum yield that is consistent with this emission. The overlays of Figs. 3 and 4 clearly show that ERE is dominant in regions where VSGs are dissociated and PAH0 species are abundant. This suggests that the ERE carrier is a transient species produced during the evaporation of VSGs. This fits well with the two-step scenario of Witt et al. (2006). Indeed, Rapacioli et al. (2006) have found that PAH clusters such as (C24H12)4 and (C24H12)13 start being dissociated into monomers at internal energies of around 10 eV. This is in agreement with the threshold of 10.5 eV set by Witt et al. (2006) for the production of the ERE carrier. Then, for ERE to be observed, the carrier should survive long enough in the PDR i.e. be reformed as efficiently as it is destroyed. PAH2]+ appear as good candidates because (1) their stability is expected to be increased relative to neutral dimers because of charge delocalization effects (Bouvier et al., 2002), (2) their abundance is favored because they constitute the final stage in the photodissociation cascade starting from larger clusters; (3) they can be reformed efficiently by collision of a neutral and ionized PAH as this process is favored by the long range ion induced dipole interaction (see discussion in Rapacioli et al. 2006). PAH+ are not abundant species in the ERE region but are present ( of total mid-IR emission). This fraction of PAH+ would be enough to lead to the reformation of PAH2]+ in regions where PAH0 are abundant. Thus, PAH2]+ are favorable candidates since they are expected to be relatively more stable and, perhaps more important, to have an efficient reformation path.
6 Conclusion
In this letter we have compared in NGC 7023 the spatial distribution of ERE and that of the mid-IR emitters : VSGs, PAH0, PAH+. We find strong evidence that the ERE carrier is produced in the region of destruction of VSGs and show that it has a negligible contribution to the mid-IR emission. We show that PAH++ are unlikely to be the carrier of ERE and conclude that PAH2]+ are attractive candidates, on the basis of qualitative arguments on the balance between photodissociation and reformation of these clusters. Further investigations are needed, following the strategy presented in this letter, but in other PDRs. Spectro-imagery of such regions in the mid-IR with a high spatial resolution is needed in order to be able to trace the thin frontier between PAHs and VSGs where small clusters are likely to be present. Finally, laboratory spectroscopic studies on PAH2]+ are needed to progress in this identification. In particular, closed-shell cation dimers as proposed by Rhee et al. (2007) deserve additional studies.
Acknowledgements.
We acknowledge the anonymous referee for his comments on the manuscript.References
- Berné et al. (2007) Berné, O., Joblin, C., Deville, Y., et al. 2007, A&A, 469, 575
- Bouvier et al. (2002) Bouvier, B., Brenner, V., Millié, P., & Soudan, J.-M. 2002, J. Phys. Chem. A, 106, 10326
- Cuillandre et al. (2001) Cuillandre, J.-C., Starr, B., Isani, S., McDonald, J. S., & Luppino, G. 2001, in Astronomical Society of the Pacific Conference Series, Vol. 232, The New Era of Wide Field Astronomy, ed. R. Clowes, A. Adamson, & G. Bromage, 398
- d’Hendecourt et al. (1986) d’Hendecourt, L. B., Léger, A., Olofsson, G., & Schmidt, W. 1986, A&A, 170, 91
- Furton & Witt (1990) Furton, D. G. & Witt, A. N. 1990, ApJ, 364, L45
- Furton & Witt (1992) Furton, D. G. & Witt, A. N. 1992, ApJ, 386, 587
- Hyvarinen (1999) Hyvarinen, A. 1999, IEEE Transactions on Neural Networks, 10, 626
- Nuzillard & Bijaoui (2000) Nuzillard, D. & Bijaoui, A. 2000, A&AS, 147, 129
- Perrin et al. (1995) Perrin, J.-M., Darbon, S., & Sivan, J.-P. 1995, A&A, 304, L21+
- Pierini et al. (2002) Pierini, D., Majeed, A., Boroson, T. A., & Witt, A. N. 2002, ApJ, 569, 184
- Rapacioli et al. (2006) Rapacioli, M., Calvo, F., Joblin, C., et al. 2006, A&A, 460, 519
- Rapacioli et al. (2005) Rapacioli, M., Joblin, C., & Boissel, P. 2005, A&A, 429, 193
- Rhee et al. (2007) Rhee, Y. M., Lee, T. J., Gudipati, M. S., Allamandola, L. J., & Head-Gordon, M. 2007, PNAS, 104, 5274
- Smith et al. (2002) Smith, J. A., Tucker, D. L., Kent, S., et al. 2002, AJ, 123, 2121
- Smith & Witt (2002) Smith, T. L. & Witt, A. N. 2002, ApJ, 565, 304
- Witt & Boroson (1990) Witt, A. N. & Boroson, T. A. 1990, ApJ, 355, 182
- Witt et al. (2006) Witt, A. N., Gordon, K. D., Vijh, U. P., et al. 2006, ApJ, 636, 303