The Compton-thick quasar at the heart of the high-redshift giant radio galaxy 6C 0905+39
Abstract
Our XMM-Newton spectrum of the giant, high-redshift () radio galaxy 6C 0905+39 shows that it contains one of the most powerful, high-redshift, Compton-thick quasars known. Its spectrum is very hard above 2. The steep XMM-Newton spectrum below that energy is shown to be due to extended emission from the radio bridge using Chandra data. The nucleus of 6C 0905+39 has a column density of and absorption-corrected X-ray luminosity of in the band. A lower redshift active galaxy in the same field, SDSS J090808.36394313.6, may also be Compton-thick.
1 Introduction
The powerful, classical double FR II (Fanaroff & Riley, 1974) radio galaxy 6C 0905+39 is unusual as it is one of the highest redshift () giant radio galaxies known, spanning on the sky (Law-Green et al., 1995) corresponding to a projected size of in the cosmology assumed in this paper. Radio galaxies have long been associated with obscured, (optically defined) Type 2 quasars, because they are considered to be the same objects as radio-loud quasars seen through an obscuring torus (e.g. Barthel 1989 and Antonucci 1993). X-ray observations are particularly efficient at detecting obscured AGN as they provide the observer with several diagnostics, such as the photoelectric cut-off, the iron line equivalent width (EW) and the X-ray to optical or [O III] ratio (e.g. Bassani et al. 1999 or, for a review, Comastri 2004). Sources with an obscuring column greater than , at which the Thomson scattering optical depth reaches unity, are known as Compton-thick AGN. It is non-trivial to calculate the column density of such sources as there is little (see Wilman & Fabian 1999) direct emission below 10 meaning that analysis relies on interpreting the reflected spectrum at lower X-ray energies. Suzaku is starting to provide a window into the X-ray regime above 10 enabling direct detection of nuclear emission in the brightest Compton-thick sources such as NGC 5728 (Comastri et al., 2007). Such sources are important since the X-ray background gives strong evidence for a significant population of Compton-thick AGN (e.g. Comastri 2004, Worsley et al. 2005).
In this paper, we present recent XMM-Newton observations of 6C 0905+39 (which is located at RA 09h08m16.9s, Dec +39d43m26s in J2000). Throughout this paper, all errors are quoted at unless otherwise stated and the assumed cosmology is , and . One arcsecond represents on the plane of the sky at the redshift () of 6C 0905+39 and the Galactic absorption along the line-of-sight is taken to be (Dickey & Lockman, 1990).
2 Data Reduction
XMM-Newton observed 6C 0905+39 on 2006 October 30 for with EPIC-pn and with each of the EPIC-MOS cameras. The data were reduced using the standard pipeline, running the SAS tools EPCHAIN and EMCHAIN for the EPIC-pn and both EPIC-MOS cameras respectively. The resulting files were filtered to remove flares, leaving of good-time for the PN, and for both MOS 1 and MOS 2 when dead-time intervals are also taken into account.
Spectra for the background (an area of sky free from sources near 6C 0905+39 on the same chip), the central source (within a circle) and the extended X-ray emission which is discussed elsewhere (Erlund et al., 2007) were extracted separately for each instrument and stacked and fitted using XSPEC v 11.3.2. Given the low number of counts in the MOS spectra, only the PN spectra were used for analysis of the core.
3 Results
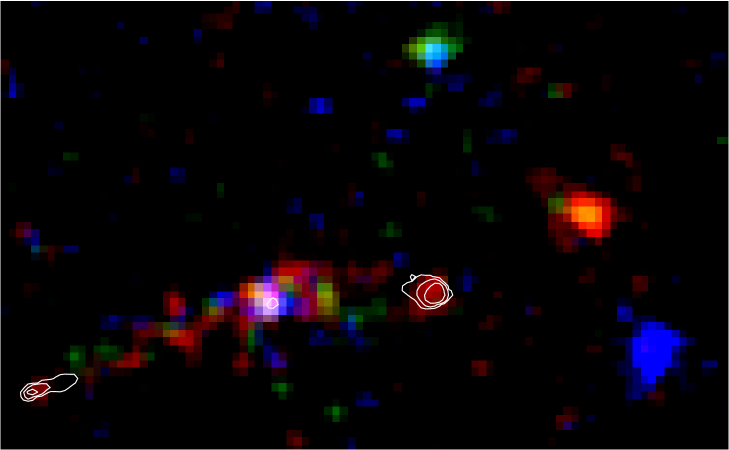
The X-ray emission extending along the radio axis over hundreds of to the east and west, which was first detected by Chandra and presented in Blundell et al. (2006), is clearly visible in the XMM-Newton data (see Fig. 1). In total there are 2566 counts (1783 background) in the source, 2125 (1624 background) in the extended emission and 441 counts (159 background) in the core in the band after summing the MOS 1, MOS 2 and the PN data. The small number of counts in the nucleus in our Chandra observation (Blundell et al., 2006) precluded any detailed analysis. All spectral data described in the present paper were fitted over the band.
3.1 The extended emission
The extended emission is discussed in detail in Erlund et al. (2007); however, we briefly mention it here in the context of its effect as a potential contaminant of the core spectrum. Fig. 1 clearly shows the extended emission from the bridge of 6C 0905+39 and that the number of X-ray photons increases towards the core. The extended emission is not jet emission (since this would be very narrow and so would not be resolved by Chandra), but inverse-Compton up-scattering of the cosmic microwave background by spent radio plasma from the lobes (Blundell et al., 2006).
The bridge spectra (excluding a 15 region around the core) were extracted from the EPIC-pn, MOS 1 and MOS 2 data and were fitted with a Galactic-absorbed power-law giving a photon index of and a normalisation of with a reduced-chisquared of with degrees of freedom (d.o.f.). The absorption-corrected X-ray luminosity of the extended emission in the band is .
3.2 The core
Only the PN data have been used in the following fits because each MOS spectrum contains roughly a quarter of the counts in the PN spectrum but a similar amount of noise. Spectral analysis shows that the MOS spectra are consistent with the PN spectrum.
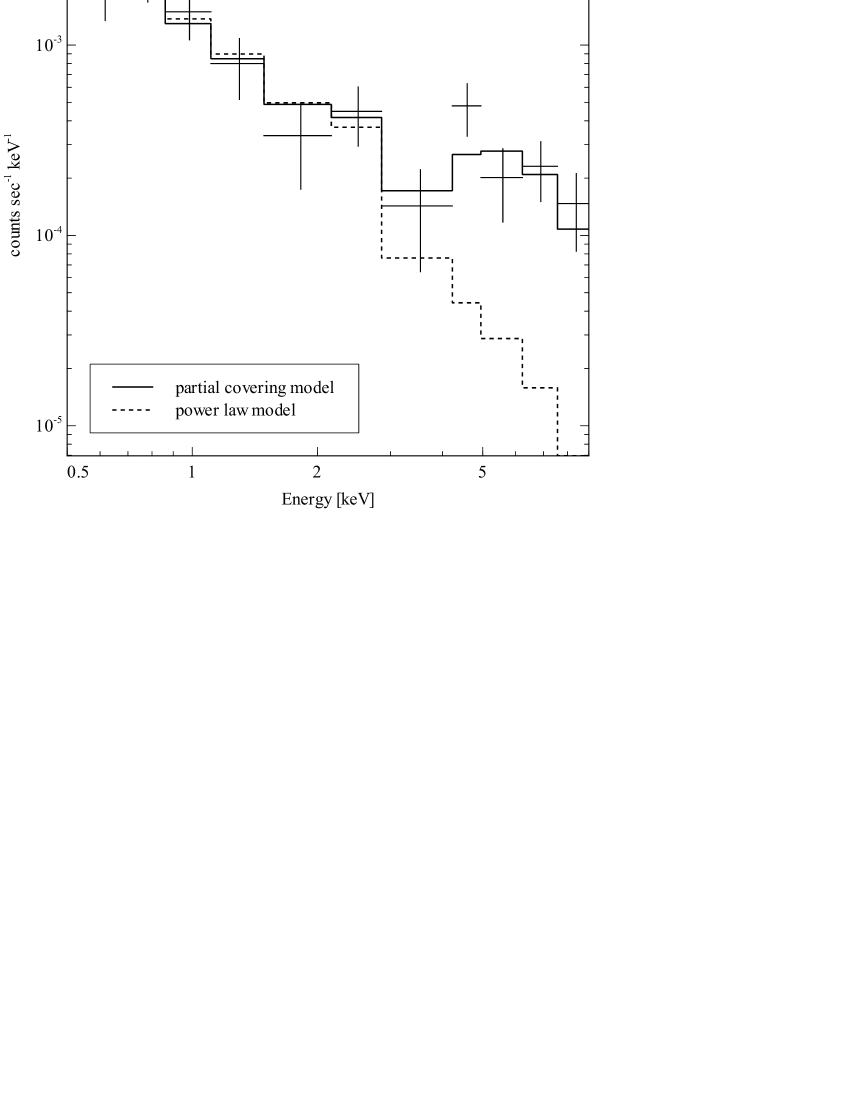
The XMM-Newton spectrum of the core is strikingly hard. A simple Galactic and intrinsic absorbed power-law is a poor fit with for d.o.f. (). The best-fit parameters give a photon index of , a normalisation of and no intrinsic absorption. The spectrum (Fig. 2) appears to have a power-law component with an excess in the hard X-rays which can, in principle, be reproduced by cold reflection (XSPEC model **[ + ]). This model is not a good fit however giving for d.o.f. () with an implausibly large amount of reflection (reflection fraction ) and a photon index of .
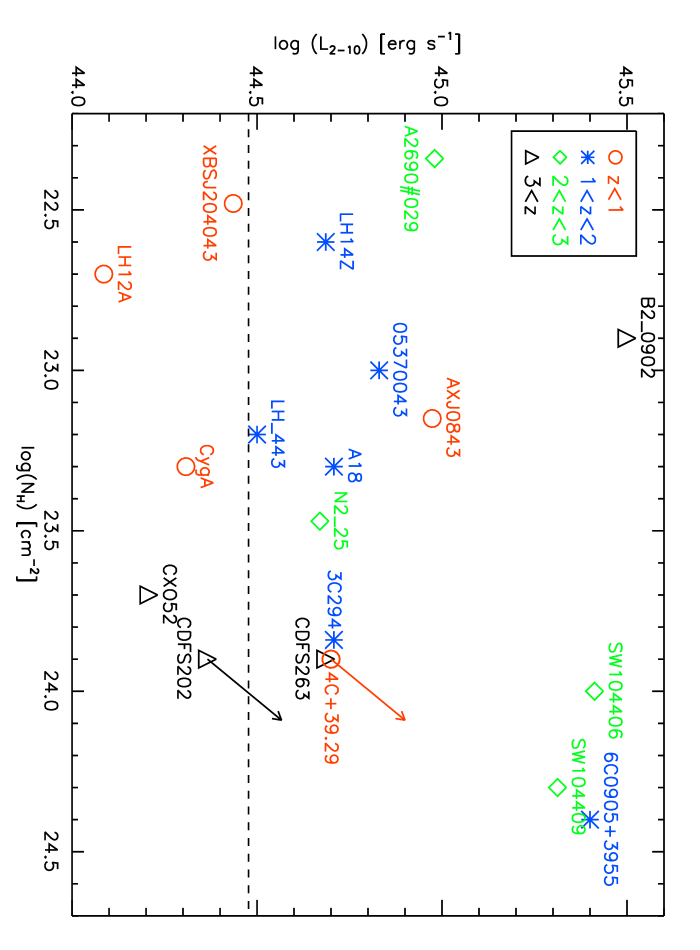
A partial-covering model with a redshifted iron line is a good fit (Fig. 2). Including an iron line, the model gives a covering fraction of , intrinsic absorption of , photon index and a normalisation of for the power-law. The redshifted iron line (modelled as a Gaussian) was fixed at 6.4 in the rest-frame of the source with , giving an equivalent width ; the normalisation of this component is . This gives with d.o.f. (). Without an iron line, the fit values are similar: a covering fraction of ; an intrinsic absorption of ; a photon index and a normalisation of , giving for d.o.f. (). Including an iron line improves the fit by , so the data marginally favour its addition. The absorption-corrected luminosity in the band for the partial covering model with an iron line is and the observed flux is (the errors are poorly constrained). The column density of 6C 0905+39 is that of a Compton-thick AGN and its luminosity implies that it is a quasar. Such Compton-thick quasars are rare, Fig. 3 (adapted from Gandhi et al. 2006) illustrates this point. It shows a selection of X-ray selected type-2 quasars which are not reflection dominated. We infer from this that 6C 0905+39 is particularly intrinsically luminous and highly obscured.
The paucity of counts in the Chandra data ( in the band) means that no analysis was performed on the original detection of the core (Blundell et al., 2006). The Chandra data are consistent with the XMM-Newton data in as much as they are incapable of constraining the spectral shape of the nucleus. However, in the 2 region extracted for the Chandra analysis there are significantly fewer soft photons than in the XMM-Newton data (15 region). To quantify this we measure the observed count-rate below 1.5, which is , and compare it to that predicted from a model of the XMM-Newton data in the same band, which gives a count-rate of . This deficit is significant at level and implies that the soft photons are from the extended emission which is less of a contaminant in the smaller Chandra aperture.
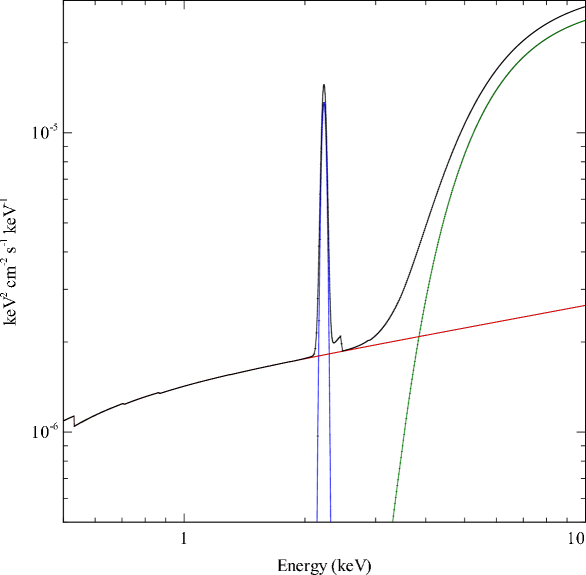
Given that there is a considerable amount of extended emission from the lobes of the radio source (clearly seen in Fig. 1) that is likely to be contaminating the XMM-Newton nucleus spectrum, we now try a highly obscured AGN with a power-law component at low energies from the extended emission. In order to test this, we fit a model consisting of Galactic absorption; a power-law with a photon index fixed to the value found for the extended emission (, see Erlund et al. 2007); an intrinsically absorbed power-law (with a photon index fixed to as the data are unable to constrain it); and a redshifted iron line with it energy fixed at and (XSPEC model ). The best-fitting model is shown in Fig. 4. The intrinsic column density is and the normalisation of this component is . The redshifted iron line has a normalisation of . This model gives a good fit to the data with for d.o.f. (); statistically the partial covering model is a slightly better fit with for d.o.f. which gives . The observed flux is . The absorption-corrected luminosity in the band of the central source is . The normalisation of the contaminating power-law is and its absorption-corrected X-ray luminosity in the band is . The luminosity of the extended X-ray emission is implying that roughly a third of the power in the emission due to inverse-Compton scattering of the cosmic microwave background comes from close to the core.
3.3 Another obscured AGN in the field?
The hard X-ray source to the west of 6C 0905+39 (the blue source in Fig. 1 located at RA 09h08m08.3s, Dec +39d43m12s in J2000 coordinates) is an SDSS source and so, following the SDSS naming convention, is SDSS J090808.36394313.6. It has a spectrum consistent with it being an obscured AGN (see Fig. 5) with column density of when the power-law component is fixed at because it is otherwise unconstrained (although varying it between reasonable values does not significantly alter the inferred value of the column density). Adding an iron line redshifted from 6.4 improves the fit from for d.o.f. to for d.o.f., i.e. by . The redshift is measured as . There are a total of 261 counts (159 background) in the band, meaning that the derived quantities are somewhat uncertain; however, as Fig. 1 shows there are very few photons below 3, this source must be a highly obscured AGN. The band observed (absorbed) flux is and the absorption-corrected X-ray luminosity in the same band is .

4 discussion
The spectral fitting of the nucleus of 6C 0905+39 presented in Section 3.2 shows that a model consisting of an obscured quasar nucleus with a contaminating power-law from the lobes is a good fit to the data. Its column density and luminosity clearly means that this is a Compton-thick quasar.
Seymour et al. (2007) have performed a Spitzer survey of 69 high-redshift radio galaxies and find that the monochromatic luminosity of 6C 0905+39 at 8 is . They do not have mid-infrared data for 6C 0905+39, but in the majority of cases where they have longer wavelength data, the spectral energy distributions (SED) of their high-redshift radio galaxies continue to rise, often by one to two orders of magnitude. Observing 6C 0905+39 at these wavelengths is important to confirm its nature as a Compton-thick quasar.
Radio galaxies have long been supposed to be radio quasars oriented closer to the plane of the sky. Given its immense linear size of nearly 1, 6C 0905+39 is likely to lie close to the plane of the sky and so, following the unification model, we are seeing the core through the torus and thus we would expect the source to be Compton-thick. This also means that beaming is unimportant.
The measured obscuring column and absorption corrected luminosity suggests that 6C 0905+39 is a genuine Compton-thick quasar. (We note that the column density measured directly from X-ray spectra depends on the geometry of the obscuring medium as shown by Matt et al. 1999. However, in the present case a simple torus geometry seems relevant.) There are very few Compton-thick quasars known at high redshift. Norman et al. (2002) detected a good Compton-thick quasar candidate in the Chandra deep field South with . Apart from such clear examples, very few Compton-thick quasars are known especially at redshift , despite the fact that obscured AGN are expected to make up per cent of the hard X-ray background and per cent should be found between , according to populations synthesis models (see e.g. Norman et al. 2002 and Gilli et al. 2001).
The absorption-corrected luminosity in the band can be converted to the bolometric luminosity using results derived by Vasudevan & Fabian (2007) who found that low and high Eddington ratio111where the Eddington ratio is defined as the bolometric luminosity divided by the Eddington luminosity AGN have a bolometric correction of and respectively. In order to determine whether 6C 0905+39 is a low- or high-Eddington source, the black hole mass is estimated using the black-hole-mass–bulge-mass relationship (Magorrian et al., 1998) and the stellar mass (measured by Seymour et al. 2007) as a proxy for the bulge mass. This gives a black hole mass for 6C 0905+39 of . This is consistent with the value calculated using the method presented in Marconi & Hunt (2003), who make use of the black-hole-mass–bulge-luminosity relation, and the K-band magnitude (from Seymour et al. 2007) along with a crude redshift correction. This assumes that such relationships hold to out to redshift which is not necessarily true, but radio galaxies at lower redshifts tend to be the hosts of similarly massive black holes (e.g. Liu et al. 2006) so this estimate seems reasonable. Using these estimates for black hole mass, 6C 0905+39 appears to fall into the high-Eddington regime () so the appropriate bolometric correction is which implies that the bolometric luminosity of 6C 0905+39 is . This means that it is a very powerful source. Compared to other powerful, obscured quasars (see Fig. 3, assuming that the measured column density is accurate), 6C 0905+39 is amongst the most powerful, (X-ray defined) type 2 quasars currently known.
Recent research has shown that high-Eddington objects tend not to be jetted (e.g. Panessa et al. 2007; Sikora et al. 2007 and Maoz 2007). However, 6C 0905+39 does not seem to be follow this trend as it is an extremely powerful source which is host to a radio source which spans on the sky and appears to still be actively fed. Its giant size indicates that it has been continuously active for at least the past ten million years. Such high-redshift giant radio galaxies may act as beacons for extremely powerful AGN.
5 conclusions
Our XMM-Newton spectrum of 6C 0905+39, which is one of the highest redshift giant radio galaxies known, shows it to contain a Compton-thick quasar. 6C 0905+39 is one of very few such sources currently known and one of even fewer at high redshift. It is likely to be a high-Eddington source with a bolometric luminosity of , making it one of the most powerful sources known.
Acknowledgements
MCE acknowledges PPARC for financial support. ACF and KMB thank the Royal Society. MCE thanks Poshak Gandhi for providing the data to recreate his figure (Fig. 3) so that 6C 0905+39 could be included and Ranjan Vasudevan for helpful discussions.
References
- Antonucci (1993) Antonucci R., 1993, ARA&A, 31, 473
- Barthel (1989) Barthel P. D., 1989, ApJ, 336, 606
- Bassani et al. (1999) Bassani L., Dadina M., Maiolino R., Salvati M., Risaliti G., della Ceca R., Matt G., Zamorani G., 1999, ApJS, 121, 473
- Blundell et al. (2006) Blundell K. M., Fabian A. C., Crawford C. S., Erlund M. C., Celotti A., 2006, ApJ, 644, L13
- Comastri (2004) Comastri A., 2004, in Astrophysics and Space Science Library, Vol. 308, Barger A. J., ed, Astrophysics and Space Science Library, p. 245
- Comastri et al. (2007) Comastri A., Gilli R., Vignali C., Matt G., Fiore F., Iwasawa K., 2007, ArXiv e-prints, 704
- Dickey & Lockman (1990) Dickey J. M., Lockman F. J., 1990, ARA&A, 28, 215
- Erlund et al. (2007) Erlund M. C., Fabian A. C., Blundell K. M., 2007, MNRAS in prep.
- Fabian et al. (2002) Fabian A. C., Crawford C. S., Iwasawa K., 2002, MNRAS, 331, L57
- Fanaroff & Riley (1974) Fanaroff B. L., Riley J. M., 1974, MNRAS, 167, 31P
- Gandhi et al. (2006) Gandhi P., Fabian A. C., Crawford C. S., 2006, MNRAS, 369, 1566
- Gilli et al. (2001) Gilli R., Salvati M., Hasinger G., 2001, A&A, 366, 407
- Law-Green et al. (1995) Law-Green J. D. B., Eales S. A., Leahy J. P., Rawlings S., Lacy M., 1995, MNRAS, 277, 995
- Liu et al. (2006) Liu Y., Jiang D. R., Gu M. F., 2006, ApJ, 637, 669
- Magorrian et al. (1998) Magorrian J. et al., 1998, AJ, 115, 2285
- Maoz (2007) Maoz D., 2007, MNRAS, 377, 1696
- Marconi & Hunt (2003) Marconi A., Hunt L. K., 2003, ApJ, 589, L21
- Matt et al. (1999) Matt G., Pompilio F., La Franca F., 1999, New Astronomy, 4, 191
- Norman et al. (2002) Norman C. et al., 2002, ApJ, 571, 218
- Panessa et al. (2007) Panessa F., Barcons X., Bassani L., Cappi M., Carrera F. J., Ho L. C., Pellegrini S., 2007, A&A, 467, 519
- Polletta et al. (2006) Polletta M. d. C. et al., 2006, ApJ, 642, 673
- Seymour et al. (2007) Seymour N. et al., 2007, ArXiv Astrophysics e-prints
- Sikora et al. (2007) Sikora M., Stawarz Ł., Lasota J.-P., 2007, ApJ, 658, 815
- Vasudevan & Fabian (2007) Vasudevan R. V., Fabian A. C., 2007, ArXiv e-prints, 708
- Wilman & Fabian (1999) Wilman R. J., Fabian A. C., 1999, MNRAS, 309, 862
- Worsley et al. (2005) Worsley M. A. et al., 2005, MNRAS, 357, 1281