Boxy/Peanut bulges and stellar bars
Abstract
Boxy/peanut bulges in disc galaxies have been associated to stellar bars. We analyse their properties in a large sample of -body simulations, using different methods to measure their strength, shape and possible asymmetry, and then inter-compare the results. Some of these methods can be applied to both simulations and observations. In particular, we seek correlations between bar and peanut properties, which, when applied to real galaxies, will give information on bars in edge-on galaxies, and on peanuts in face-on galaxies.
Inma Martinez-Valpuesta1,2 and E. Athanassoula2
1Instituto de Astrofísica de Canarias, E-38200 La Laguna, Tenerife, Spain
2LAM, Observatoire Astronomique de Marseille Provence, 2 Place Le Verrier, F-13004 Marseille, France
1. Introduction
Both simulations and theoretical studies have shown that bars are not vertically thin morphological features, but have a considerable vertical extent and a vertical structure, known as the Boxy/Peanut bulges (hereafter B/P; Combes & Sanders 1981, Combes et al. 1990). Comparisons between observations and -body simulations have established this direct connection firmer (Athanassoula 2005 and references therein). Observations have shown that both bars and B/P bulges are quite predominant in disc galaxies and that the corresponding frequencies are in good agreement with the link between the two structures (Lütticke, Dettmar & Pohlen 2000).
We measure the peanut properties in a large sample of several hundred -body simulations ran by one of us (EA) for different purposes. More information on these simulations and on their properties can be found in Athanassoula & Misiriotis (2002) and Athanassoula (2003, 2007). In particular, we seek correlations between the properties of the bar and the properties of the B/P bulge.
2. Methods for measuring bar and peanut strength and correlations
In order to measure the bar strength, we use standard Fourier decomposition and take the amplitude of the second ( = 2) component.
| (1) |
where and are the mass and azimuthal angle of particle . This can be done either globally or as a function of radius. In the former case the summation is carried out over all particles in the disc, while in the latter is the number of particles in a given cylindrical shell of radius and .
The vertical asymmetry and the strength of the B/P can be measured in a similar way, by
| (2) |
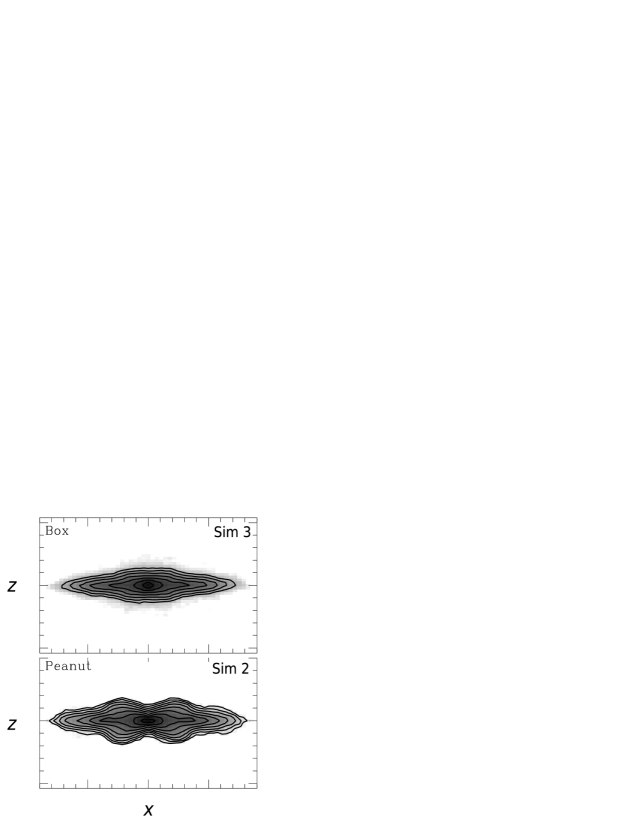
where can be either the number of particles in the disc component, or the number of particles per vertical column or cut (in which case ) and is the scale height of the initial exponential disc. In Fig. 1 we apply these two definitions to two simulation snapshots, one with a boxy bulge and the other with a peanut, or X-shaped bulge.
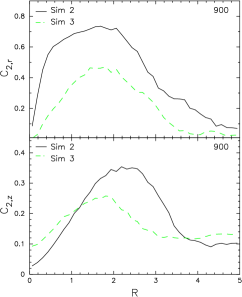
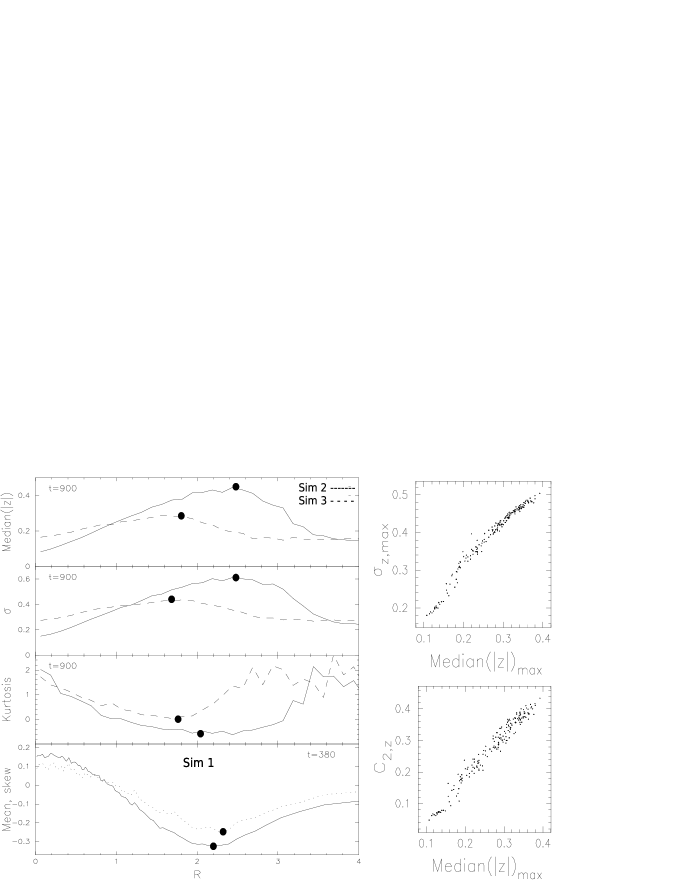
We have also applied statistical methods, based on the distribution of the coordinates of the particles in a given vertical cut (perpendicular to the equatorial plane) of a snapshot seen edge-on, with the bar viewed side-on. We use the median of the absolute values and the standard deviation () to measure the strength of the peanut, the kurtosis to measure its shape and the skewness and mean to measure the strength of the buckling event i.e. the asymmetry during the vertical instability.
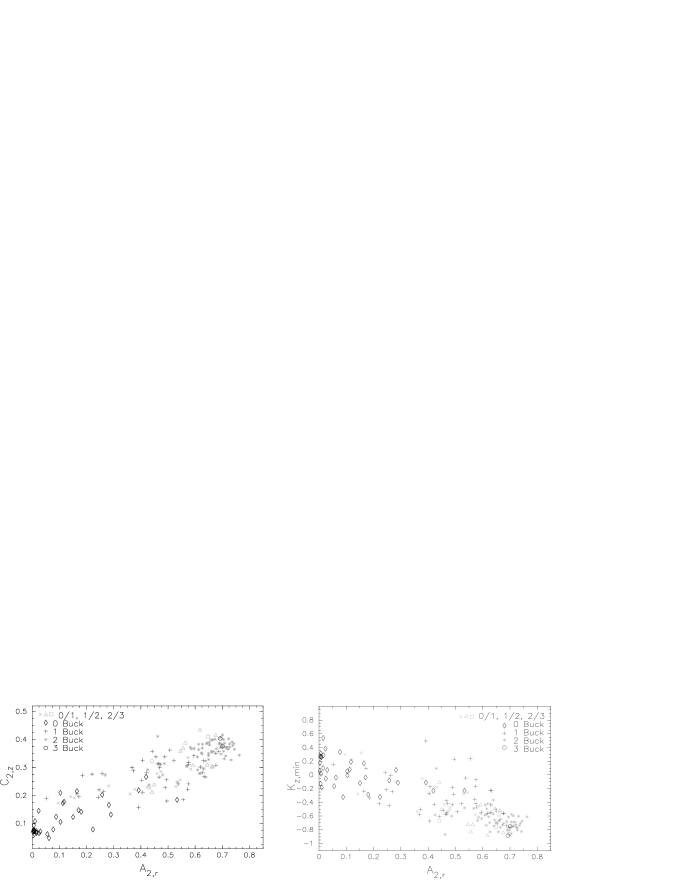
Our methods to calculate the strength of the B/P bulge correlate nicely (Fig. 2, right panels) and can also be applied to real, highly inclined galaxies. Even more interesting, we find correlations between the strength and shape of the B/P bulge with the strength of the bar (Fig. 3). Note in this figure how some simulations undergo several buckling events, as previously noted by Martinez-Valpuesta, Shlosman & Heller (2006).
3. Conclusions
We presented several methods to calculate the strength of the bar and the strength, shape and asymmetry of the B/P bulge and found strong correlations between their results. The most important correlation relates the strength of the bar with the strength of the B/P bulge, the strongest bars having the strongest peanuts. We also find that the strength of the peanut depends on the number of buckling episodes it underwent, the strongest bars having undergone more buckling episodes (Fig. 3). Finally, we find a very interesting result about , i.e. about the shape of the radial density profiles along cuts perpendicular to the equatorial plane. For strong bars, having a strong peanut or X-shaped bulge, this profile is more flat-topped, while for weaker bars, with more boxy-like bulges, it is more peaked. All the results summarized here are discussed in length by Athanassoula & Martinez-Valpuesta (2008, in preparation).
Acknowledgments.
This work has been partially supported by the Peter Gruber Foundation Fellowship and by grant ANR-06-BLAN-0172
References
- Athanassoula (2003) Athanassoula, E., 2003, MNRAS, 341, 1179
- Athanassoula (2005) Athanassoula, E., 2005, MNRAS, 358, 1477
- Athanassoula (2007) Athanassoula, E., 2007, MNRAS, 377, 1569
- Athanassoula & Misiriotis (2002) Athanassoula, E., Misiriotis, A. 2002, MNRAS, 330, 35
- Combes & Sanders (1981) Combes, F., Sanders, R. H. 1981, A&A, 96, 164
- Combes et al. (1990) Combes, F., Debbasch, F., Friedli, D., Pfenniger, D. 1990, A&A, 233, 82
- Lütticke et al. (2000a) Lütticke, R., Dettmar, R.-J., Pohlen, M. 2000a, A&AS, 145, 405
- (8) Martinez-Valpuesta, I., Shlosman, I., & Heller, C. 2006, ApJ, 637, 214