Discovery of X-ray Pulsations from the HMXB Source AXJ1749.1-2733
Abstract
We are reporting a discovery of X-ray pulsations from the source AX J1749.1-2733 with the period of 132 s based on the XMM-Newton data obtained in March 2007. The observed pulse profile has a double-peaked structure with the pulse fraction of about % in the 3-10 keV energy band. We have also found that a periodicity with practically the same period has been detected from the source by the IBIS telescope onboard the INTEGRAL observatory during an outburst on Sept. 9, 2003 in the 20-50 keV energy band. Due to the double-peaked pulse profile, there is an additional peak on both periodograms of nearly s, therefore we have also investigated the possibility that the last value is the true pulse period. The source spectrum obtained by the XMM-Newton observatory in the soft energy band is being heavily absorbed ( cm-2) due to a strong intrinsic absorption in the binary system that leads to the conclusion that AX J1749.1-2733 is a new transient X-ray pulsar in the high mass X-ray binary system.
keywords:
X-ray:binaries – (stars:)X-ray pulsars:individual – AX J1749.1-27331 Introduction
The source AX J1749.1-2733 was discovered on Sept. 19, 1996 by the ASCA space observatory (Sakano et al., 2002). The object had not been detected during previous observations of this region in 1995 even with a higher exposure and was significantly detected again only in September 1997 and March 1998, which reflects its transient nature. Due to the faintness of the source emission ( erg cm-2 s-1 in the keV energy band), it was practically impossible to obtain good restrictions to its spectral parameters, but some evidence for the strong absorption in the system was mentioned (Sakano et al., 2002).
On Sept. 9, 2003 a short (with a duration of day) outburst from the source was observed by the INTEGRAL observatory in hard X-rays with the peak flux of mCrab in the 20-60 keV energy band (Grebenev, 2004). Detailed investigations of the source behavior and its characteristics during the outburst allowed Grebenev & Sunyaev (2007) to classify AX J1749.1-2733 as a fast X-ray transient. During the outburst, the source position in hard X-rays was resolved as RA=17h 49m 07s, Dec=-2732′38″ (J2000) with the uncertainty of 1.8′ (Sguera et al., 2006), that is coincident with the source position revealed by the ASCA observatory – RA=17h 49m 10s, Dec=-2733′14″(J2000) the uncertainty of about 55″, Sakano et al. (2002). Subsequent analysis showed that the source had been significantly detected by INTEGRAL from time to time in 2004-2007, but the typical value of its flux was about mCrab. Nevertheless, based on these data, Zurita Heras et al. (2007) suggested the presence in the system of the -day orbital period. Observations of AX J1749.1-2733 performed in soft X-rays by the SWIFT observatory in 2007, allowed Kong (2007) to improve its localization to 3.8′′and revealed a strong absorption ( cm-2) in the source spectrum.
In this work, we reanalyzed the INTEGRAL data obtained during the outburst in September 2003 and analyzed the XMM-Newton data obtained in March 2007. In both data sets, strong periodic modulations of the X-ray flux with the period of 132 s were found. The preliminary results were reported by Karasev et al. (2007).
2 Observations and Data Analysis
The source AX J1749.1-2733 was observed with the XMM-Newton observatory on March 31, 2007. Our analysis was based in general on the data from the EPIC-PN camera, but the data from the MOS telescopes were used also for the test of the consistency of the used spectral models. All data were processed with the Science Analysis System (SAS)111http://xmm.esac.esa.int/sas/. We provided a standard method for the filtration of the proton flares produced as a result of the interaction between soft protons in the Earth’s magnetosphere with the telescope. The source spectrum and lightcurve were extracted from the circle with the radius of 14″ around the source; the background spectrum and lightcurve were extracted from a nearby circle region with the same radius. A total exposure of XMM-Newton/PN observations was approximately 6 ks.


As mentioned above, the source AX J1749.1-2733 had been significantly detected by the IBIS telescope several times during the four years of observation, but only once was its intensity enough to detect the pulsations. The total exposure of the INTEGRAL/IBIS observations during this outburst on Sept 9, 2003 was about 50 ks. The INTEGRAL/IBIS data for the timing analysis were processed using the standard software OSA 6.0, distributed by the INTEGRAL Science Data Center, Versoix, Switzerland222http://isdc.unige.ch, and the software designed and supported by the National Institute of Astrophysics in Palermo, Italy333http://www.pa.iasf.cnr.it/ferrigno/INTEGRALsoftware.html (Segreto & Ferrigno, 2007). For the spectral analysis, we used the software developed at the Space Research Institute RAS, Moscow, Russia (description of its main features can be found in Revnivtsev et al. (2004) and Krivonos et al. (2007)). The final timing and spectral analysis were provided with the FTOOLS package444http://heasarc.gsfc.nasa.gov/lheasoft.


3 Timing analysis
Fig.1a shows a periodogram of a background subtracted emission of AX J1749.1-2733 obtained from the XMM-Newton/PN data in the 6-10 keV energy band. The significant excess () of the -distribution at 132 s can be clearly seen. Apart from them, there are several other peaks of a lower intensity, which are mostly prominent at the periods of 66 s (the significance is ) and 198 s, which corresponds to a half and one and a half of the 132-s period, respectively. To clarify that these excesses are not artificial and connected with the source AX J1749.1-2733, we have also built a periodogram for emissions from the nearby background region. No signals with the periods of 66, 132 or 198 s were detected on this periodogram (Fig.1b). This fact indicates that the origin of the detected periodicity is connected with the source AX J1749.1-2733. The pulsations in the source emission was checked also in hard X-rays (20 keV) using the data of the IBIS telescope onboard the INTEGRAL observatory. In Fig.2a, the periodogram of the 20-50 keV source emission is shown near the periods of 66, 132, and 198 s. Similarly to the XMM-Newton results, the signal can be clearly seen again, but the significances of the and s peaks in this case are roughly the same (). The list of possible pulse periods near 66 and 132 s measured with different instruments is presented in Table 1. Errors (corresponding to ) were determined by the bootstrap method from the analysis of a large number of simulated light curves (see e.g. Tsygankov & Lutovinov (2005) for details).
Table 1. List of AX J1749.1-2733 pulse periods
Date
Observatory
Pulse Periods
Sept 9, 2003
INTEGRAL
,
March 31, 2007
XMM-Newton
,
It is important to note that in a near vicinity to the studied source there is located another transient X-ray pulsar AX J1749.2-2725 with the pulse period of 220 s (Torii et al., 1998). Due to a small angular distance (8′) between these sources, there is a possibility of a “photon-drifting” from one source to another in the processing of the data reduction of the IBIS telescope (as its angular resolution is only 12′). To check a possible influence of such an effect, we have done the same timing analysis for AX J1749.2-2725. Fig.2b shows the resulting periodogram for this source. It can be seen that significant peaks are detected neither at 132 s nor at 220 s (note that no peak near 220 s can also be seen on the AXJ1749.1-2733 periodogram, Fig. 2a). Most likely, the pulsar AX J1749.2-2725 was in the “switched-off” state during the INTEGRAL observations (Grebenev & Sunyaev, 2007) and as such, did not affect our results.

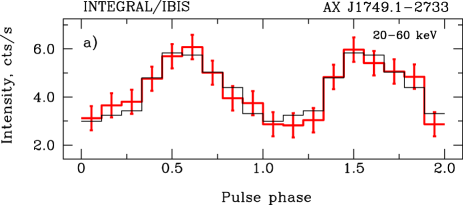
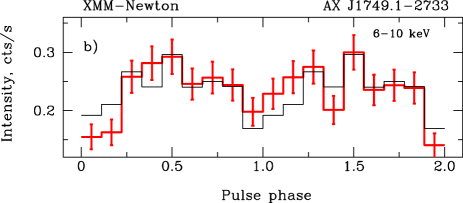
Thus, the pulsations in the source AX J1749.1-2733 can be clearly established. However, the question about the true value of its period is still relevant. In Fig.3, the source pulse phase curves obtained by XMM-Newton and INTEGRAL observatories and folded with the period of 132 s are presented for several energy bands: 3-6, 6-10, 20-30, 30-40 and 40-60 keV; due to slightly different values of the pulse period, the data of both observatories were convolved with the corresponding periods (see Table 1). The source pulse profile builded in such a way has a clear double-peaked structure at all energies that account for several peaks in the periodograms with intervals divisible by s.
To clarify which of pulse periods is true, we used the following procedure: the source pulse profile folded with the period of 131.54 s and the doubled source pulse profile folded with the period of 65.77 s obtained from the INTEGRAL/IBIS data in the 20-60 keV energy band were plotted in the same figure and compared between themselves (Fig.4a). The test clearly demonstrates that there are no significant differences between the pulse profiles obtained for these two periods, which might be due to a relatively faint emission from the source and large uncertainties in the observed count rates. To formalize this test, we used a simple criteria in the form of , where is the count rate in the th bin of the 132 s folded light curve, is the count rate in the th bin of the 66 s folded light curve, which is being used here as a model; and is the correspondence uncertainty. A summation is being done only on the half of bins (which are statistically independent) of the 132 s folded light curve (in our case, ). The application of this test to the INTEGRAL/IBIS data leads to the value of 6.8 for 9 d.o.f., which means that the difference is insignificant. This result reflects the practically equal significance of the 66-s and 132-s peaks at the correspondence periodogram (Fig.2a). The same procedure was used for the XMM-Newton data obtained in the 6-10 keV energy band. We folded them again with the corresponding periods (see Table 1) and found that the difference between the pulse profiles in this energy band is more significant (Fig.4b). Its value (22 for 9 d.o.f.) corresponds to the probability of that this difference is causal. Note that the suggested procedure is formally equivalent to the comparison of the odd and even 66 s segments on the 132 s folded light curve. Thus, the use of the XMM-Newton data brings us to the conclusion that s is the probable pulse period of the source AX J1749.1-2733.
During the XMM-Newton observations, the pulse period was slightly longer than during the INTEGRAL ones. Due to a relatively high uncertainty of the XMM-Newton period measurements, this difference is not very significant (), but if we suggest that it be connected with the real deceleration of the neutron star rotation, the formal will be about yr-1, which could be consistent with the typical rates of the pulse period change for X-ray pulsars (see e.g. Bildsten et al. (1997); Lutovinov et al. (1994)).
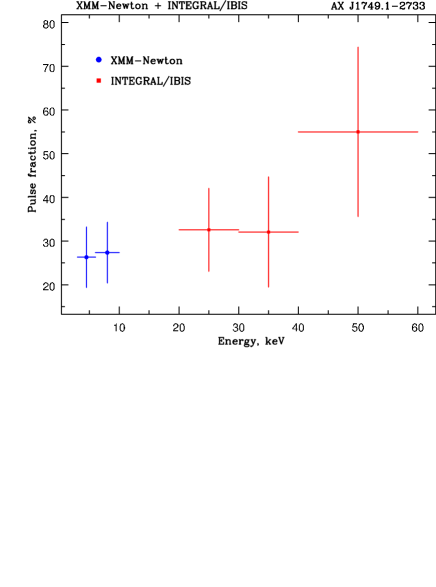
For all the energy bands (Fig.3), we calculated the pulse fraction, which is defined as , where and are background-corrected count rates at the pulse profile minimum and maximum. Fig.5 shows the energy dependence of this value for both observatories. It is clear that the pulse fraction is relatively constant in the energy band from to keV at the level of % and slightly increases up to % in hard X-rays ( keV), which is typical for X-ray pulsars (see e.g. Tsygankov et al. (2007)).
4 Spectral Analysis
It is important to note that the INTEGRAL and XMM-Newton data were obtained not only in different epochs but also in different source states — INTEGRAL had observed the source during the outburst in September 2003 and XMM-Newton had observed the source in March 2007 most likely in a quiescent state (see below). Thus, the combined spectral analysis is possible only assuming the unchanged shape of the source spectrum. However, as it was shown by Grebenev & Sunyaev (2007), the source spectrum was changing significantly even during the outburst, all the more, it can be different in the quiescent state. Therefore, here we are providing the results of the spectral analysis separately for the XMM-Newton data and only for the rough estimation of the general spectral shape and its parameters in a wide energy band where the XMM-Newton and INTEGRAL data were combined using relative normalization.

The source spectrum obtained with XMM-Newton/PN can be well described by a simple powerlaw with the photon index , the photoelectric absorption cm-2 and the unabsorbed source flux of erg cm-2 s-1 in the keV energy band (note that the use of the XMM-Newton/MOS data gives approximately the same results).
The source spectrum in the soft X-ray band ( keV) had previously been measured with the XRT telescope of the SWIFT observatory (Romano et al., 2007; Kong, 2007) and the ASCA observatory (Sakano et al., 2002). It was also approximated by the powerlaw model with the photoelectric absorption. The values of comply with the results of our analysis, but the values of are different, which can be the result of the spectral shape variations similarly as it was found by Grebenev & Sunyaev (2007) for the outburst. On the other hand, it is necessary to note that uncertainties of the photon index measurements with the SWIFT and ASCA observatories are very large and, nominally speaking, our results fall within the corresponding error boxes.
A rough estimation of the interstellar absorption in the direction to the source using the map (Dickey & Lockman, 1990) gives the value of cm-2, which is more than one order of magnitude lower than the value obtained from our spectral analysis. Based on these measurements and previous results of the ASCA and SWIFT observatories, we can undoubtedly claim that AX J1749.1-2733 is a heavily absorbed source, which is probably connected with the massive counterpart in the binary system (likely a supergiant or a giant).
The formal approximation of the XMM-Newton and INTEGRAL data simultaneously with the ”standard” pulsars model (White et al., 1983) modified by the photoelectric absorption gives the photon index of , the cutoff energy keV, the folding energy keV, the absorption column cm-2 with the corresponding value of the reduced =0.94 (Fig.6). Note, that the obtained values and the spectrum shape are typical for X-ray pulsars (see e.g. Filippova et al. (2005)) despite the roughness and a certain randomness of such a combination of the XMM-Newton and INTEGRAL data. The broadband keV X-ray fluxes corresponding to the XMM-Newton and INTEGRAL epochs of observations differ approximately by six times: ergs cm-2s-1 versus ergs cm-2s-1, respectively. The last value corresponds to the results of Grebenev & Sunyaev (2007) obtained from a combined analysis of the INTEGRAL/JEM-X and INTEGRAL/IBIS data.
5 SUMMARY
We are reporting a discovery of X-ray pulsations from AX J1749.1-2733 by the INTEGRAL and XMM-Newton observatories with the periods of 131.54 s in September 2003 and 131.95 s in March 2007, respectively. The pulse profile has a double-peaked shape in a wide energy band ( keV) and the pulse fraction slightly increases with the energy from % to %. The source spectrum can be described by the powerlaw model with the photoelectric absorption, the value of which is much higher than the interstellar one in the direction to the source. Thus, we can conclude that AX J1749.1-2733 must be a new transient X-ray pulsar in the high-mass X-ray binary system with a strong intrinsic absorption like IGR J16465-4507 (Lutovinov et al., 2005) or AX J1841.0-0536/IGR J18410-0535) (Halpern et al., 2004).
It is interesting to compare the AX J1749.1-2733 position with the position of different classes of binary sources on the Corbet diagram (Corbet, 1986). According to the relation between the orbital period of days suggest by Zurita Heras et al. (2007) and the source pulse period of 132 s, this source can belong to the class of Be-systems with the orbital eccentricity of (see eq.[1] of Corbet (1986)). But the measured value of the intrinsic absorption in the binary system is repeatedly high and larger than it is usually observed in Be-systems and is typical for supergiant systems.
Note that the INTEGRAL and XMM-Newton observations are separated in time by an approximately integer of the suggested orbital periods (). Therefore we checked the possibility that the XMM-Newton observations might have been performed also during an outburst. Using the moment of the 2003 outburst maximum MJD52891.65 (Grebenev & Sunyaev, 2007) and the orbital period value of 185 days, we determined the moment of the 2007 outburst maximum as MJD 54186.65. The XMM-Newton observations were performed later. As the 2003 outburst duration was about 1 day (Grebenev & Sunyaev, 2007), it is very unlikely, for the suggested orbital parameters, that the XMM-Newton observations were performed also during an outburst. Taking into account the measured ratio of the INTEGRAL and XMM-Newton fluxes (6 times), it is possible to combine the obtained results to suppose that the orbital period is slightly longer, days. However, this supposition requires an additional study.
This question as well as the one about the nature of the system will be addressed in detail in a separate paper with data of the AX J1749.2-2733 special observations performed with the Russian-Turkish Telescope (RTT-150) in August 2007 (Karasev at al., 2008, in preparation).
6 ANKNOWLEGEMENTS
We would like to thank E.M. Churazov for developing the IBIS data analysis algorithms, providing the software and the discussion of the timing analysis results. We extend our gratitude to S.A. Grebenev and R.A. Sunyaev for the discussion of the results and for the useful remarks. We would also like to pay tribute to the very useful comments of an anonymous referee, which allowed us to significantly improve the paper. We used data from the archive of the Goddard Space Flight Center (NASA), the Integral Science Data Centre (Versois, Switzerland), and the Russian Science Data Center for INTEGRAL (Moscow, Russia). This work was supported by the Russian Foundation for Basic Research (Project No. 07-02-01051), the Presidium of the Russian Academy of Sciences (The Origin and Evolution of Stars and Galaxies Program), and the Program of the President of the Russian Federation for the Support of Scientifc Schools (Project No. NSh-1100.2006.2). A.A. Lutovinov would like to thank the Russian Science Support Foundation as well. AL and ST thank International Space Science Institute (ISSI, Bern, Swiss) for the hospitality and partial support.
References
- Bildsten et al. (1997) Bildsten, L., Chakrabarty D., Chiu J., 1997, Astrophys Journal, 113, 367
- Corbet (1986) Corbet R., 1986, MNRAS, 220, 1047
- Dickey & Lockman (1990) Dickey J., Lockman F., 1990, Ann. Rev.Ast. Astr. 28, 215
- Filippova et al. (2005) Filippova E.V., Tsygankov S.S., Lutovinov A.A., Sunyaev R.A., 2005, Astron.Letters, 31, 729
- Grebenev (2004) Grebenev S.A., 2004, Report at the 5th INTEGRAL Workshop, Munich, February 16-20, 2004
- Grebenev & Sunyaev (2007) Grebenev S.A., Sunyaev R.A., 2007, Astron.Letters, 33, 175
- Halpern et al. (2004) Halpern J., Gotthelf E., Helfand D., 2004, Astron. Telegram, 289, 1
- Karasev et al. (2007) Karasev D., Tsygankov S., Lutovinov A., Churazov E., Sunyaev R., 2007, Astron. Telegram, 1245, 1
- Kong (2007) Kong A., 2007, Astron. Telegram, 1039, 1
- Krivonos et al. (2007) Krivonos, R., Revnivtsev, M., Lutovinov et al., 2007, A&A, 475, 775
- Lebrun et al. (2003) Lebrun F., Leray J. P., Lavocat P., et al., 2003, A&A, 411, L141
- Lutovinov et al. (1994) Lutovinov A., Grebenev S., Pavlinsky M., Sunyaev R., 1994, Astron. Lett., 20, 538
- Lutovinov et al. (2005) Lutovinov A., Revnivtsev M., Gilfanov M., et al., 2005, A&A, 444, 821
- Remillard & Smith (2002) Remillard R.A., Smith D.A., 2002, IAU Circ. 7880
- Revnivtsev et al. (2004) Revnivtsev M., Sunyaev R., Varshalovich D., et al., 2004, Astron. Lett., 30, 382
- Romano et al. (2007) Romano P., Mangano V., 2007, Astron. Telegram, 1040, 1
- Sakano et al. (2002) Sakano M., Koyama K., Maeda Y., 2002, Astrophys. Journal, 138, 19
- Segreto & Ferrigno (2007) Segreto A., Ferrigno C., 2007, arXiv:astro-ph/0709.4132
- Sguera et al. (2006) Sguera V., Bazzano A., Bird A. et al., 2006, Astrophys. Journal, 646, 452
- Tsygankov & Lutovinov (2005) Tsygankov S., Lutovinov A, 2005, Astron.Letters, 31, 88
- Tsygankov et al. (2007) Tsygankov S., Lutovinov A., Churasov E., Sunyaev R., 2007, Astron. Letters, 33, 368
- Torii et al. (1998) Torii K., Kunugasa K., Katayama K., 1998, The Astrophysical Journal, 508, 854
- White et al. (1983) White N., Swank J., Holt S., Astrophis. Journal, 270, 711
- Winkler et al. (2003) Winkler C., Courvoisier T.J.-L., Di Cocco G., et al., A&A, 411, L1
- Zurita Heras et al. (2007) Zurita Heras J.A., Chaty S., Rodriguez J., 2007, Astron. Telegram, 1035, 1