A New, Bright, Short-Period, Emission Line Binary in Ophiuchus111Based in part on observations obtained with the Hobby-Eberly Telescope, which is a joint project of the University of Texas at Austin, the Pennsylvania State University, Stanford University, Ludwig-Maximillians-Universität München, and Georg-August-Universität Göttingen.
Abstract
The 11th magnitude star LS IV has been classified previously as an OB star in the Luminous Stars survey, or alternatively as a hot subdwarf. It is actually a binary star. We present spectroscopy, spectroscopic orbital elements, and time series photometry, from observations made at the Kitt Peak National Observatory 2.1m, Steward Observatory 2.3m, MDM Observatory 1.3m and 2.4m, Hobby-Eberly 9.2m, and Michigan State University 0.6m telescopes. The star exhibits emission of varying strength in the cores of H and He I absorption lines. Emission is also present at 4686 Å (He II) and near 4640/4650 Å (N III/C III). Time-series spectroscopy collected from 2005 July to 2007 June shows coherent, periodic radial velocity variations of the H line, which we interpret as orbital motion with a period of 0.1952894(10) days. High-resolution spectra show that there are two emission components, one broad and one narrow, moving in antiphase, as might arise from an accretion disk and the irradiated face of the mass donor star. Less coherent, low-amplitude photometric variability is also present on a timescale similar to the orbital period. Diffuse interstellar bands indicate considerable reddening, which however is consistent with a distance of 100–200 pc. The star is the likely counterpart of a weak ROSAT X-ray source, whose properties are consistent with accretion in a cataclysmic variable (CV) binary system. We classify LS IV as a new member of the UX UMa subclass of CV stars.
1 Introduction
The star LS IV has , (Reed & Niemczak, 2000), and was first classified “OB” in the Luminous Stars in the Northern Milky Way catalog (Nassau & Stephenson, 1963). Later it was reclassified “sdB” by Kilkenny & Busse (1992) based on Reticon spectrograms and Strömgren photometry. Additional photometry of this object is available in the literature (Reed et al., 1998; Reed, 1998; Reed & Niemczak, 2000), but no additional spectroscopic observations have been reported. Astrometric and photometric data for this star, collected from the literature, are reported in Table 1.
We obtained spectra of LS IV as part of our program on composite spectrum hot subdwarf stars (Stark & Wade, 2003, 2005; Stark, 2005; Stark & Wade, 2006), owing to its unusually red and colors as observed in the Two Micron All-Sky Survey (2MASS; Skrutskie et al., 2006). We found that LS IV exhibits broad absorption lines with core emission, which is variable in both strength and profile shape. We obtained time-series photometry and additional spectroscopy in order to correctly classify this star.
2 Observations
2.1 Low-Dispersion Spectra
2.1.1 Kitt Peak National Observatory 2.1m Telescope
LS IV was observed from the Kitt Peak National Observatory (KPNO) 2.1m telescope using the GoldCam spectrograph during 2003 June and September. A journal of observations is given in Table 2. All exposures were between 5 and 20 minutes long. Two different spectrograph configurations were used, which covered approximately 4600–6750 Å and 6400–8900 Å at 1.3 Å pixel-1. The features observed in the GoldCam spectra include broad absorption lines with emission cores in H, H, and He I 5875 Å; emission from He I 6678 Å, He II 4685 Å, and N III/C III 4640/4650 Å. The emission components were observed to vary in both strength and profile in as little as 30 minutes (Fig. 1; see also §2.2).
All GoldCam spectra were processed using standard IRAF333IRAF is distributed by the National Optical Astronomy Observatories, which are operated by the Association of Universities for Research in Astronomy, Inc., under cooperative agreement with the National Science Foundation. routines. Unfavorable observing conditions prevented reliable flux calibrations on most nights, so we discuss only the normalized spectra. The continua were fitted by hand using splines. The equivalent widths (EWs) of features of interest were measured in each spectrum; the wavelength interval encompassed by each feature was determined by eye, noting where the line deviated from the continuum. For lines with broad absorption wings and core emission, two EW measurements were made. The first is the total EW of the whole line (absorption and emission included). The second EW refers to just the emission component, measured above the point where the emission emerges from the absorption wings, giving a lower limit for the “true” emission EW. Reported in Table 3 are the average EWs and their formal errors (not including any systematic errors or accounting for variability). Also reported are the number of measurements, their standard deviation, minimum and maximum values, and the difference between the maximum and minimum. (Note that EW indicates absorption, while EW indicates emission.)
2.1.2 Steward Observatory 2.3m Telescope
A flux-calibrated spectrum of LS IV, covering 3620–6895 Å at 3 Å pixel-1 dispersion (9 Å resolution), was obtained on UT 2002 April 3 at the Bok 2.3m telescope on Kitt Peak, Arizona, using the B&C spectrograph with a thinned, back-illuminated 1200 800 Loral CCD. This “pre-discovery” spectrum is shown in Figure 2. It extends to shorter wavelengths then the GoldCam observations, including the Balmer lines up to the series limit. A second spectrum was obtained with the same instrument setup on UT 2007 May 8 and was flux-calibrated in a homogeneous way with the first; the overall spectral energy distribution is very similar, with the flux level differing by about 3%. The H emission lines were weaker in 2007, with the emission reversal in H virtually disappearing and the height of H emission above the continuum diminishing by a factor of 2. Kilkenny & Busse (1992) classified LS IV as “sdB” based on uvby photometry and 2 Å resolution Reticon spectroscopy covering 3900–4600 Å, so H was not observed, and weak emission in the absorption core of H might easily have been overlooked or even absent. The spectral energy distribution (SED) is quite blue, even despite the reddening evidenced by the DIBs. The SED is further discussed in §3.
2.1.3 MDM Observatory 1.3m and 2.4m Telescopes
Time-series spectra of LS IV were obtained at the MDM Observatory444MDM Observatory is operated by a consortium consisting of Dartmouth College, Columbia University, Ohio State University, the University of Michigan, and Ohio University. on Kitt Peak, Arizona. Table 4 gives a journal of observations. Most of the MDM spectra were obtained using the Mark III spectrograph and a SITe 10242 CCD detector mounted on the McGraw-Hill 1.3m telescope. A 600 line mm-1 grism gave 2.3 Å pixel-1 dispersion over the range 4660–6900 Å, with a full width half maximum (FWHM) resolution of 4.1 Å. All stellar exposures were bracketed with spectra of Hg, Ne, and Xe comparison lamps, in order to track the spectrograph flexure. (In 2004 June, an attempt was made to use the night-sky emission feature to set the wavelength zero point; unfortunately, this did not work well, and those spectra are excluded from the present analysis.)
A few MDM spectra are from the Hiltner 2.4m telescope and modular spectrograph, equipped with a SITe 20482 CCD; this gave 2 Å pixel-1 dispersion from 4300 to 7500 Å, with severe vignetting toward the ends of this range. The spectral resolution of this setup was slightly better than that of the Mark III. Some of these exposures were taken in bright twilight and bracketed with comparison exposures; for those taken away from twilight, the night-sky features were used to find the zero point shift. Extensive internal checks show that this procedure worked well with this setup. Aliasing related to daily cycle count uncertainties was suppressed by pushing to large hour angles; the target’s brightness made it possible to obtain good signal-to-noise spectra even at large airmass.
Flux standard stars were observed to calibrate the instrument response, when the twilight sky was reasonably clear. Experience suggests that the zero point of the MDM spectra should be accurate to about 20%. Exposures of bright O and B stars were also obtained and used to map and correct for the telluric absorption features.
An average flux-calibrated spectrum was constructed from the 1.3m data taken in 2005 June and July. Using the IRAF sbands task and the passband tabulated by Bessell (1990), we find a synthetic magnitude of 11.47. The MDM 1.3m average spectrum is very similar to the Steward 2.3m spectrum from 2002 April in the wavelength region common to both, except the overall flux level is about 10% higher, and the emission lines are more evident (the H emission reversal protrudes slightly above the continuum; the He I 6678 line is in emission at about 15% of the intensity of H).
2.1.4 Radial Velocity Variations
All of the MDM spectra show H emission. To measure the radial velocity (RV), we convolved the line profile with the derivative of a Gaussian and took the line center to be the zero of this convolution (Schneider & Young, 1980). The width of the convolving function was optimized for a line with a FWHM of 11.5 Å, which is approximately the observed line width. We searched the velocity time series for periodicities using a “residual-gram” technique (Thorstensen et al., 1996), which is especially effective when the modulation is accurately sinusoidal. Because the data span hundreds of days, we were careful to use a sufficiently fine grid of trial frequencies. The period search yielded a single, uniquely-defined frequency near 5.12 cycle d-1; a least-squares fit to the velocities of the form
then yielded a preliminary period of 0.195290 d, with a velocity semiamplitude of 80 km s-1.
Twenty-three additional RVs were used to extend the span of RV observations and to improve the precision of the ephemeris. These were measured using the same 11.5 Å FWHM Gaussian-derivative technique, applied to high-resolution spectra from the Hobby-Eberly Telescope (HET) obtained in 2004 and 2007 (see §2.2 below). The final heliocentric H RV ephemeris, based on 163 points, is given by:
The rms residual between the data and the fitted curve is 17 km s-1. Figure 3 shows the RVs folded on the period, with the best-fitting sinusoid superposed. The periodicity in the H RVs is coherent over three observing seasons, and the velocities admit no possibility of a cycle count error — the data are consistent with a binary orbit.
2.2 High-Resolution Spectra
Follow-up observations were taken at the HET using the High Resolution Spectrograph (HRS; Tull, 1998). Owing to the declination of LS IV, it can only be observed by the HET for about one hour per night as it is transiting, from mid-April through mid-July. Queue observations of LS IV were made with the HRS using fibers (one object fiber and two sky fibers) and 23 on-chip binning, resulting in , covering the wavelength region from H to H. (Unfortunately, the 5780 DIB falls into the gap between the “red” and “blue” CCDs with this setup.) Exposure durations were 10 minutes, with the exception of the first observation of 20 min duration and a few shortened exposures obtained as LS IV approached the end of the HET track. Three or four separate exposures were obtained in quick succession on each of four nights in 2004 and three nights in 2007 (see Table 5 for a journal of observations). The typical signal-to-noise ratio was 100 at 5822 Å (range 75–120). Th-Ar lamps and flat field exposures were taken either before or after the sequence of exposures each night.
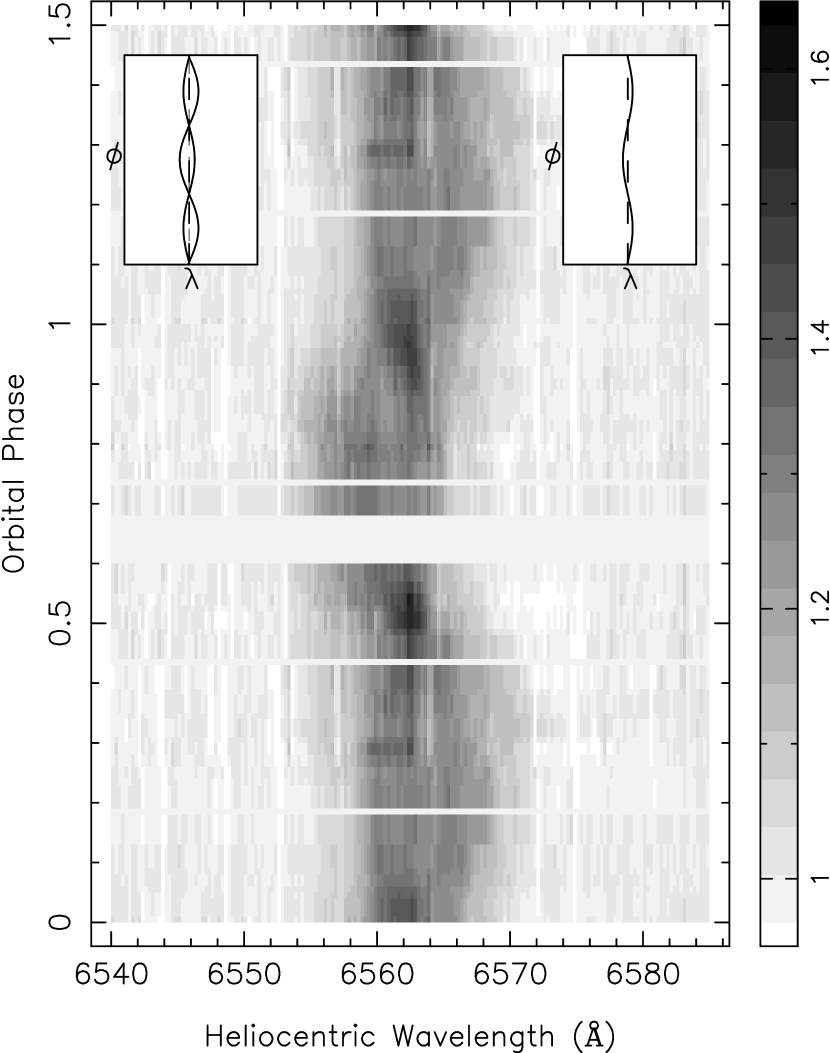
These spectra were processed with standard IRAF routines. At the dispersion of the HRS, the absorption components of the Balmer lines in the LS IV spectrum are roughly as broad as a single spectral order. Thus, a pseudo-continuum was fitted to the broad H absorption profiles, and each spectrum was normalized using this fit. The data were then rebinned in uniform heliocentric wavelength bins. Figure 4 shows the normalized H core emission profiles at several key orbital phases. As the phase varies, the profile does not simply shift back and forth in velocity, but rather changes shape. To the eye, a decomposition into a broad component and a narrow component moving in anti-phase is suggested. This is made more evident in Figure 5, which gives a trailed-spectrogram representation of all the data.
The measured EW of the H emission (above the pseudo-continuum) was roughly constant at 3.0 Å in 2004, but was lower in 2007, averaging 1.7, 2.1, and 1.8 Å on 2007 April 19, June 8, and June 22 respectively. To make Figs. 4 and 5, we have “stretched” each spectrum to achieve a uniform emission EW of 3.0 Å, keeping the continuum level at unity. In the trailed spectrogram (Fig.5), each spectrum has then been made to fill a phase range of 0.05 cycles, centered on the phase bin (bin width = 0.01 cycles) nearest to the orbital phase at mid-observation. Note that data from 2004 and 2007 have been intermingled, and different orbital phases were observed in different years. The change in EW from one year to the other may signal a change in the behavior of the profile vs orbital phase, so we caution that quantitative conclusions about these distinct narrow and broad velocity components, based on these figures, are tentative.
The phase of the broad component in the H emission profile is given by the RV ephemeris derived in §2.1.4, with the narrow component moving in anti-phase. Thus, the Gaussian-derivative method using FWHM = 11.5 Å described in §2.1.4 likely gives a “diluted” RV semiamplitude for the broad component. Given the possible change in the profile behavior between 2004 and 2007 noted above, we did not attempt to decompose each observed profile or otherwise make formal two-component fits to the high-resolution data. A rough estimate gives FWHM 8–10 and 3 Å for the broad and narrow components. Estimates of the RV semiamplitudes are and km s-1, with errors of perhaps 20 km s-1.
We tentatively identify the broad emission as arising from an accretion disk around a compact object and the narrow emission as arising from the mass donating star in a cataclysmic binary. If the narrow emission arises on the hemisphere of the mass donor that faces the disk (see §3.1), one might expect the EW of the narrow component to vary, such that the emission EW is largest when the mass donor is at superior conjunction, which is orbital phase 0.5 in our convention. We searched for this effect using the low-resolution MDM spectra from the most extensive data set (2005 July), but did not find any firm indication of an EW variation with orbital phase. The limit on the variation in the total EW is 15–20% full amplitude. It is not possible to decompose these low-resolution spectra into separate components. The high-resolution HRS spectra are unfortunately not suitable for this test, since all data collected near orbital phase 0.5 come from the 2007 observations, and all data colleced near orbital phase 0.0 come from 2004. While there is a tantalizing difference in total EW between these two observing seasons, we cannot know whether it is related to orbital phase; a more concentrated observing campaign is needed. We note that there need not be a large modulation of the EW of the narrow component, if the orbital inclination of the binary is moderate.
The H emission line profile shows behavior similar to H, with the narrow component being perhaps more pronounced (slightly higher intensity compared with the broad component). Similar behavior is also reflected in the He I 5876 emission profile, although it is weaker.
2.3 Photometry
2.3.1 Michigan State University 0.6m Telescope
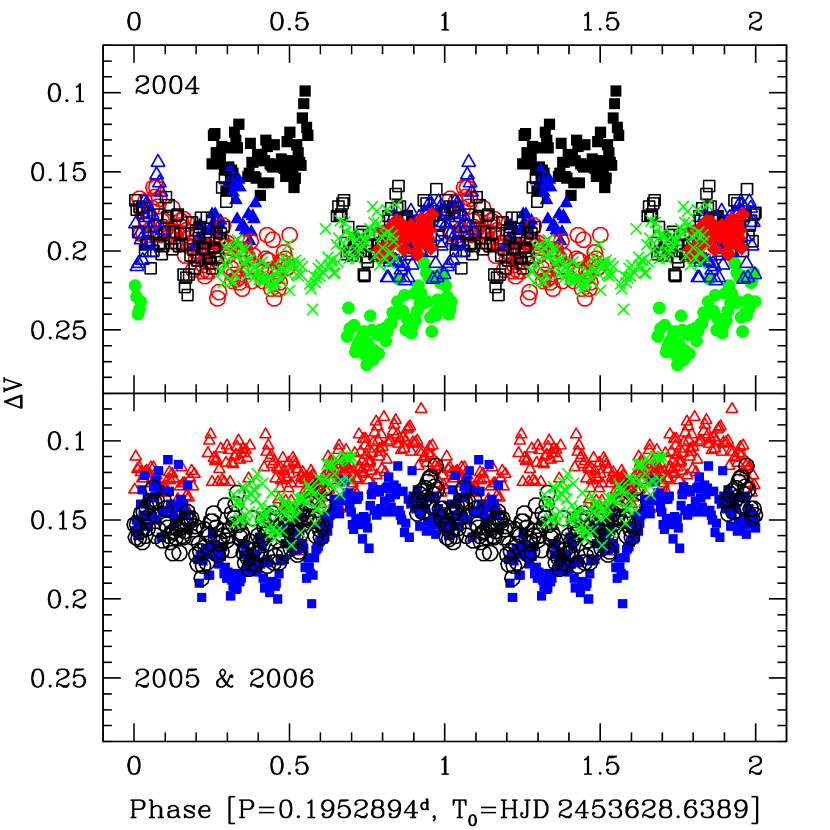
Differential band photometry of LS IV was obtained using the Michigan State University 0.6m telescope equipped with an Apogee Ap47p CCD camera. Aperture photometry for LS IV was obtained relative to the star TYC , which has , . (This star is significantly redder than the program star, but there is no blue star of comparable brightness to the target within the CCD field of view.) Observations were made on twelve nights: UT 2004 July 26; 2004 August 1, 7, 9, 16, 22, 31; 2004 September 18; 2005 July 15, 20, 23; and 2006 May 27. Exposure times were typically 30 s, varying somewhat depending on observing conditions. Observing run lengths varied from as short as about an hour to 6.3 hr on 2006 May 27, this being about the maximum run length possible at reasonable airmass from the latitude of the observatory. Calibrations were done using standard procedures and sky flats. Since observations were only taken in the filter, no transformations to the standard system involving color terms could be attempted. The typical error of a single observation is mag.
The photometry shows LS IV to be variable on both short (flickering) and long timescales, with no indication of eclipses. By itself, the photometry suggests no clear or consistent period of variation — folding the data on numerous trial periods showed many possible alias periods. Folding the data on the period derived from the RV observations (§2.1.4) does show weak modulations or waves, perhaps multi-periodic, in the brightness of LS IV (Fig. 6). The rapid modulation in that is seen in the 2005 Jul 23 data, of amplitude 0.03 mag and lasting several cycles over the phase interval 0.2–0.6, is not seen in the photometric check stars; this may be simply an instance of strong flickering. The median light level is about 0.06 mag brighter in 2005–2006 than in 2004. Additional time-series photometry, from a more southern site to permit longer nightly runs, would be desirable in characterizing the light curve and searching for persistent periodic signals.
2.3.2 Northern Sky Variability Survey
LS IV was detected as a variable star in the Northern Sky Variability Survey (NSVS; LS IV NSVS 16408817; Woźniak et al., 2004). The NSVS record shows 92 observations of this star. The typical error of a single measurement is 0.02 mag. The data are sparse, collected on 45 nights during the interval 1999 April to 2000 March, with no more than four observations per night. A light curve folded on our RV period shows no phase-dependent pattern. The median unfiltered optical magnitude is 11.855 with a scatter of 0.052 mag. The total range of observed magnitudes is 11.6980.026 to 11.9770.068. The data exhibit variations in median brightness at the 0.05 mag level with characteristic time scales of 20–40 days. Similar to the epoch-to-epoch variations seen in the MSU observations, this suggests that the system has been consistent in its photometric behavior over the period of 1999-2006.
3 Discussion
3.1 Novalike CV Interpretation
We have already suggested (§2.1.2) that LS IV could have been misclassified as a hot subdwarf (sdB) star, given only photometry and spectroscopy confined to wavelengths blueward of H. Indeed, the dwarf nova FO Per (aliases: RL 92 and RWT 92) was classified by Chromey (1979) as an sdB star, when, unbeknownst to him, it must have been near maximum light in its outburst cycle. Two Steward Observatory 2.3m spectra of FO Per, also near maximum light, obtained in 2004 Dec and 2006 Dec with the identical setup as described in §2.1.2, show a spectrum that is almost indistinguishable from a somewhat reddened sdB star, except for emission cores in H, H, and, very faintly, in the next few higher order Balmer lines, i.e., at almost exactly the same level as seen in our 2007 May spectrum of LS IV.
The SED of LS IV is considerably redder than those of known single sdB stars. Dereddening by the equivalent of or more would be required to bring the Steward SED at optical wavelengths into agreement with sdBs that have in the range 24,000 — 35,000 K. Likewise, the needed to bring the 2MASS infrared colors into the range of single sdB stars is 0.6 mag or more.
On the other hand, LS IV shares many properties with novalike variables of the UX UMa subclass. These systems show persistent broad Balmer absorption-line spectra. Ironically, these lines were once thought to indicate pressure-broadening in the atmosphere of a hot subdwarf or white dwarf — e.g., Walker & Herbig (1954) — and only later were reinterpreted as arising from an optically thick accretion disk, where they are (at least in part) kinematically broadened.
UX UMa stars also exhibit a wide range in strengths of the emission line components. Emission from combinations of H I, He I, He II, N III, and C III have all been observed at a variety of strengths in various UX UMa stars, or variable over time in a single star of the class. Emission is seen in all of these lines in LS IV, and the features are consistent with those observed in the UX UMa stars RW Sex and IX Vel (Beuermann et al., 1992; Beuermann & Thomas, 1990, respectively). For UX UMa stars, the Balmer decrement in the emission components is steeper than in the absorption lines. This can result in a situation where H is purely in emission, while higher members show progressively stronger (less filled-in) absorption troughs. This effect is seen in LS IV (Fig. 2).
Narrow Balmer emission has been found in many UX UMa systems, superimposed on the broader emission from the disk. This narrow component is attributed to irradiation of the atmosphere of the secondary star, with reprocessing of the light to Balmer emission. As discussed in §2.2, the asymmetry and variations in the emission line profile shape (Figs. 4 & 5) suggest the presence of such a component, moving in anti-phase to the broad component, as required for this interpretation.
The orbital period of d ( hours) determined for LS IV is comparable to other UX UMa systems.
3.2 Distance and Reddening
LS IV lies at galactic coordinates . The Schlegel et al. (1998) reddening maps show that the total line-of-sight extinction varies on small angular scales in this direction. We attempted to infer the color excess directly from the strength of the DIBs, using the linear relations, , established by Herbig (1975). The 5780 DIB has an EW of Å, suggesting mag with an uncertainty of at least 10%, if we are measuring the narrow component of this feature only, or mag if we are measuring the sum of the narrow and broad DIBs (the latter is more likely). The 4430 DIB has an EW of Å, corresponding to with at least 15% uncertainty. Some of the uncertainty arises, depending on whether “all-sky” or “Sco-Oph” values of are adopted. Both DIBs imply reddening less than the full Schlegel et al. (1998) column: .
The heliocentric RV of the interstellar Na I D lines is (average of D1 and D2). Most of this can be explained by the reflex of the Sun’s space motion with respect to the Local Standard of Rest, so kinematic information about the distance of the absorbing material between the Sun and LS IV is unavailable.
If LS IV is assumed to be a UX UMa variable star, how far away is it, and is this consistent with the measured reddening? We adopt an absolute magnitude and a representative apparent magnitude for LS IV. We use the standard relation to compute distance as a function of assumed . Values between 100 and 200 pc result for in the range 0.0 to 0.5 mag, smaller distances corresponding to larger reddenings. Ak et al. (2007) have put forward a calibration of for CVs, using as inputs the orbital period and the extinction-corrected 2MASS magnitude and , colors. Again varying the assumed , we find in the range 140–180 pc by this method (minimum error at fixed reddening is 40%). Comparing the 2MASS colors of LS IV and IX Vel directly, we find a reasonable match if mag. We conclude that, if in the range 0.10–0.20 mag can be accommodated within distances of 100–200 pc, the colors and magnitudes of LS IV are consistent with those of a UX UMa variable. Such reddening values within such distances are plausible along the line of sight to LS IV, according to the maps of, e.g., Perry & Johnston (1982).
3.3 ROSAT X-ray Observations
A weak X-ray source detected in the ROSAT All-Sky Survey (RASS) appears to be coincident with LS IV (RXS J; Voges et al., 1999). The count rate in the position sensitive proportional counter (PSPC) was 0.110.02 s-1, yielding an estimated 0.1–2.4 keV flux of . Taking LS IV to be the optical counterpart, the X-ray/optical flux ratio is given by .
This source was also observed serendipitously by ROSAT (WGA J; White et al., 2000) during a pointed observation of another target. In this 8000 s exposure, 150 net counts were collected, and the count rate was 0.020.002 s-1 (5 times lower than in the RASS), corresponding to and . A best-fitting blackbody spectrum has keV with an intervening hydrogen column density of cm-2, corresponding to . The unabsorbed flux is erg s-1 cm-2. Fits using a bremsstrahlung or thermal plasma emission model would result in a similar value, given the highly absorbed spectrum and the PSPC’s limited energy range and resolution. The inferred total X-ray flux is quite uncertain.
X-ray emission is not associated with sdB stars. On the other hand, CVs of all subclasses show X-ray emission. Verbunt et al. (1997) discuss the CVs detected in the RASS. A typical luminosity in the 0.5–2.5 keV band for a novalike variable is . The required distance for LS IV to have this , given its modeled flux, is pc. Using a 2 keV bremsstrahlung spectrum to model the ROSAT counts, Verbunt et al. (1997) find to be typical for novalikes. Given the uncertainties in the input spectrum and absorption column, we conclude that LS IV has X-ray properties consistent with membership in the UX UMa subclass of CVs.
4 Summary
Given the many similarities between our observations and other UX UMa novalike variables, we propose that LS IV should be classified with the UX UMa stars. Evidence supporting this classification includes the presence of emission reversals in the Balmer absorption series; other emission lines including He I, He II, and N III/C III; the variability of the emission line strengths; the intrinsically blue continuum; and the mild photometric variability. The key evidence in favor of a CV interpretation lies in the periodically modulated Doppler shifts and profiles of the emission lines, with a period of 4.7 hr, consistent with a low-mass quasi-main sequence star that fills its Roche lobe and transfers mass to a luminous accretion disk around a white dwarf. The inner hemisphere of the donor star may be irradiated by the accretion disk. Reddening and distance estimates are consistent with the CV interpretation, from the standpoint of the expected luminosity of the system and the distribution of interstellar dust in the direction of LS IV. Finally, weak X-rays are apparently associated with the system, and the X-ray luminosity and X-ray/optical flux ratio are consistent with observations of other novalike CVs.
We refrain from deriving the dynamical mass ratio of the binary or individual masses of the stars in LS IV from any of the various RV semiamplitudes that we have presented above, mainly because the HRS spectra on which such estimates would rely were obtained on widely separated dates, and the EW of the emission lines varied significantly among the various epochs. It is thus possible that one or both sites of the emission varied as well. Work aimed at determining the mass ratio is best undertaken with intensive time-series spectroscopy that can provide full orbital phase coverage in one or two nights, to minimize such variations. Likewise, we cannot offer a definitive interpretation of the photometric variability, given our present limited data. LS IV thus remains as an attractive and interesting target for further study.
Despite the apparent line-of-sight extinction to the source, LS IV is one of the brighter UX UMa stars so far discovered. Downes et al. (2001) list only three “UX Uma” systems (of two dozen catalogued) that are brighter: IX Vel, V3885 Sgr, and RW Sex. Only seven CVs of any “novalike” sub-type (89 systems total) are brighter than LS IV at their maximum light. Bright, relatively nearby systems are not only appropriate for follow-up studies, but contribute disproportionately to studies of the space density and kinematics of the various subclasses of CVs. Even though hundreds of thousands of stars that are much fainter have been observed spectroscopically by, e.g., the Sloan Digital Sky Survey, the sky has not been thoroughly explored at .
References
- Ak et al. (2007) Ak, T., Bilir, S., Ak, S., & Retter, A. 2007, New Astronomy, 12, 446
- Bessell (1990) Bessell, M. S. 1990, PASP, 102, 1181
- Beuermann et al. (1992) Beuermann, K., Stasiewski, U., & Schwope, A. D. 1992, A&A, 256, 433
- Beuermann & Thomas (1990) Beuermann, K. & Thomas, H.-C. 1990, A&A, 230, 326
- Chromey (1979) Chromey, F. R. 1979, AJ, 84, 534
- Downes et al. (2001) Downes, R. A., Webbink, R. F., Shara, M. M., Ritter, H., Kolb, U., & Duerbeck, H. W. 2001, PASP, 113, 764
- Herbig (1975) Herbig, G. H. 1975, ApJ, 196, 129
- Høg et al. (2000) Høg, E., Fabricius, C., Makarov, V. V., Urban, S., Corbin, T., Wycoff, G., Bastian, U., Schwekendiek, P., & Wicenec, A. 2000, A&A, 355, L27
- Kilkenny & Busse (1992) Kilkenny, D. & Busse, J. 1992, MNRAS, 258, 57
- Nassau & Stephenson (1963) Nassau, J. J. & Stephenson, C. B. 1963, Hamburger Sternw. Warner & Swasey Obs.
- Perry & Johnston (1982) Perry, C. L. & Johnston, L. 1982, ApJS, 50, 451
- Reed (1998) Reed, B. C. 1998, ApJS, 115, 271
- Reed et al. (1998) Reed, B. C., Carmody, P. M., & Landy, D. H. 1998, PASP, 110, 27
- Reed & Niemczak (2000) Reed, B. C. & Niemczak, P. J. 2000, PASP, 112, 69
- Schlegel et al. (1998) Schlegel, D. J., Finkbeiner, D. P., & Davis, M. 1998, ApJ, 500, 525
- Schneider & Young (1980) Schneider, D. P. & Young, P. 1980, ApJ, 238, 946
- Skrutskie et al. (2006) Skrutskie, M. F., Cutri, R. M., Stiening, R., Weinberg, M. D., Schneider, S., Carpenter, J. M., Beichman, C., Capps, R., Chester, T., Elias, J., Huchra, J., Liebert, J., Lonsdale, C., Monet, D. G., Price, S., Seitzer, P., Jarrett, T., Kirkpatrick, J. D., Gizis, J. E., Howard, E., Evans, T., Fowler, J., Fullmer, L., Hurt, R., Light, R., Kopan, E. L., Marsh, K. A., McCallon, H. L., Tam, R., Van Dyk, S., & Wheelock, S. 2006, AJ, 131, 1163
- Stark (2005) Stark, M. A. 2005, PhD thesis, The Pennsylvania State University
- Stark & Wade (2003) Stark, M. A. & Wade, R. A. 2003, AJ, 126, 1455
- Stark & Wade (2005) Stark, M. A. & Wade, R. A. 2005, in ASP Conf. Ser. 334: 14th European Workshop on White Dwarfs, ed. D. Koester & S. Moehler, 439
- Stark & Wade (2006) —. 2006, Baltic Astronomy, 15, 175
- Thorstensen et al. (1996) Thorstensen, J. R., Patterson, J. O., Shambrook, A., & Thomas, G. 1996, PASP, 108, 73
- Tull (1998) Tull, R. G. 1998, in Proc. SPIE Vol. 3355: Optical Astronomical Instrumentation, ed. S. D’Odorico, 387–398
- Verbunt et al. (1997) Verbunt, F., Bunk, W. H., Ritter, H., & Pfeffermann, E. 1997, A&A, 327, 602
- Voges et al. (1999) Voges, W., Aschenbach, B., Boller, T., Bräuninger, H., Briel, U., Burkert, W., Dennerl, K., Englhauser, J., Gruber, R., Haberl, F., Hartner, G., Hasinger, G., Kürster, M., Pfeffermann, E., Pietsch, W., Predehl, P., Rosso, C., Schmitt, J. H. M. M., Trümper, J., & Zimmermann, H. U. 1999, A&A, 349, 389
- Walker & Herbig (1954) Walker, M. F. & Herbig, G. H. 1954, ApJ, 120, 278
- White et al. (2000) White, N. E., Giommi, P., & Angelini, L. 2000, VizieR Online Data Catalog, 9031
- Woźniak et al. (2004) Woźniak, P. R., Vestrand, W. T., Akerlof, C. W., Balsano, R., Bloch, J., Casperson, D., Fletcher, S., Gisler, G., Kehoe, R., Kinemuchi, K., Lee, B. C., Marshall, S., McGowan, K. E., McKay, T. A., Rykoff, E. S., Smith, D. A., Szymanski, J., & Wren, J. 2004, AJ, 127, 2436


| Datum | Value | Reference |
|---|---|---|
| RA (J2000) | 16:56:29.62 | 2MASSaaSkrutskie et al. (2006) |
| Dec (J2000) | :34:38.7 | 2MASS |
| (mas/yr) | Høg et al. (2000)bbLS IV TYC 5642-627-1. | |
| (mas/yr) | Høg et al. (2000) | |
| Høg et al. (2000) | ||
| Høg et al. (2000) | ||
| Høg et al. (2000) | ||
| E(B V) | Schlegel et al. (1998) | |
| 11.475 | Reed & Niemczak (2000)ccBased on one measurement. | |
| (B V) | Reed & Niemczak (2000)ccBased on one measurement. | |
| (V R) | Reed & Niemczak (2000)ccBased on one measurement. | |
| 11.47 | see §2.1.4 | |
| 11.51 | Kilkenny & Busse (1992)ddBased on three measurements. | |
| Kilkenny & Busse (1992)ddBased on three measurements. | ||
| Kilkenny & Busse (1992)ddBased on three measurements. | ||
| Kilkenny & Busse (1992)ddBased on three measurements. | ||
| 2MASS | ||
| () | 2MASS | |
| () | 2MASS | |
| () | 2MASS |
| UT Date | Instrument Setup | range | Exp.Time | S/N | for S/N | |||
|---|---|---|---|---|---|---|---|---|
| Grating | Slit (′′) | Filter | (s) | (Å) | (pix-1) | (Å) | ||
| 2003 Jun | 9 | #35 | 1.5 | OG570 | 6390–8930 | 900 | 83 | 7560 |
| 2003 Jun | 11 | #35 | 1.5 | OG570 | 6390–8930 | 300 | 120 | 7560 |
| 2003 Jun | 14 | #26new | 1.3 | GG385 | 4600–6730 | 1200/1200aaTwo exposures were taken. The mid-exposure times were separated by 76 minutes. | 300/300 | 5665 |
| 2003 Sep | 14 | #35 | 1.5 | OG570 | 6390–8930 | 300 | 73 | 7560 |
| 2003 Sep | 15 | #35 | 1.5 | OG570 | 6390–8930 | 300/600bbTwo exposures were taken. The mid-exposure times were separated by 25 minutes. | 102/145 | 7560 |
| 2003 Sep | 17 | #26new | 1.3 | GG385 | 4600–6730 | 450 | 174 | 5665 |
| 2003 Sep | 19 | #26new | 1.3 | GG385 | 4600–6730 | 450 | 125 | 5665 |
| Feature | (Å) | aaAverage of all EW measurements (Å), negative values indicate emission. | bbFormal error on the average EW (Å), does not include any systematic errors. | S.D.ccStandard deviation of the measurements of the EW (Å). | MinddMinimum/maximum EW value measured (Å). | MaxddMinimum/maximum EW value measured (Å). | eeDifference between the maximum value and minimum value of EW measured (Å). | NffNumber of individual measurements of the line. | FWHMggAverage FWHM of the feature (Å). |
|---|---|---|---|---|---|---|---|---|---|
| N III/C III | 4650 | 0.07 | 0.08 | 0.17 | 4 | 11.90 | |||
| He II | 4685.7 | 0.06 | 0.04 | 0.09 | 4 | 8.78 | |||
| H total | 4861.3 | 0.11 | 0.29 | 0.70 | 4 | 26.15 | |||
| H em | 4861.3 | 0.05 | 0.09 | 0.18 | 4 | 7.64 | |||
| He I+Na I D (I.S.)hhHe I 5875.6 Å and Na I 5889.9, 5895.9 Å are significantly blended; measurements of these lines are very uncertain. | 5876 | 0.08 | 0.25 | 0.49 | 4 | 7.09 | |||
| He I totalhhHe I 5875.6 Å and Na I 5889.9, 5895.9 Å are significantly blended; measurements of these lines are very uncertain. | 5875.6 | 0.06 | 0.17 | 0.37 | 4 | 1.29 | |||
| He I em | 5875.6 | 0.05 | 0.06 | 0.11 | 4 | 6.68 | |||
| H total | 6562.8 | 0.22 | 0.76 | 2.00 | 8 | 8.50 | |||
| H em | 6562.8 | 0.13 | 0.33 | 0.87 | 8 | 10.38 | |||
| He I | 6678.1 | 0.09 | 0.04 | 0.13 | 8 | 6.30 | |||
| O IiiBlend of individual components at 7772.0, 7774.2, and 7775.4 Å. | 7774 | 0.13 | 0.13 | 0.28 | 4 | 7.95 |
| Date | HA start | HA end | Telescope | |
|---|---|---|---|---|
| (UT) | [hh:mm] | [hh:mm] | ||
| 2005 Jul 02 | 2 | 1:41 | 1:04 | 1.3m |
| 2005 Jul 03 | 1 | 1:26 | 1:26 | 1.3m |
| 2005 Jul 07 | 5 | 1:35 | 1:14 | 1.3m |
| 2005 Jul 08 | 1 | 1:44 | 1:44 | 1.3m |
| 2005 Jul 09 | 1 | 1:40 | 1:40 | 1.3m |
| 2005 Jul 10 | 1 | 1:48 | 1:48 | 1.3m |
| 2005 Jul 11 | 9 | 1:46 | +3:11 | 1.3m |
| 2005 Jul 12 | 22 | 1:46 | +3:46 | 1.3m |
| 2005 Sep 03 | 5 | +1:27 | +3:29 | 1.3m |
| 2005 Sep 07 | 3 | +1:29 | +1:37 | 1.3m |
| 2005 Sep 08 | 2 | +3:19 | +3:35 | 1.3m |
| 2005 Sep 09 | 9 | +1:26 | +2:27 | 1.3m |
| 2005 Sep 12 | 2 | +1:27 | +1:34 | 1.3m |
| 2005 Sep 13 | 3 | +1:29 | +1:42 | 1.3m |
| 2005 Sep 15 | 4 | +1:38 | +1:57 | 1.3m |
| 2006 Jan 17 | 12 | 3:58 | 3:11 | 1.3m |
| 2006 Jan 18 | 11 | 3:47 | 3:01 | 1.3m |
| 2006 Jan 21 | 9 | 3:20 | 2:46 | 1.3m |
| 2006 Mar 16 | 13 | 2:43 | 1:49 | 1.3m |
| 2006 Mar 17 | 10 | 0:47 | +0:09 | 1.3m |
| 2005 Mar 19 | 1 | 1:21 | 1:21 | 2.4m |
| 2005 Jun 29 | 2 | 2:14 | +1:52 | 2.4m |
| 2005 Jun 30 | 1 | 2:26 | 2:26 | 2.4m |
| 2005 Jul 01 | 1 | 2:21 | 2:21 | 2.4m |
| 2005 Sep 03 | 1 | 2:34 | 2:34 | 2.4m |
| 2005 Sep 08 | 1 | 1:55 | 1:55 | 2.4m |
| 2006 Mar 17 | 1 | 3:13 | 3:13 | 2.4m |
| 2006 Jun 20 | 4 | +0:01 | +0:10 | 2.4m |
| 2006 Jun 22 | 1 | 1:16 | 1:16 | 2.4m |
| 2006 Jun 23 | 1 | +0:43 | +0:43 | 2.4m |
| 2006 Sep 01 | 1 | +2:30 | +2:30 | 2.4m |
| UT at Start of Exposure | Exp | PhaseaaHeliocentric orbital phase at the mid-point of the exposure, determined from the RV ephemeris (§2.1.4). | |
|---|---|---|---|
| (sec) | |||
| 2004 May 24 | 7:24 | 1144bbThe first two exposures taken on 2004 May 24 were inadvertently combined at the telescope into a single 1144 s equivalent exposure. Start time is for the first observation. | 0.161 |
| 7:45 | 600 | 0.219 | |
| 7:55 | 600 | 0.256 | |
| 2004 May 29 | 7:14 | 600 | 0.713 |
| 7:30 | 600 | 0.769 | |
| 7:40 | 410 | 0.800 | |
| 2004 May 31 | 7:15 | 600 | 0.956 |
| 7:25 | 600 | 0.994 | |
| 7:36 | 468 | 0.027 | |
| 2004 Jun 1 | 6:52 | 600 | 0.997 |
| 7:03 | 600 | 0.035 | |
| 7:13 | 600 | 0.072 | |
| 7:24 | 600 | 0.110 | |
| 2007 Apr 19 | 9:43 | 600 | 0.470 |
| 9:53 | 600 | 0.508 | |
| 10:04 | 600 | 0.545 | |
| 10:14 | 600 | 0.583 | |
| 2007 Jun 8 | 6:32 | 600 | 0.831 |
| 6:42 | 600 | 0.869 | |
| 6:53 | 600 | 0.906 | |
| 7:03 | 600 | 0.944 | |
| 2007 Jun 22 | 5:28 | 600 | 0.293 |
| 5:39 | 600 | 0.330 | |
| 5:50 | 600 | 0.368 | |
| 6:00 | 600 | 0.406 | |