Accretion properties of T Tauri stars in Ori ††thanks: Based on observations collected at the European Southern Observatory, Chile. Program 078.C-0382.
Accretion disks around young stars evolve in time with time scales of few million years. We present here a study of the accretion properties of a sample of 35 stars in the million year old star-forming region Ori. Of these, 31 are objects with evidence of disks, based on their IR excess emission. We use near-IR hydrogen recombination lines (Pa) to measure their mass accretion rate. We find that the accretion rates are significantly lower in Ori than in younger regions, such as Oph, consistently with viscous disk evolution. The He I 1.083 m line is detected (either in absorption or in emission) in 72% of the stars with disks, providing evidence of accretion-powered activity also in very low accretors, where other accretion indicators dissapear.
Key Words.:
Stars: formation - Accretion, accretion disks1 Introduction
At the time of their birth, circumstellar disks are present around most (if not all) stars of mass lower than few solar masses. The fraction of stars with disks decreases with time, from being close to 100% in the youngest regions to less than few percent after Myr (e.g., Hernández et al. Hea07 (2007) and references therein). By the time a region is 10 Myr old, all the “classical” (i.e., gas-rich, optically thick) disks have disappeared. On similar timescales, all other indications of accretion-powered activity, such as accretion and ejection of matter, disappear as well (e.g., Kenyon et al. Kea05 (2005); Mohanty et al. Mea05 (2005); Barrado y Navascués and Martín BNM03 (2003)). These time scales are consistent to zero order with viscous disk evolution (Hartmann et al. Hea98 (1998)), although many other processes may play a role in disk dissipation (e.g., Hollenbach et al. Hol00 (2000)).
Recently, the discussion on how disks evolve has gained new momentum from the large surveys of star forming regions obtained with Spitzer, which provide measurements of the fraction of stars with disks based on well-defined, statistically significant samples. Particularly interesting is the new class of “evolved” disks, of which very few were known from ground-based photometry (Skrutskie et al. Skea90 (1990)). They are objects with IR excess emission weaker than typical classical T Tauri stars (CTTS); a fraction of these are so-called transitional disks, i.e., objects with no near-IR excess, but excess emission at longer wavelengths. The fraction of evolved disks is larger in older regions (Hernández et al. Hea07 (2007)). The weak emission of evolved disks may be the result of grain coagulation and settling (D’Alessio et al. Dal06 (2006), Dullemond and Dominik Dul05 (2005)). Transitional objects are likely disks where small grains have been cleared from the inner regions, and the discussion on their relevance for disk evolution (do all disks disappear from inside out?) is open.
Another indication of the presence of disks is given by the accretion-powered phenomena that go under the label of accretion activity (UV veiling, line emission and absorption from infalling and ouflowing gas, etc.). From them, it is possible to measure the mass accretion rate from the disk onto the central object, a crucial quantity for constraining the physical properties of accretion disks. Recently, Sicilia-Aguilar et al. (SAea06b (2006)) measured the mass accretion rate in a number of stars of different age from Taurus, Oph, Cha I, TW Hya and Tr 37 and found that decreases steadily with time, roughly as . Such a trend is consistent with the expectations of viscous disk evolution (Hartmann et al. Hea98 (1998)).
The sample used by Sicilia-Aguilar et al. (SAea06b (2006)) is based on individual stellar ages and includes only few stars in each region, with the exception of Tr 37, which contributes more than half of the total. The mass range of the stars with measured accretion rate in Tr 37 (which has a distance of 900 pc) is shifted toward higher mass than the other, closer regions. We think that it is important to measure mass accretion rates in large numbers of stars in different regions over a large range of average ages. This is because there is evidence that, in addition to the time dependence, other parameters, not identified so far, are likley to affect disk evolution, as shown by the Muzerolle et al. (Mea03 (2003)) and Natta et al. (Nea06 (2006)) studies of accretion in Taurus and Ophiuchus. These authors have shown that, firstly, the accretion rate depends on the mass of the central object and that, at the same time, there is a large range of disk and accretion properties even for stars of similar mass and age in the same star forming region. Moreover, there is evidence that the disk lifetime is shorter for more massive stars (Hillenbrand et al. Hil98 (1998); Carpenter et al. Cea06 (2006); Lada et al. Lea06 (2006); Hernández et al. Hea07 (2007); Dahm and Hillenbrand DH07 (2007)).
We are interested in extending the studies of the accretion properties of young stars to older regions, to see how they change with time and, more specifically, if both the correlation between accretion rate and central mass and the large spread of accretion rates remain unchanged in time. In this paper, we present the first results of a study of the accretion properties of CTTS in Ori. The Ori cluster is located at a distance of pc and has an age of Myr. It contains more than 300 stars, ranging in mass from the bright, massive multiple system Ori itself (spectral type O9.5) to brown dwarfs. The Ori region has been extensively studied over the last few years in the optical, X-ray and infrared (e.g., Kenyon et al. Kea05 (2005); Zapatero-Osorio et al. Zea02 (2002); Franciosini et al. Fea06 (2006); Oliveira et al. Oea04 (2004), Oea06 (2006); Caballero C07 (2007); Caballero et al. Cea07 (2007)). Spitzer has recently produced a complete census of the stellar population down to the brown dwarf regime (Hernández et al. Hea07 (2007)). These authors find that the fraction of stars that retain classical (i.e., flared, gas-rich) disks (i.e., bona-fide Class II objects) vary from about 10% for stars with mass M⊙ to about 35% for T Tauri stars (TTS) and brown dwarfs (BDs). A relatively large fraction of TTS, about 15%, have evolved disks; 7 of these are candidate transitional disks. The large and well characterized sample of Class II and evolved disks in Ori makes it particularly suited to study the properties of accretion and disks for an intermediate age stellar population.
We determine the accretion rate from the luminosity of the IR hydrogen recombination lines, Pa and Pa in particular. The reliability of this method has been discussed by Muzerolle et al. (Mea98 (1998)), Natta et al. (Nea04 (2004)) and Calvet et al.(Cea04 (2004)) and applied by Natta et al. (Nea06 (2006)) to a complete sample of IR-selected Class II stars in the young, embedded star forming region Oph. Although for the optically visible objects in Ori other methods of measuring the accretion rate could (and should) be used, we consider that the comparison between different regions is more significant if the same method is used in all cases.
We discuss the properties of our Ori sample in §2, which also presents details of the observations and data reduction. The results are presented in §3. The accretion rate measurements and their implications are discussed in §4. Summary and conclusions follow in §5.
2 Sample, observations and data Reduction
2.1 The sample
Our sample contains 35 TTS with evidence of accretion and/or disks. We selected them from two different sources. The first is Oliveira et al. (Oea04 (2004), Oea06 (2006)), who detected a K-L’ color excess, very likely due to a circumstellar disk, in about 25 Ori TTS. The other source is the high spectral resolution spectral survey of Sacco et al. (Sea07 (2007)), who detected a total of 28 stars with broad H lines (10%FW200 km/s), indicative of accretion. We imposed a limiting magnitude J14.5, to achieve the required signal-to-noise. Our sample includes 18 of the 23 Oliveira et al. sources above the J limit, and 22/28 of the broad H stars; 5 stars (number #5, #6, #8, #14 and #22 in Table LABEL:table_1) are in common (they have both K-L’ color excess and strong H), for a total of 35 objects. Sacco et al. (Sea07 (2007)) confirm the membership of the 22 stars in their sample; none is found to be binary.
After completion of our observations, Hernández et al. (Hea07 (2007)), published the results of their Spitzer survey of the Ori region. Of our 35 objects, 32 lie in the surveyed field. Based on the shape of their spectral energy distribution (SED) in the near and mid-IR, 26 of them are classified as Class II, or classical TTS (CTTS), i.e., objects with gas-rich, flared disks extending close to the star; 4 are Class III (i.e., TTS with no evidence of disk) and 2 (#28 and #29) are evolved disks, i.e., objects with IR excess weaker than typical CTTS. In the following, we will analyze them together with the Class II objects and use the definition of Class II for the whole disk sample (but see §4.4). The SED classification is given in Table LABEL:table_1. Three stars, #1, #13, and #33, are not in the fields observed by Hernández et al. (Hea07 (2007)). We classify them as Class II based on the presence of a K-L’ excess (Oliveira et al. Oea04 (2004); Oea06 (2006)); in one case (#1) the excess is at the 2.5 level, and the classification uncertain.
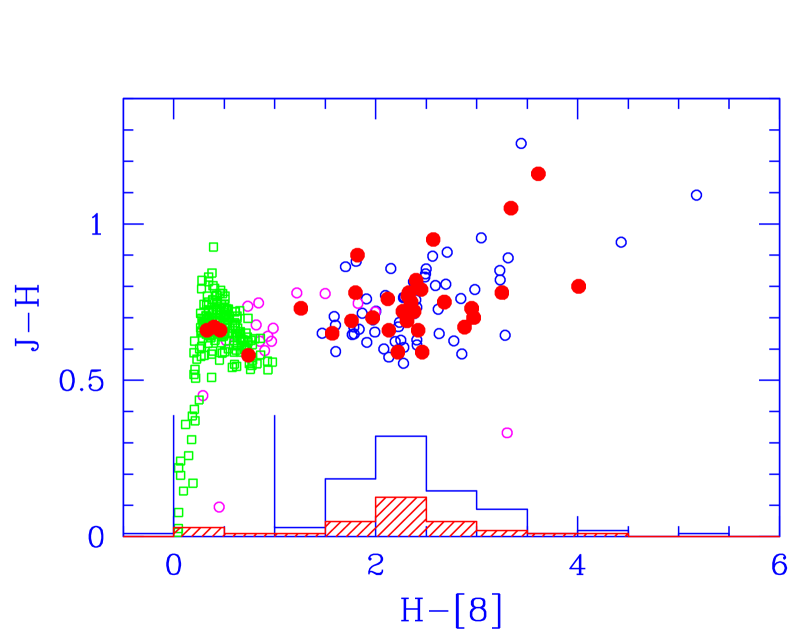
Within our J-magnitude limit (J14.5), our sample of disk objects contains about 30% of the Ori members with evidence of disks from the Spitzer survey. Their distribution in color and magnitude is very similar to that of the parental population (see Fig. 1), so that we consider our total sample of 31 Class II objects to be representative of the whole disk population.
| Obj | Spitz. | RA | DEC | J | ST | Cl. | L∗ | M∗ | Teff | Pa | Pa | HeI | Lacc | |
|---|---|---|---|---|---|---|---|---|---|---|---|---|---|---|
| # | # | (2000) | (2000) | (mag) | (L⊙) | (M⊙) | (K) | () | () | () | (L⊙) | () | ||
| 1 | – | 5:37:56.1 | -2:09:26.7 | 13.90 | M4.5 | II | 0.04 | 0.16 | 3075 | 0.5 | 0.6 | -3.5 | -10.4 | |
| 2 | 283 | 5:37:58.4 | -2:41:26.2 | 13.28 | M5.0 | III | 0.07 | 0.12 | 3000 | 0.5 | 0.4 | -3.4 | -10.0 | |
| 3 | 451 | 5:38:18.9 | -2:51:38.8 | 12.83 | M3.0 | II | 0.12 | 0.25 | 3350 | 0.5 | 2.00.4 | 1.70.3 | -2.2 | -9.1 |
| 4 | 462 | 5:38:20.5 | -2:34:09.0 | 12.65 | M4.0 | II | 0.13 | 0.16 | 3150 | 0.4 | 0.3 | -3.2 | -9.8 | |
| 5 | 518 | 5:38:27.3 | -2:45:09.7 | 11.95 | K8.0 | II | 0.42 | 0.5 | 3900 | 9.40.5 | 6.70.6 | 7.30.5 | -1.0 | -8.1 |
| 6 | 520 | 5:38:27.5 | -2:35:04.2 | 12.83 | M3.5 | II | 0.12 | 0.2 | 3250 | 0.6 | 0.8c | -2.8 | -9.6 | |
| 7 | 562 | 5:38:31.4 | -2:36:33.8 | 12.17 | M3.0 | II | 0.19 | 0.2 | 3350 | 4.90.4 | 3.60.3 | 4.70.3 | -1.5 | -8.2 |
| 8 | 563 | 5:38:31.6 | -2:35:14.9 | 11.52 | M2.0 | II | 0.23 | 0.3 | 3500 | 0.5 | 0.5 | 1.80.5 | -2.3 | -9.2 |
| 9 | 592 | 5:38:34.3 | -2:35:00.1 | 11.22 | K0.0 | III | 0.16 | 0.8 | 5250 | 0.4 | 0.4 | -2.3 | -10.0 | |
| 10 | 598 | 5:38:34.6 | -2:41:08.8 | 13.10 | M4.5 | II | 0.11 | 0.14 | 3075 | 0.6 | 0.7 | -0.8c | -3.0 | -9.6 |
| 11 | 611 | 5:38:35.5 | -2:31:51.7 | 11.30 | K7.0 | III | 0.57 | 0.5 | 4000 | 0.7 | 0.7 | -2.0 | -9.0 | |
| 12 | 646 | 5:38:39.0 | -2:45:32.2 | 12.91 | M3.5 | II | 0.10 | 0.2 | 3225 | 0.4 | 0.80.3 | -1.80.4 | -2.8 | -9.6 |
| 13 | – | 5:38:39.8 | -2:56:46.2 | 11.43 | M0.5 | II | 0.45 | 0.4 | 3725 | 0.7 | 0.4 | 2.80.3 | -2.4 | -9.3 |
| 14 | 662 | 5:38:40.3 | -2:30:18.5 | 11.51 | M0.5 | II | 0.44 | 0.4 | 3725 | 0.7 | 0.7c | -0.7c | -2.1 | -9.0 |
| 15 | 669 | 5:38:41.3 | -2:37:22.6 | 11.46 | M0.0 | III | 0.44 | 0.45 | 3800 | 0.7 | 0.4 | 0.7c | -2.4 | -9.4 |
| 16 | 682 | 5:38:42.3 | -2:37:14.7 | 11.77 | M1.5 | II | 0.35 | 0.3 | 3575 | 0.4 | 0.5 | -1.2 0.4 | -2.5 | -9.3 |
| 17 | 694 | 5:38:43.9 | -2:37:06.8 | 12.84 | M4.5 | II | 0.1 | 0.14 | 3075 | 0.4 | 0.4 | 1.00.3 | -3.2 | -9.8 |
| 18 | 697 | 5:38:44.2 | -2:40:19.7 | 11.36 | K7.5 | II | 0.63 | 0.45 | 3950 | 0.5 | 0.3 | 2.10.3 | -2.5 | -9.5 |
| 19 | 710 | 5:38:45.4 | -2:41:59.4 | 11.99 | M2.5 | II | 0.25 | 0.25 | 3425 | 0.6 | 1.30.3 | 0.3d | -2.0 | -8.8 |
| 20 | 723 | 5:38:47.2 | -2:34:36.8 | 12.56 | M3.5 | II | 0.09 | 0.2 | 3250 | 3.40.5 | 2.10.4 | -2.0 | -8.9 | |
| 21 | 726 | 5:38:47.5 | -2:35:25.2 | 11.74 | M1.5 | II | 0.42 | 0.3 | 3575 | 1.10.3 | 1.40.3 | -1.8 | -8.6 | |
| 22 | 733 | 5:38:47.9 | -2:37:19.2 | 12.02 | M2.5 | II | 0.36 | 0.25 | 3425 | 0.4 | 1.30.3 | 0.6c | -2.0 | -8.7 |
| 23 | 736 | 5:38:48.0 | -2:27:14.2 | 10.16 | K8.0 | II | 0.83 | 0.45 | 3950 | 0.6 | 0.5 | -1.50.4 | -1.6 | -8.5 |
| 24 | 750 | 5:38:49.3 | -2:23:57.6 | 14.36 | M4.5 | II | 0.03 | 0.16 | 3075 | 1.2 | 1.2 | -3.4 | -10.3 | |
| 25 | 762 | 5:38:50.6 | -2:42:42.9 | 13.84 | M5.0 | II | 0.04 | 0.12 | 3000 | 0.5 | 0.7 | 2.90.4 | -3.4 | -10.1 |
| 26 | 774 | 5:38:52.0 | -2:46:43.7 | 11.52 | K8.0 | II | 0.44 | 0.5 | 3900 | 0.5 | 1.60.5 | 5.20.5 | -1.6 | -8.7 |
| 27 | 871 | 5:39:04.6 | -2:41:49.4 | 13.96 | M2 | II | 0.1 | 0.3 | 3500 | 1.2 | 1.0 | 8.51.0 | -3.2 | -10.3 |
| 28 | 897 | 5:39:07.6 | -2:32:39.1 | 11.30 | K8.0 | IIa | 0.6 | 0.5 | 3900 | 0.7 | 0.6 | 1.2c | -2.1 | -9.1 |
| 29 | 908 | 5:39:08.8 | -2:31:11.5 | 13.07 | M4.5 | IIb | 0.07 | 0.16 | 3075 | 1.30.4 | 0.80.3 | -1.30.3 | -2.9 | -9.6 |
| 30 | 927 | 5:39:11.5 | -2:31:06.6 | 11.99 | M0.5 | II | 0.24 | 0.5 | 3725 | 0.8 | 0.7 | -2.4 | -9.5 | |
| 31 | 984 | 5:39:18.8 | -2:30:53.1 | 11.40 | K9.0 | II | 0.52 | 0.45 | 3850 | 0.6 | 0.4 | -1.10.3 | -2.4 | -9.4 |
| 32 | 1152 | 5:39:39.4 | -2:17:04.5 | 11.67 | M1.5 | II | 0.29 | 0.35 | 3575 | 0.6 | 0.5 | -2.40.5 | -2.4 | -9.3 |
| 33 | – | 5:39:41.0 | -2:16:24.4 | 12.91 | M4.5 | II | 0.10 | 0.14 | 3075 | 0.4 | 0.4 | -3.2 | -9.8 | |
| 34 | 1230 | 5:39:49.4 | -2:23:45.9 | 13.44 | M4.0 | II | 0.07 | 0.18 | 3150 | 0.8 | 0.8 | 0.8 c | -3.1 | -9.9 |
| 35 | 1248 | 5:39:51.7 | -2:22:47.2 | 12.60 | M5.0 | II | 0.13 | 0.12 | 3000 | 0.5 | 0.6 | -2.8 | -9.3 |
Notes: , : Transition disk and evolved disk, respectively, in Hernández et al. (Hea07 (2007)). : tentative (2) detection. : Type IVr P-Cygni profile: EW(em)=1.20.3, EW(abs)=-0.90.3. : tentative type IVr P-Cygni profile (0.6, -0.6).
2.2 Stellar parameters
Spectroscopically determined spectral types exist for a small fraction of Ori objects only (e.g., Franciosini et al. Fea06 (2006) and references therein). To ensure homogeneity, we determine the effective temperature of each object from its visual photometry, adopting the relation between color indexes, Teff and spectral types of Bessell (Bes91 (1991)) for M dwarfs stars, and from Bessell (Bes79 (1979)) and Bessell and Brett (Bes_bret88 (1988)) for stars of earlier spectral type. We assume negligible extinction in all bands (Brown et al. Bro94 (1994); Béjar et al. Bej99 (1999)), and compute Teff independently from the three color indexes (V-R), (V-I), (R-I). The optical photometry is from Sherry et al. (She04 (2004)), Zapatero-Osorio et al. (Zea02 (2002)), Kenyon et al. (Kea05 (2005)), Béjar et al. (Bej01 (2001)) and Wolk (Wolk96 (1996)). The differences between the different determinations of Teff are generally less than 150 K, and often much smaller. The adopted values of Teff and spectral types are given in Table LABEL:table_1. The comparison with the spectroscopic determinations of spectral types of Zapatero-Osorio et al. (Zea02 (2002)) for the 8 objects in common shows differences of 1/2 to 1 subclass.
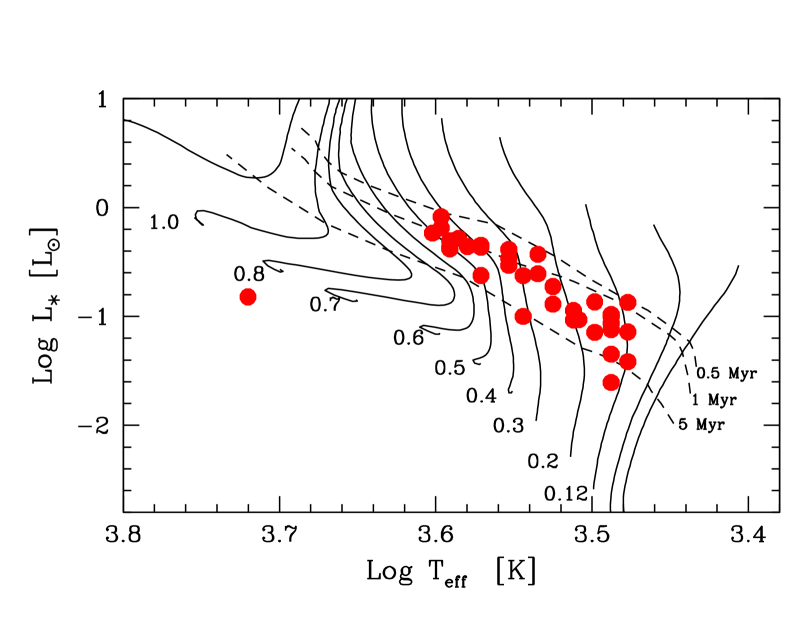
Stellar luminosities have been computed from the I magnitude, using the bolometric correction appropriate for the spectral type (Kenyon and Hartmann KH95 (1995)), no extinction and a distance D=350 pc. The location of the stars on the HR diagram is shown in Fig. 2, together with the evolutionary tracks of D’Antona and Mazzitelli (DM97; DM97 (1997)). The distribution of the stars is consistent with a typical age of Myr (Oliveira et al. Oea04 (2004)), with the exception of #9, a Class III object with color indexes consistent with an early K spectral type but very low luminosity.
The stellar masses range from to M⊙. Note that the exact values of M∗ depend on the adopted evolutionary tracks, especially around 0.5-1 M⊙. We use DM97 for homogeneity with the analysis of Natta et al. (Nea06 (2006)) of the mass accretion rates in Oph. The lower mass limit is determined by our selection criterion that J14.5 mag; the lack of more massive stars reflects the strong decrease of the fraction of Class II objects for increasing J magnitude observed by Hernández et al. (Hea07 (2007)). This trend, seen in other star forming regions (e.g., Hillenbrand et al. Hil98 (1998); Carpenter et al. Cea06 (2006); Lada et al. Lea06 (2006); Hernández et al. Hea07 (2007); Dahm and Hillenbrand DH07 (2007)), is particularly strong in Ori, where only 4 (7%) stars brighter than J=11 mag are classified as Class II. One of them is included in our sample (#23), and has an estimated spectral type K8 and mass M⊙. The fact that no higher-mass member has an associated Class II disk is confirmed by Caballero (C07 (2007)): of the 18 very bright stars (spectral type G0 and earlier) in the Ori cluster studied by him and included in the list of cluster members by Hernández et al. (Hea07 (2007)), 3 have transitional or debris disks, all the others are Class III.
2.3 Observations
Near-infrared spectra in the J band were obtained for all our targets using SOFI near-infrared camera and spectrograph at the ESO-NTT telescope. The observations of Ori were carried out in Visitor Mode on December 1-4, 2006. The 0.6 arcsec slit and the Blue low resolution grism have been used, resulting in a spectral resolution 1000 and a spectral coverage from 0.95 to 1.64m. Integration time was 40 minutes for all the targets; standard calibrations (flats and lamps) and telluric standards spectra were obtained for each observation. Wavelength calibration was performed using the lamp observations.
The mean seeing during the three nights was 0.7 arcsec, with many hours below 0.5 arcsec. All target objects and telluric standards have been observed at airmass values z2.
With the goal of observing as many objects as possible, the targets have been observed in pairs, choosing stars with angular separations which allow a 20 arcsec nodding and a 6 arcsec jitter with the 4.71 arcmin slit, and orienting the slit at appropriate position angles. In total, we have observed in this way 24 targets, while 11 have been observed individually.
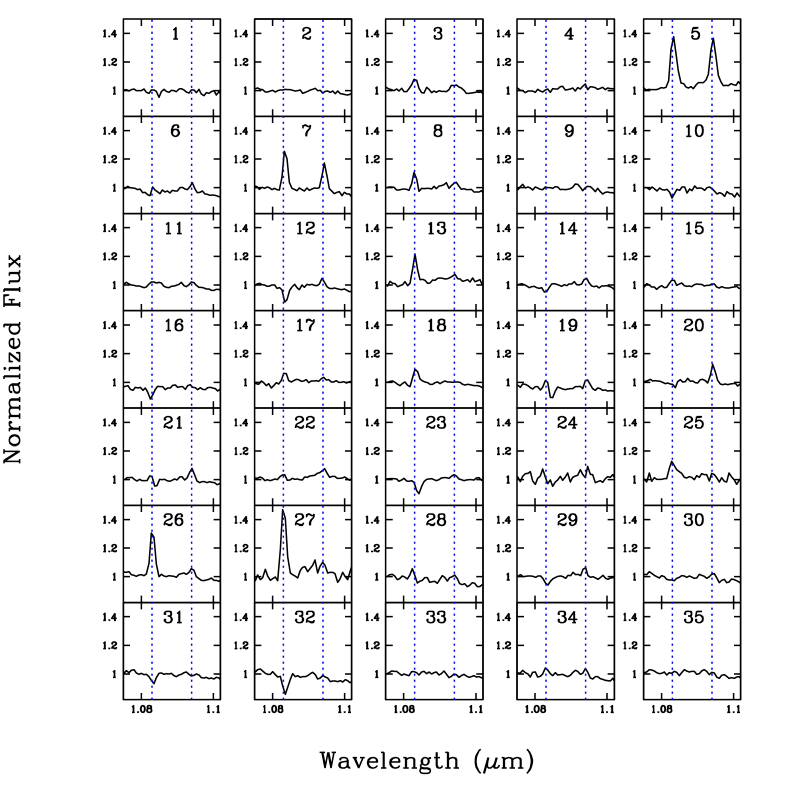
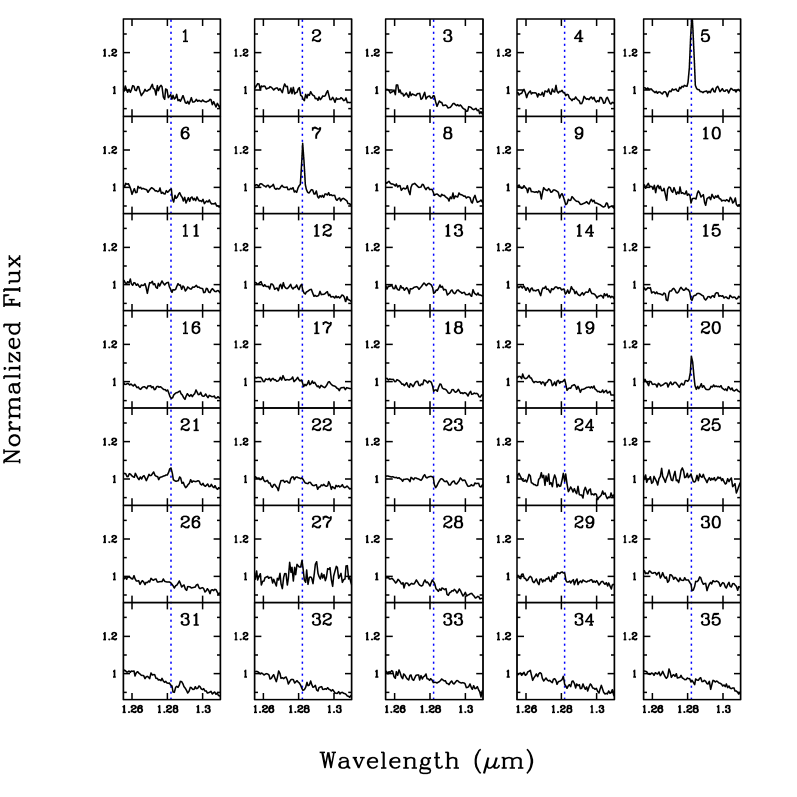
The spectra have been reduced using standard procedures in IRAF. We are interested in this paper in the three lines indicative of accretion powered activity which fall in the J band, namely the HeI line at 1.083 m and the two hydrogen recombination lines Pa at 1.094 m and Pa at 1.282 m; the portions of the spectra which contain these lines are shown in Fig. 3 and 4. Their equivalent widths are given in Table LABEL:table_1 (positive values for emission lines). Upper limits to Pa and Pa assume that the lines are in emission; they have been estimated from the peak-to-peak noise in the spectral region of the lines, under the assumption that the lines are not resolved. Since the He line can be either in emission or in absorption or both, we do not explicitely give upper limits in Table LABEL:table_1, they are similar to those of the adjacent Pa line.
3 Results
The presence of the hydrogen lines in emission and of the He I line, often with P-Cygni profiles clearly seen in high resolution spectra, (Edwards et al. Eea06 (2006)) is evidence of accretion related activity. In fact, inspection of Table LABEL:table_1 shows that none of the three lines is detected in Class III stars, with the possible exception of #15, where we have a tentative detection of He I in emission. Of the 31 Class II, we detect at least one of the three lines in 26 cases. The hydrogen lines are detected in emission in 12 Class II stars, but only in 5 we do detect both of them; in 7 cases, only Pa is clearly seen. The hydrogen line detection is confirmed in 10/12 cases by the presence of the He I line, either in absorption or in emission.
Our spectral resolution ( 300 km/s) is too low to resolve the lines. However, some lines appear to be marginally resolved. It is possible that weak lines look broad due to noise spikes in the adjacent continuum, as we think is the case of Pa in object #3, which has an unrealistic FWHM of 950 km/s; we did not try to correct for this effect the equivalent width in Table LABEL:table_1, which is hence very likely overestimated by a factor of 2. In two stars (#19 and #21), the He I line has an inverse P-Cygni profile, with redshifted absorption; the line is strong in #19, but barely detected in #21. Table LABEL:table_1 gives the total equivalent width of the line, while the values of the absorption and emission components are given in the notes to the table.
We have been surprised by the number of objects where Pa is detected while Pa is not. The ratio of the Pa to Pa fluxes has been recently measured for a group of CTTS in Taurus by Bary and Matt (Bea07 (2007)), who find a tight correlation with a ratio 0.86. Magnetospheric accretion models (Muzerolle et al. Mea01 (2001)) predict ratios for M⊙/yr, increasing to at M⊙/yr (J. Muzerolle, private communication). Considering that for TTS the ratio of the continuum at the two line wavelengths is , we expect in any case comparable equivalent widths, and, in fact, this is the case in the five Ori objects where both lines are detected. All stars with Pa but no Pa have relatively weak Pa; however, in several cases we should have detected Pa if the equivalent widths were similar and the lines unresolved. We have checked the observational and data reduction procedures, and found no obvious explanation for the absence of Pa. It is possible that the upper limits to Pa, derived assuming that the line is not resolved, are in fact underestimated, and, indeed, some objects with very low limits to the ratio of the Pa/Pa equivalent width (e.g., #3, #22, #26) have broad Pa (see Fig. 3). Also, in some cases Pa may have a P-Cygni profile with deeper absorption than Pa, and this could reduce the ratio of the unresolved equivalent widths. This kind of profile, however, is quite rare in Taurus TTS (e.g., Edwards et al. Eea06 (2006), Folha & Emerson FE01 (2001)). Note that the two lines Pa and Pa are observed simultaneously, so that variability cannot affect their ratio.
The HeI 1.083m line is seen in 23/31 Class II stars, in absorption (8 cases), in emission (14 cases), or with a P-Cygni profile (2 cases). This variety of profiles is known to occurr in TTS (Edwards et al. Eea06 (2006)), and will be discussed in § 4.2.
4 Discussion
4.1 Accretion luminosities and mass accretion rates
We use the hydrogen recombination lines to measure the accretion luminosity Lacc, following the procedure described in detail by Natta et al. (Nea06 (2006)).
Firstly, we compute line fluxes from the equivalent widths and the flux of the continuum near each line, calibrated with the 2MASS value of the J magnitude and AJ=0. We apply a correction of a factor 1.3 to the continuum at 1.09 m, to account for the typical slope of the J-band continuum in late K – M stars.
Line luminosities are computed from the line fluxes for the adopted distance D=350 pc. We use them to derive a measurement of the accretion luminosity Lacc, using the empirical correlation between the luminosity of the near-IR hydrogen recoombination lines and Lacc first noticed by Muzerolle et al.(Mea98 (1998)) and used to study the accretion properties of TTS in Ophiuchus by Natta et al. (Nea06 (2006)). The correlation has been established quantitatively for the two lines Pa and Br in a sample of TTS in Taurus for which reliable measurements of the accretion luminosity from veiling were available (Muzerolle et al. Mea98 (1998); Calvet et al. Cea04 (2004)), and extended in the case of Pa to the brown dwarf regime by Natta et al. (Nea04 (2004)). We adopt here a relation between Lacc and Pa luminosity obtained from the Natta et al. (Nea04 (2004)) correlation between Lacc and the Pa luminosity and the ratio of Pa to Pa fluxes of (Bary and Matt Bea07 (2007)):
| (1) |
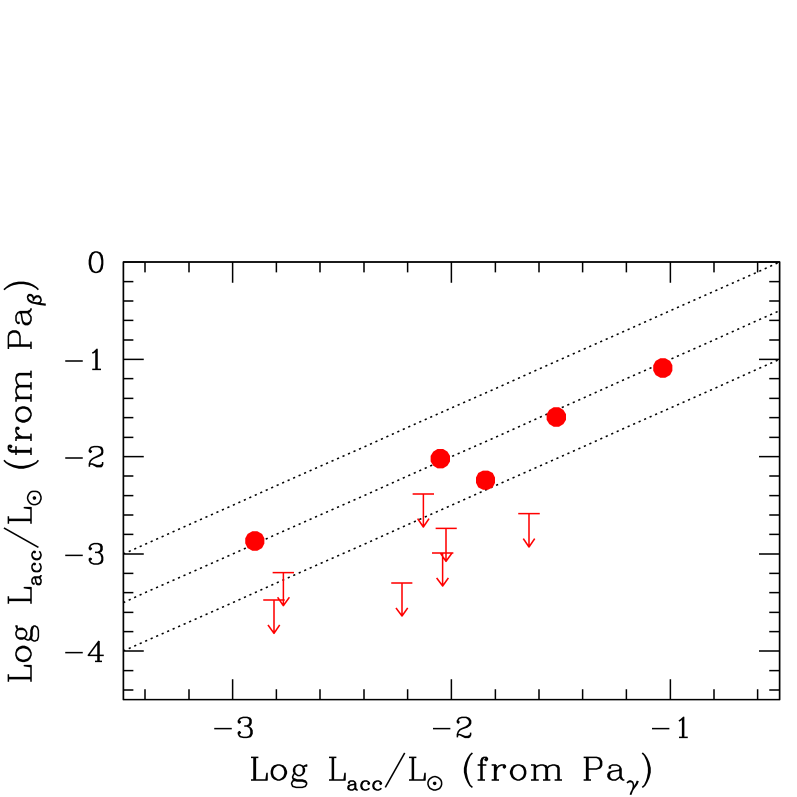
Eq.(1) does not depend on any assumption on the line origin, but only on the known empirical relation between Lacc and the Pa luminosity and the adopted value of the Pa/Pa ratio. As discussed at the end of §3, in several of our Ori objects the observed ratio Pa/Pa is higher than the Bary and Matt one and the values (or upper limit) of Lacc computed from L(Pa) are correspondingly lower (see Fig. 5). We decided to use in the following Lacc derived from Pa to maximize the number of actual measurements; since Lacc(Pa) Lacc(Pa), deriving Lacc from L(Pa) would just strengthen our conclusions.
The mass accretion rate is then been computed from :
| (2) |
where M∗ and R∗ are the stellar mass and radius, respectively.
The uncertainties on Lacc and are difficult to estimate, but they are certainly not small. In addition to the measurement errors on the line equivalent widths, there are continuum calibration uncertainties, since our spectra have not been photometrically calibrated. Variability in the lines is a well known phenomenon in TTS, and snap-shot estimates of their strength can differ from the long-term average values by large factors. Moreover, the relation between L(Pa) and Lacc has an intrinsic, non-negligible scatter, and the determination of the stellar mass/radius depends on a number of assumptions, among them the adopted evolutionary tracks. The final uncertainties on can easily be of dex, as discussed, e.g., by Calvet et al. (Cea04 (2004)) and Natta et al. (Nea06 (2006)). In spite of all that, snap-shot accretion values of a large number of stars in any given star formation region provide very significant information on the typical accretion properties of the region and on its evolutionary stage.
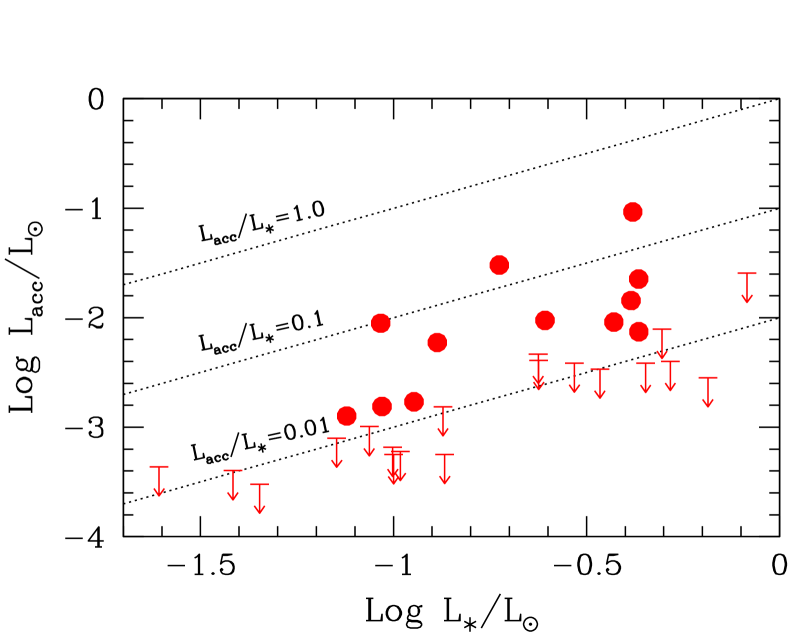
The results for Ori are summarized in Fig. 6 and 7, top panel. Fig. 6 plots the accretion luminosity as a function of the stellar luminosity for all Class II objects. It shows clearly that very few stars have Lacc larger than 0.1 L∗, and that most of them have values well below this limit. This is different from the results obtained in younger star forming regions, such as Taurus and Ophiuchus (see summary in Natta et al. Nea06 (2006)), where a large fraction of stars has Lacc/L∗.
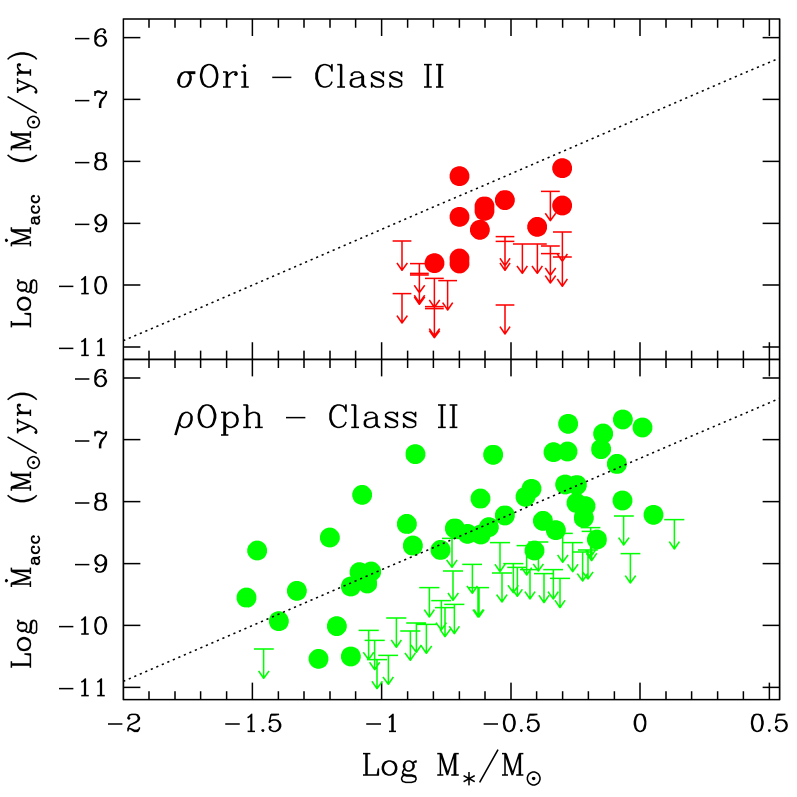
Fig. 7 shows the mass accretion rate as function of the stellar mass for the same 31 objects. The values of are all smaller than M⊙/yr, and 23/31 stars have accretion rates lower than M⊙/yr. When compared to stars with similar mass in Taurus and Ophiuchus, these are very low values, as we will discuss in § 4.5.
4.2 He line
Edwards et al. (Eea06 (2006)) have recently published a study of the Pa and He I profiles in a sample of 39 Taurus TTS; they found that the strength of both lines correlate with the J-band veiling, i.e., with the accretion luminosity. Although with a large spread, objects with low veiling have on average not only weaker but also narrower Pa. He I lines have very often P-Cygni profiles, with blue-shifted absorption caused by outflowing gas and red-shifted absorption due to infalling material. On average, strong accretors have the He I line in emission; red-shifted and blue-shifted absorption features are present in high and low accretors, but, if unresolved, the He I equivalent width would turn from strong emission in high accretors to net absorption in low accretors. In these objects, the blue-shifted absorption features due to outflowing matter, very likely a non-collimated wind, dominate the profile.
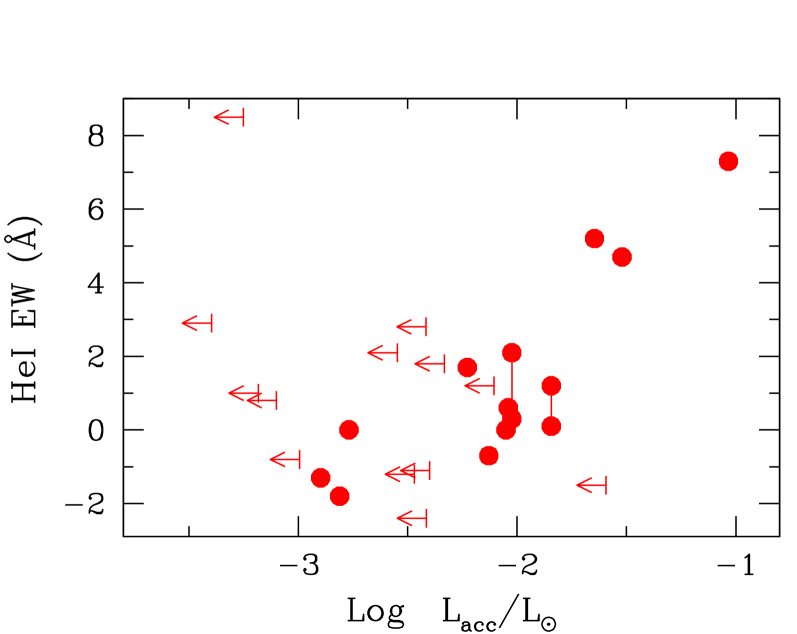
Fig. 8 plots the equivalent width of the He I line as function of the accretion luminosity Lacc for our sample. If we consider objects with measured Lacc, we find a good correlation between the two quantities, with He I in net absorption in low accretors and in emission in high accretors, as in the Edwards et al. (Eea06 (2006)) sample. Note that Edwards et al. use in their analysis the “activity index” of the He I line, i.e., the sum of the absolute values of the emission and absorption equivalent widths, while our unresolved profiles give the net equivalent width only. The trend of decreasing emission, increasing net absorption for decreasing Lacc is weaker if we include objects with Lacc upper limits; as in Taurus, there are some objects with strong He I emission but low Lacc(e.g., #27), which it would be interesting to investigate further.
The Taurus sample includes CTTS with mass accretion rates between and M⊙/yr, with a large fraction (29/38) of objects accreting at rates higher than the highest values of the Ori sample. Edwards et al. (Eea06 (2006)) divide their sample of CTTS into four groups according to the 1m veiling. The median values of Log of the first and second group (high and medium veiling) are -5.8 and -7 M⊙/yr, while the third and fourth (low 1m veiling, narrow and broad Pa, respectively) have median -8.2 M⊙/yr. The low veiling, broad Pa group has, on average, He I lines with net negative equivalent widths. The Ori sample overlaps with the low veiling objects and extends it to even lower values of . In fact, there are no objects with the very strong He I emission lines of some Group I Taurus stars, while the fraction of objects with net He I absorption is higher than in the Edwards et al. (Eea06 (2006)) group IV.
An interesting aspect of these results is that absorption He I lines can be detected even in objects with very low , where direct accretion signatures (e.g., hydrogen line emission, veiling) can be hard to measure. Accretion-powered winds may be the longest lasting tracers of disk activity.
4.3 Evolved Disks
The Ori cluster contains a relatively high fraction of evolved disks, i.e., objects with IR excess emission lower than the median of CTTS. Some of them are classified by Hernández et al. (Hea07 (2007)) as transitional disks, i.e., objects with a very low excess in the near-IR but a normal excess at longer wavelengths. Our sample includes two such objects. One (#28, S897) is classified as a transitional disk; it has no Pa or Pa lines above the detection limit (the corresponding mass accretion rate is M⊙/yr), but a tentative detection of He I, and a rather broad H (10%FW=504 km/s; Sacco et al. Sea07 (2007)). The other object (#29, S908) is classified as an evolved disk, but shows both Pa and Pa in emission and the He I line in absorption. Also for this object, Sacco et al. (Sea07 (2007)) measure a broad H, with a 10%FW=401 km/s. Its accretion rate is similar to that of the Class II Ori stars.
It is possible that in these objects (#29 in particular) the low IR excess is due to the disk orientation on the plane of the sky. However, some transitional disks are known to have relatively large (see summary in Chiang and Murray-Clay (CM07 (2007)) and references therein), and the discussion on how long accretion can be sustained once disks start to evolve is still open. The relatively large sample of evolved and transitional disks in Ori is well suited to study the accretion properties of transition and evolved disks. However, the sample discussed in this paper includes too few such objects to provide any answer.
4.4 Accretion Evolution
The relevance of the Ori results for the understanding of the accretion evolution can be better understood in comparison with other regions of star formation, both younger and older.
The comparison with the Oph star forming region is particularly interesting. Mass accretion rates in Oph have been derived by Natta et al. (Nea06 (2006)) for an IR-selected sample of Class II complete to a limiting mass of about 0.03 M⊙, using the luminosity of near-IR hydrogen recombination lines as a proxy of the accretion luminosity. Because the selection criteria and methods are similar, the comparison between these two regions is more meaningful than in other cases.
The major difference between the two regions is the lack in Ori of objects with high accretion rates. If we restrict the comparison to the mass range 0.1–0.5 M⊙, where the two samples overlap, and take as a reference the line shown in Fig. 7, which is the best fit to the Oph sample of measured over the whole mass interval, we find that only 1 star in Ori lies above this line (3%), while the fraction is 30% in Oph.
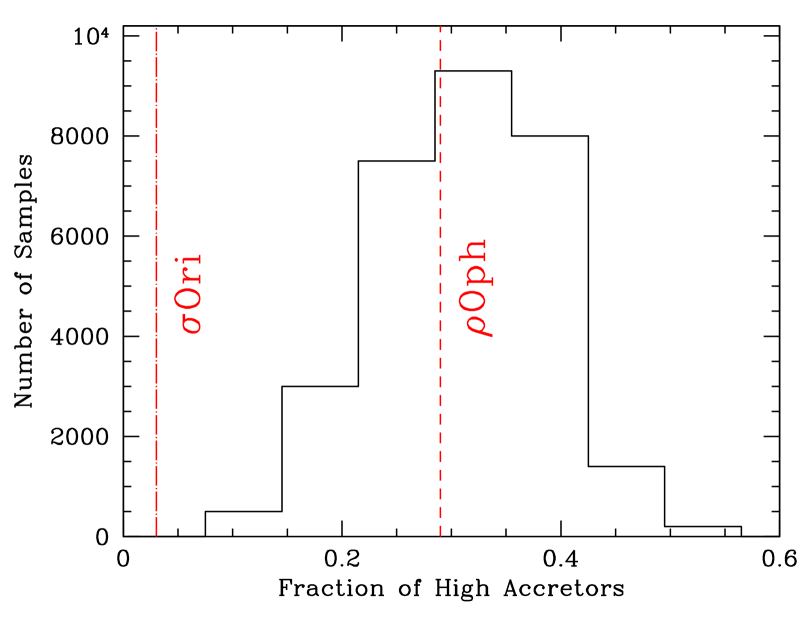
Because the Ori sample is small (much smaller than the Oph one), we performed a simplified Monte Carlo simulation to assess the statistical significance of this difference. The goal of our simulation is to evaluate whether the number of high accretors we observe in the Ori sample is consistent with being drawn from a distribution of rates as derived from the Oph Class II objects observations. We take the Oph stars in the interval 0.1–1 M⊙ (the sample 0.1–0.5 M⊙ would have too few sources to derive a reliable distribution) and use the relationship between accretion rates and stellar mass derived by Natta et al. (Nea06 (2006)) to scale all measurements to a fiducial stellar mass of 1 M⊙; we then compute the fraction of high accretors as the ratio of objects with measurements above the fiducial line shown in Fig. 7 to the total (measurements plus upper limits). Within the chosen mass range, the fractions of high accretors in Oph and Ori are 29% and 3% respectively.
Using a Monte Carlo method, we extract a large number of samples of 31 accretion rates. For each sample we randomly remove a number of objects based on the fraction of upper limits in Oph (52%), while for the remaining objects we simulate measurements using the distribution of measured rates. Figure 9 summarizes the results: the histogram plots the distribution of the fraction of high accretors in the simulations, the dashed line shows the value for the Oph sample while the dashed-dotted line shows the value observed in our Ori sample. The value observed in Ori is lower than the 0.1 percentile of the Monte Carlo simulations, suggesting that it is very unlikely that the two samples are two different realizations of the same population.
The lack of strong accretors in Ori is very likely an age effect, as in viscous disks the mass accretion rate is expected to decrease with time (roughly as ; Hartmann et al. Hea98 (1998)). On average, this means approximately a factor from the young (less than 1 Myr) Oph population to the older ( 3 Myr) Ori one, consistent with the results shown in Fig. 7. One way of looking at this is to compute the fraction of high accretors in Ori not with respect to the “younger” Oph -M∗ fiducial line, but with respect to an “aged” version, where has decreased by the same factor 10 for each M∗. Then, the fraction of Ori high accretors will be of 30%, identical to the fraction of high accretors in Oph.
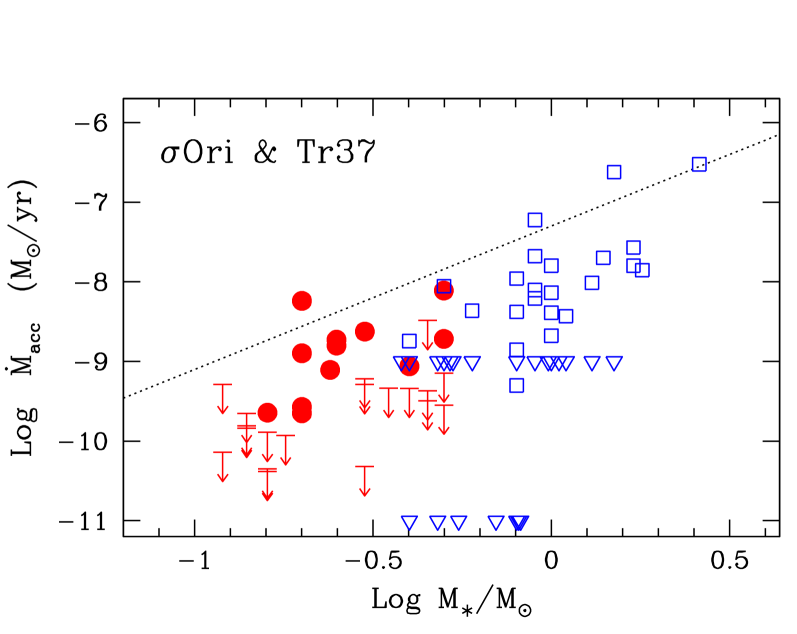
Fig. 10 shows a comparison between mass accretion rates in Ori and in the 4 Myr old star forming region Tr 37. This region, located at a distance of pc, has been extensively studied by Sicilia-Aguilar et al. (SAea04 (2004), SAea05 (2005), SAea06a (2006), SAea06b (2006)), who have classified disk properties from Spitzer IRAC and MIPS data and measured from U band excess and H profiles. The methods of deriving are different in the two regions, but probably any systematic effect is within the uncertainties, since both correlations between the U-band excess and Lacc and between the hydrogen IR line luminosity and Lacc have been empirically calibrated using the same sample of TTS in Taurus with good measurements of Lacc from veiling (e.g., Calvet and Gullbring CG98 (1998); Muzerolle et al. Mea98 (1998)).
Fig. 10 plots all the stars with disks (bone-fide Class II and transition disks) with measured stellar mass and , as reported by Siciliar-Aguilar et al. (SAea06b (2006)). We have not included any of the very young ( Myr) Class II objects, probably an episode of triggered star formation, found in the TR 37 “globule”. Because of its larger distance, the Tr 37 sample covers a mass range between and 1.8 M⊙, with one star of 2.5 M⊙(whose is very uncertain); there is practically no overlap with the Ori lower-mass sample. However, the accretion properties of the two regions look very similar. The trend of higher for higher M∗ is confirmed, with good merging between the two samples. More importantly, both Ori and Tr 37 lack high accretors to a similar degree. If we define, as before, high accretors to be those stars with values of above the fiducial line s hown in Fig. 7, the fraction of high accretors in Tr 37 is 6%, similar, within the uncartinties, to the 3% found in Ori, and certainly much lower than the 30% fraction of high accretors in Oph.
The continuity in the –M∗ behaviour between the two regions seems to extends to stars more massive than about 1–1.2 M⊙. In other star-forming regions, as discussed in §1, stars more massive than M⊙ loose evidence of disks and accretion much faster than less massive stars, and one could expect to see a drop in the fraction of Class II stars among the more massive members of Tr 37. However, this does not seem to be the case, because Tr 37 has a relatively high fraction of Class II (8 with respect to 5 Class III among stars more massive than 1.2 M⊙), even when the globule population is not taken into account. Of these, 6 have evidence of accretion. The case of Tr 37 shows that the evolution of disks and accretion as function of the stellar mass is still an open problem, that needs to be addressed in more detail in the future.
5 Summary and conclusions
This paper presents J-band spectra of 35 stars in the star-forming region Ori. We concentrate our attention on the three lines that are indicative of accretion-related activity, namely the two hydrogen recombination line Pa and Pa and the He I line at 1.083 m.
The stars range in mass from to M⊙. Four have no evidence of disks (Class III), according to the classification of Hernández et al. (Hea07 (2007)) based on Spitzer near and mid-IR photometry. None of the three lines is detected in their spectra, with the possible exception of one star which has a tentative detection of He I emission. The other 31 objects have associated disks (Class II and evolved disks), and we detect Pa in 12 of them and Pa in 5. The He I line is seen in 23 disk objects, either in emission or in absorption or both. Even at the low spectral resolution of our spectra ( km/s), in 2 cases the He I has a P-Cygni profile with redshifted absorption.
We derive accretion luminosities and mass accretion rates from the Pa luminosity; the results for Ori indicate values much lower than in stars of similar mass in the younger regions Taurus and Oph. In particular, a statistical analysis shows that the Oph and Ori populations cannot be drawn from the same parent population. TTS in Ori are statistically identical to those in Oph only if we take into account their age, i.e., that any Oph object will have, at Ori age, a value of lower by a factor of about 10 (), as expected if viscosity controls disk evolution.
The HeI is detected (in net absorption or emission) in more stars than either of the hydrogen lines. Its behaviour agrees qualitatively with what found by Edwards et al. (Eea06 (2006)) in a sample of TTS in Taurus; namely, strong HeI emission characterizes on average high accretors, while net absorption, probably due to a wind, is typical of low accretors. We extend this result to objects of very low and suggest that the He I line may be used to detect weak accretors when other methods become unfeasible.
The Ori region, with its well studied disk population and wealth of data at all available wavelengths, large number of member stars extending over a broad mass range and moderate distance, is particularly well suited for a number of follow-up studies. Among them, we want to mention that it will be relatively easy to obtain near-IR spectra of the complete sample of Class II objects, down to the brown dwarf regime, to check, e.g., if the accretion rate evolves differently in brown dwarf disks. The comparison of Ori with the region Tr 37, which has similar age and a comparable fraction of high accretors, but a surprisingly high fraction of disks among stars more massive than about 1 M⊙, shows that the dependence of disk and accretion evolution with the mass of the central object is still an open and intriguing problem.
Our results on the two evolved/transition disks in our sample confirm that accretion is still going on in some of them and suggest that near-IR spectroscopy and high resolution spectra of the hydrogen and He I lines may help to clarify the last stages of the history of accretion disks.
Acknowledgements.
We thank James Muzerolle for providing us with unpublished results of his magnetospheric accretion models and for very useful discussions. It is a pleasure to acknowledge the continuous, competent and friendly support of the ESO staff during the preparation and execution of the observations at La Silla observatory. This project was partially supported by MIUR grant 2004025227/2004 and by the INAF 2006 grant “From Disks to Planetary Systems”.References
- (1) Barrado y Navascués D., Martín E.L. 2003, AJ 126, 2997
- (2) Bary J.S., Matt S.P. 2007, “Star-disk Interaction in Young Stars”, IAU Symp.243, J. Bouvier & I. Appenzeller eds., in press
- (3) Béjar V.J.S., Zapatero-Osorio M.R., Rebolo R. 1999, ApJ 521, 671
- (4) Bessell M.S. 1979, PASP 91, 543
- (5) Bessell M.S., Brett J.M. 1988, PASP 100, 1134
- (6) Bessell M.S. 1991, AJ 101, 662
- (7) Béjar V.J.S. et al. 2001, ApJ 556, 830
- (8) Brown A.G.A., de Geus E.J., de Zeeuw P.T. 1994, A&A 289, 101
- (9) Caballero J.A. 2007, A&A 466, 917
- (10) Caballero J.A., Béjar V.J.S., Rebolo R., Eislöffel J., Zapatero Osorio M.R. et al. 2007, A&A 470, 903
- (11) Calvet N., Gullbring E. 1998, ApJ 509, 802
- (12) Calvet N., Muzerolle J., Briceño C.,Hernández J., Hartmann L. 2004, AJ 128, 1294
- (13) Carpenter J.M., Mamajek E.E., Hillenbrand L.A., Meyer M.R. 2006, ApJ 651, L49
- (14) Chiang E.I., Murray-Clay R.A. 2007, NatPhys 3, 604
- (15) Dahm S.E., Hillenbrand L.A. 2007, AJ 133, 2072
- (16) D’Alessio P., Calvet N., Hartmann L., Franco-Hernández R., Servín H. 2006, ApJ 638, 314
- (17) D’Antona F., Mazzitelli I. 1997, Mem.S.A.It. 68, 807
- (18) Dullemond C.P., Dominik C. 2005, A&A 434, 971
- (19) Edwards S., Fischer W., Hillenbrand L., Kean J. 2006, ApJ 646, 319
- (20) Franciosini E., Pallavicini R., Sanz-Forcada J. 2006, A&A 446, 501
- (21) Folha D.F.M & Emereso J.P. 2001, A&A 365, 90
- (22) Hartmann, L., Calvet, N., Gullbring E., D’Alessio P. 1998, ApJ 495, 385
- (23) Hernández, J., Hartmann L., Megeath T., Gutermuth R., Muzerolle J., and 7 others 2007, ApJ 662, 1067
- (24) Hillenbrand L.A., StromE.S., Calvet N., Merrill K.M., Gatley I. et al. 1998, AJ 116, 1816
- (25) Hollenbach D.J., Yorke H.W., Johnstone D. 2000, in ”Protostars and Planets IV”, V. Mannings, A.P. Boss and S.S. Russel eds., The University of Arizona Press, p.410
- (26) Kenyon S.J., Hartmann L. 1995, ApJS 101, 117
- (27) Kenyon M.J., Jeffries R.D., Naylor T., Oliveira J.M., Maxted P.F.L. 2005, MNRAS 356, 89
- (28) Lada C.J., Muench A.A., Luhman K.L., Allen L., Hartmann L. et al. 2006, AJ 131, 1574
- (29) Mohanty S., Jayawardanha J., Basri G. 2005, ApJ 626, 948
- (30) Muzerolle J., Hillenbrand L., Calvet N., Bricen̈o C., Hartmann L. 2003, ApJ 592, 266
- (31) Muzerolle J., Calvet N., Hartmann L. 2001, ApJ 550, 944
- (32) Muzerolle J., Hartmann L., Calvet N. 1998, AJ 116, 2965
- (33) Natta A., Testi L.,Muzerolle J., Randich S., Comerón F., Persi P. 2004, A&A 424, 603
- (34) Natta A., Testi L., Randich S., 2006, A&A 452, 245
- (35) Oliveira J.M., Jeffries R.D., van Loon J.Th. 2004, MNRAS 347, 1327
- (36) Oliveira J.M., Jeffries R.D., van Loon J.Th., Rushton M.T. 2006, MNRAS 369, 272
- (37) Sacco G., Franciosini E., Randich S., Pallavicini R. 2007, A&A, to be submitted
- (38) Sherry W.H., Walter F. M., Wolk S. J. 2004, AJ 128, 2316
- (39) Sicilia-Aguilar A., Hartmann L.W., Bricen̈o C., Muzerolle J., Calvet N. 2004, AJ 128, 805
- (40) Sicilia-Aguilar A., Hartmann L.W., Hernández J., Bricen̈o C., Calvet N. 2005, AJ 130, 188
- (41) Sicilia-Aguilar A., Hartmann L.W., Calvet N., Megeath S.T., Muzerolle J., et al. 2006, ApJ 638, 897
- (42) Sicilia-Aguilar A., Hartmann L.W., Fürész G., Henning Th., Dullemond C., Brandner W. 2006, AJ 132, 2135
- (43) Skrutskie M.F., Dutkevitch D., Strom S.E., Edwards S., Strom K.M., et al. 1990, AJ 99, 1187
- (44) Wolk S.J. 1996, PhD thesis, State Univ. New York, Stony Brook
- (45) Zapatero Osorio M.R., Béjar V.J.S., Pavlenko Ya., Rebolo R.,Allende Prieto C., et al. 2002, A&A 384, 937