Evolution of Gas in Galaxies
Abstract:
The SKA will be a unique instrument with which to study the evolution of the gas content of galaxies. A proposed deep ( 8 Msec) ‘pencil-beam’ survey is simulated using recently updated specifications for SKA sensitivity and survey speed. Almost galaxies could be detected in the redshifted 21cm line, most at redshifts in excess of two. This will enable confident statements to be made about the evolution of the cosmic HI density and the HI mass function to , corresponding to a lookback time of 11 Gyr. However, galaxies or groups of galaxies with masses the same as the most HI-massive galaxies at will be detectable at redshifts of 6, if they exist. The ideal instrument for studying HI evolution would have an instantaneous sensitivity at least a factor of two higher than current specifications in the critical frequency range 200-500 MHz, or m2 K-1. The capabilities of the SKA will be highly complementary to ALMA which will be able to study the evolution of the molecular gas component over the same redshift range.
1 Introduction
Understanding the evolution of galaxies is one of the goals of modern cosmology and one of the five key science goals of the SKA [1]. A key ingredient in galaxy evolution is the gas supplied through various accretion, merger and feedback processes that occur during the assembly of galaxies. This gas, which is mainly hydrogen, passes through a neutral atomic phase and later condenses into massive molecular clouds and stars. During the atomic phase, it can readily be traced with the 21cm hyperfine spin-flip transition and the Gunn-Peterson effect.
At high redshifts, , neutral hydrogen is currently traced by ground-based observations of Gunn-Peterson absorption lines against bright background QSOs. Such observations demonstrate that the bulk of the neutral hydrogen is in the Damped Ly- systems with column densities exceeding cm-2. However, interpretation of these observations tends hampered by insufficient lines of sight and serious uncertainties associated with dust obscuration, gravitational lensing and intrinsic source size. These uncertainties lead to contradictory results from measurements associated with bright QSOs, faint QSOs and Gamma Ray Bursts [2] [3] [4]. However, with the SKA, galaxies will be detected at similar redshifts in 21cm line emission, which will lead to a clearer understanding of the distribution of gas in the Universe, and the manner in which the gas content of galaxies evolves with time.
In order to measure the gas content of galaxies at the highest redshift, a deep pencil beam survey with the SKA is proposed. Currently proposed SKA specifications [5] are adopted, and used to generate artificial galaxy catalogues which are used to simulate the accuracy with which one simple parameter can be recovered, namely the cosmic HI density – the comoving volume density of neutral hydrogen.
2 An SKA Deep Field
An early goal in the design and development of the SKA has been the requirement to detect and image galaxies beyond a redshift of unity in the redshifted 21cm line of neutral hydrogen and in the radio continuum [6]. However, the astronomy community has since developed an impressive list of complementary science goals for the SKA, including the study of the early intergalactic medium, dark energy and cosmology, pulsars and tests of gravitational theory, planet formation and cosmic magnetism [1]. The resultant range of requirements (e.g. frequencies, baselines, field-of-view) has inevitably added to the cost of the SKA and created complexities in developing a design. A recent SKA project study [5] has recommended the adoption of a preliminary set of specifications for the SKA and its various phases. For the purpose of the discussion of a putative SKA deep field, these specifications are adopted in this paper. Where multiple specifications exist due to technology uncertainty, the specifications relating to the simplest technology has been chosen. The SKA specifications, although realistic, are nevertheless still indicative and are likely to change as the SKA design evolves. For reference, a summary of the adopted values, in the frequency range of interest, is listed in Table 1.
| Frequency | |||||
|---|---|---|---|---|---|
| MHz | m2 K-1 | deg2 | s | ||
| 70 – 200 | 6.1–19 | 3000 | 200 | 0 | |
| 200 – 500 | 1.8–6.1 | 7500 | 200 | ||
| 500 – 10002 | 0.42–1.8 | 9000 | 2.0 | ||
| 1000 – 14202 | 0–0.42 | 9000 | 0.4 |
1Assumes that 75% of the SKA aperture will reside on baseline
lengths short enough not to significantly resolve distant galaxies.
2Assumes wideband feed technology which gives a slightly better
sensitivity (), but a dramatically worse field of view.
A critical requirement for the study of galaxy evolution is the ability to detect galaxies at the highest redshift. Since the bandwidth is defined by the Doppler width of the galaxies, this ability is only dependent on the instantaneous sensitivity , and the integration time . Unlike for many other science goals, ‘survey’ or ‘mapping’ speed is much less important as long as the field-of-view is able to deliver suitably large statistical samples. High mapping speed, on its own, is insufficient to ensure that the highest redshift galaxies can be detected.
For this paper, the sole question of the evolution of the cosmic HI density is addressed. This only requires the detection, not imaging, of galaxies. Therefore, somewhere between 50% (baselines less than 5 km) and 75% (baselines less than 180 km) of the full SKA collecting area is available, before galaxies become resolved and more difficult to detect. Here, it is assumed that 75% is available, corresponding to a sensitivity of m2 K-1 in the critical redshift range 1.8 – 6.1. Values for other frequencies are listed in Table 1. Low redshift galaxies remain heavily resolved. Nevertheless, at the higher redshifts of interest in this paper, where the great majority of the galaxies will be detected, the assumption remains reasonable. Available integration time is more difficult to judge but, given the wide range of science possibilities opened up with a deep field observation, it seems likely that a substantial integration time may be feasible. It is assumed that 8 Msec, which corresponds to hrs, will be available over the first few years of operation of the SKA.
3 Results
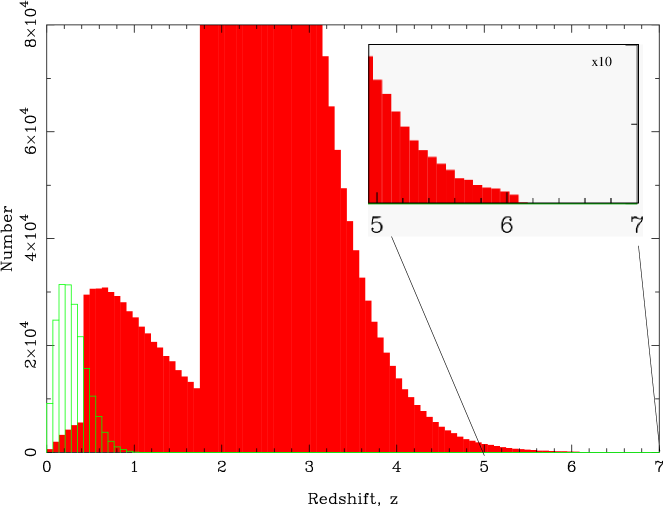
A simulated catalogue was created using the above telescope specifications and a non-evolving HIPASS HI mass function [7]. The redshift distribution is shown in Figure 1. The small field-of-view at frequencies from 500 to 1420 MHz results in a relatively small number of objects detected at low redshifts. For example, only 21,000 galaxies are detected at redshifts beneath 0.42, which is a factor of 10 less than expected from the proposed ASKAP deep survey ([8] and Figure 1), despite the latter being conducted with a telescope of less than 1% of the SKA collecting area. However, a shallow SKA survey over a large area of sky is a better way of detecting larger numbers of low-redshift galaxies. At higher redshifts, much larger numbers of galaxies are detected, mainly due to the much larger cosmic volume surveyed. galaxies are seen to redshifts of about 3.4, beyond which the number of detected galaxies drops off dramatically.
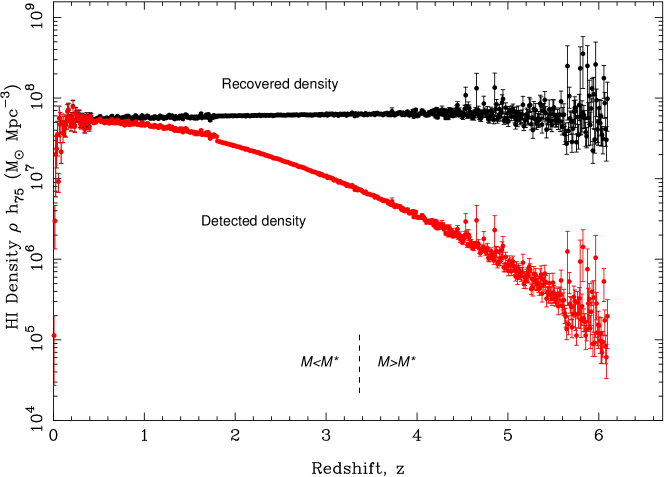
For each redshift interval, the HI density integral is calculated for the detected galaxies and shown in Figure 2. The ‘detected’ density remains within a factor of a few of the input density at redshift up to , but drops to 10% at a redshift of as the bulk of the mass-bearing galaxies are too faint to detect. Nevertheless, using an assumption that the shape of the mass function is constant, it is possible to recover the input mass density even at redshift 5 (Figure 2) before shot noise errors become large. In practice, the shape of the mass function will change with redshift in an unknown manner, so it will be hard to reliably recover the cosmic HI mass density much beyond a redshift of 3 from emission measurements alone.
4 Discussion
This simulation has demonstrated the large numbers of high-redshift galaxies that can be detected by the SKA in a significant, but feasible, HI survey of galaxies, and has demonstrated the high accuracy with which the cosmic HI density can be measured. Whilst galaxy numbers are low at redshifts below 1.8, this is largely due to the small field of view available to single pixel technology. Adoption of widefield detection technology has the potential to greatly increase numbers. Although the subsequent reduction of errors associated with shot noise and cosmic variance is important for many science goals, greater gains in the field of galaxy evolution study are likely to be made with better instantaneous sensitivity at lower frequencies. This will increase the ability to detect changes in the HI mass function and reduce the density extrapolation required to account for low-mass galaxies at redshifts approaching 3. An appropriate goal of m2 K-1 is therefore suggested for frequencies below 500 MHz.
References
- [1] Carilli C.L., Rawlings S. 2004, NewAR, 48, 979
- [2] Prochaska J.X., Herbert-Fort, S., Wolfe A.M. 2005, ApJ, 635, 123
- [3] Prochter G.E. et al. 2006, ApJ, 648, 93
- [4] Porciani C., Viel M., Lilly S.J. 2007, ApJ, 659, 218
- [5] Schilizzi R.T. et al. 2007, ‘Preliminary Specifications for the Square Kilometre Array’, version 2.7.1 (4 December 2007), SKA Project Office
- [6] van der Hulst J.M., Sadler E.M., Jackson C.A., Hunt L.K., Verheijen M., van Gorkom J.H. 2004, NewAR, 48, 1221
- [7] Zwaan M.A., Meyer M.J., Staveley-Smith L., Webster R.L. 2005, MNRAS, 359, 30
- [8] Johnston S. et al. 2007, PASA, 24, 174