Fine Scale Magnetic Fields in and around a Decaying Active Region
Abstract
High spatial resolution spectro-polarimetric observation of a decaying spot was observed with the Diffraction Limited Spectro-Polarimeter. The spatial resolution achieved was close to the diffraction limit (0.”18) of the Dunn Solar Telescope. The fine scales present inside the decaying active region as well as surrounding areas were studied. Two interesting phenomenon observed are: (i) Canopy like structures are likely to be present in the umbral dots as well as in the light bridges providing evidence for field-free intrusion, (ii) There are opposite polarity loops present outside of the spot and some of them connects to the main spot and the surrounding magnetic features.
keywords:
Diffraction Limited Spectro-Polarimeter – G-band – High resolution imaging – Small-scale magnetic fields – Decaying Sunspot1 Introduction
Over the past few years, high spatial resolution solar observations became feasible with the development of versatile Adaptive Optics (AO; Rimmele, 2004) systems. The success in obtaining consistent high spatial resolution images, from the ground, revived the development of new instrumentation for observations close to the telescopes’ diffraction limit. The versatility of the solar instrumentation made it possible to simultaneously observe a field-of-view (FOV) of interest at different wavelengths. Simultaneous imaging and spectroscopic observations are feasible for quantitative study of physical parameters.
The success of the AO system is well appreciated during spectroscopic and spectro-polarimetric observations. The long integration time and the time required to scan the FOV of interest imposes the consistent image quality requirement from the AO for longer durations (as long as an hour). To supplement the spectroscopic observations, a set of imageries are also essential in order to track the features of interest. One such combination was developed for the Dunn Solar Telescope (DST) of the National Solar Observatory (NSO) at Sacramento Peak, Sunspot situated in New Mexico, USA. An exit port was assigned as a dedicated port for fixed and well calibrated instrumentation where several set of instruments were deployed and facilitate observations with very minimal setup time. This setup also facilitates standardised data reduction procedures. A set of instrumentation, G-band & Ca-K imagery, Diffraction Limited Spectro-polarimeter (DLSP), and a light feed for either a Universal Birefringent Filter (UBF) setup or a dual Fabry-Perot setup, were deployed in this port. More details on this instrumentation can be found in Sankarasubramanian et al. (2004; 2006) and Rimmele & Sankarasubramanian (2004).
The diffraction limited imaging capability of the current day telescopes produced several recent papers on the fine scale structures of active as well as quiet regions. Langhans et al. (2005), Lites & Socas-Navarro (2004), Sankarasubramanian & Rimmele (2003), Sankarasubramanian, Rimmele, & Lites (2004), Rimmele & Sankarasubramanian (2004), and Rimmele & Marino (2006) are few examples from a long list. The positive aspects of some of these high resolution observations are the availability of vector magnetic field data close to the diffraction limit and the provision to observe Doppler velocities and other physical parameters near simultaneously. With several available space programs, it is now even possible to co-ordinate ground based observations with space borne instruments.
In this paper, we report on an observation of a decaying active region using the DST and the fixed port instrumentation. We used the DLSP along with G-band and Ca-K imagers to study the vector magnetic field and its morphology of the decaying active. H-alpha images were also simultaneously obtained using the UBF. These observations were also co-ordinated with TRACE observations, however the TRACE observations will not be discussed in this paper. Section 2 discusses the observing setup and details of the observations. Preliminary results from these observations are spelled out in section 3.
2 Observations
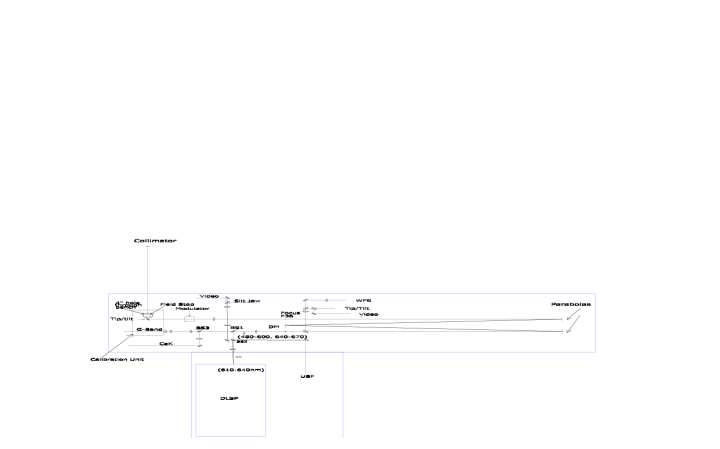
The fixed port instrumentation at the DST were used for this observation and is shown in figure 1. Light from the exit port of the DST passes through the DLSP calibration unit mounted under an optical table. The light is then passes to a collimator and a tip-tilt mirror and then to the high-order AO (HOAO) optics through the DLSP modulator. The output beam from the HOAO is then passes through three different beam splitters (BS1, BS2, & BS3). BS1 transmits the blue light below 480nm and reflects higher wavelengths. BS3 is optimized to transmit light in the G-band wavelength and efficiently reflect in the CaK wavelength. BS2 is a notch filter which transmits the DLSP wavelength of interest, 630.2nm. The rest of the light with wavelength 480nm to 610nm and longer wavelengths above 640nm are reflected into the UBF beam path.
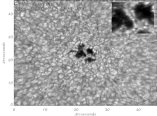
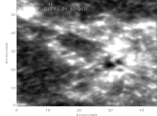
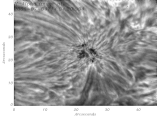
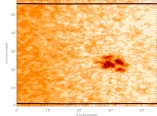
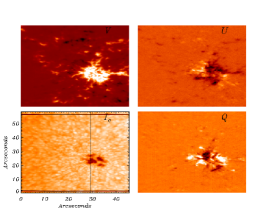
The observations were carried out from June 20 to July 4, 2005. A decaying active region, NOAA 0781, was observed for several hours on July 4, 2005. This active region was first visible in the East limb on June 28 and was close to disk center on July 4. Figure 2 shows an example observation of this region. In this figure, G-band, CaK, H-alpha, and the DLSP intensity maps are shown. The insert in the G-band image is a blow up of the light bridge, present in the center of the active region, to show the presence of small-scale structures. The spatial resolution is estimated from the smallest structure visible and is 0.”18, close to the diffraction limit of the DST at 630nm. Figure 3 shows the Stokes maps obtained using the DLSP. It can be clearly seen that the image quality during the 35-minute scanning was good due to the excellent performance of the HOAO.

3 Results
Data from all the cameras were dark corrected and flat-fielded. Polarimetric calibration and instrumental polarisation corrections were done for the DLSP data. From the preliminary analysis of this calibrated data set, three different portions of this active region will be discussed in this section.
3.1 Light Bridge (LB)
Light bridges (LBs) are bright structures passing through the umbral region of sunspots. They are predicted to be field free plasmas intruding from deeper layers (Spruit & Scharmer, 2006). However, there are observational predictions that LBs may be an elevated field free structure (Lites et al., 2004). Observations of magnetic fields in the LBs suggest that the field strength in these regions are smaller compared to the umbral field strengths (Leka, 1997; Rimmele, 2004). However, there are also observations of LBs having opposite polarity to that of the spot (Bharti et al., 2007; Livingston et al., 2006). The field morphology of the LBs predict that the surrounding field lines should bend towards the central portion of the LB. Hence, large linear polarisation signals are expected at the edges of LBs compared to the central region.
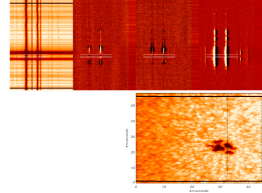

Figure 4 shows an example of the Stokes spectra when the slit was placed across a portion of the LB and the umbral region. The three horizontal lines marked on the spectral images are the center and two edges of the LB. The center of the LB is marked with an asterisk in the intensity image. The slit position for the spectral image is also shown as a vertical dark line in the intensity map. On the right side of the image the Stokes profiles (Q & V) of the three regions (center and two edges of the LB) are shown. Since the U-signals are below the noise level ( 0.2%), they are not shown in this figure. It is clear from these profiles that the linear signal (Q) is larger at the edges of the LB compared to the central regions. Note that the spectral line at 6302.5Å show clearer signal than 6301.5Å line due to the larger magnetic sensitivity of the former line. It is also visible that the V-signal is larger in the edges compared to the central region due to the field strength reduction at the central LB. Several other points in the LBs were looked into and all of them show similar signatures. This observation does clearly support the field line morphology, in and around LBs, predicted by the field free intrusion mechanism.
3.2 Umbral Dots (UDs)
UDs are the small-scale bright structures present inside the dark sunspot umbra. They are predicted to be field free intrusions into the photosphere (Parker, 1979; Choudhury, 1986). UD properties are extensively studied (Sobotka & Hanslmeier, 2005; Sobotka, Brandt, & Simon, 1997; Jurcak, Martinez Pillet, & Sobotka, 2006). Numerical magneto hydro-dynamic simulations of UDs are becoming realistic (Schussler & Vogler, 2006). Recent observations suggest that the penumbral grains have properties similar to UDs (Rimmele & Marino, 2006). Most of the umbral dots studied with high resolution images show upflows (Sankarasubramanian, Rimmele, & Lites, 2004).
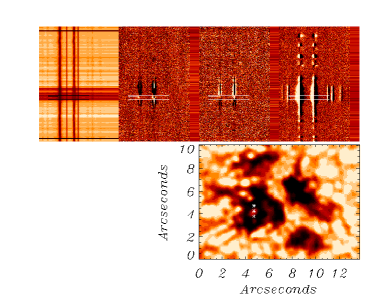
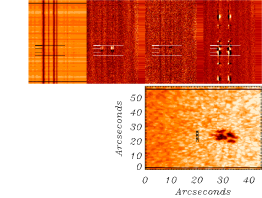
Figure 5 shows an umbral dot along with its Stokes spectral images observed with the DLSP. The Stokes spectra corresponding to the three asterisk marked in the continuum image can be identified from the three white horizontal lines plotted in the spectral images. The three asterisk points represent the edges and the center of the UD as seen in the continuum image. It is visible in the Stokes spectra that Stokes Q and U changes its sign at the UD edges compared to the UD center where as the sign of Stokes V remains the same. This observation can be interpreted as bending of field lines from the surrounding regions towards the center of the UD. For an UD surrounded by umbra, the bending direction of the magnetic field lines at the center and edges will be perpendicular to each other and hence the sign change in the linear polarisation measurements.
3.3 Quiet Neighborhood
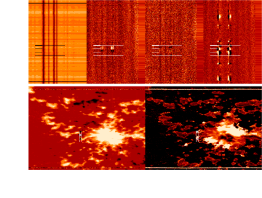
Most regions of the solar atmosphere are quiet when viewed at low resolution. However, it has been observed that the so called quiet sun is also magnetically active at small scales. The granular regions surrounding this active region showed profiles with interesting properties. Figure 6 shows an example of the quiet region surrounding the spot. The V-profiles clearly show polarity reversals in 4-5” spatial scales. The two large horizontal white line shown in the spectral images are the FOV of interest and the three short white line corresponds to spatial points marked as asterisk in the bottom intensity image. The U-spectra for the opposite polarity region show very weak signals suggesting that the field lines are aligned in the solar North (N)-South (S) direction (N-S direction is taken as the +Q direction). However, the Q-profile show different sign for the two opposite polarity regions suggesting that the field lines for these two regions are aligned at right angles to each other. The right hand side image of this figure shows the circular (bottom left) and linear (bottom right) polarisation maps. The three asterisk position marked in the left side intensity image is also marked in these two images. It is clear from these images that there is a negative polarity region present in between two positive polarity regions with the bottom positive polarity connected to the main spot and the top one is connected to fields present outside the spot, probably moving magnetic features. The linear polarisation image suggest that perhaps these three regions are connected to each other and hence forming a complicated loop structures within few arcsec scales.
4 Summary
High spatial resolution observation of a decaying active region NOAA 0781 were studied. A set of instruments, DLSP, G-band & CaK imageries, and UBF for H-alpha images were used to obtain the observations. The data were then analysed for the morphological structures of the small scale fields present in and around this active region. The variations of the Stokes profiles observed in and around the UD and LB of this active region support the field free intrusion model suggested by Parker (1979). It is also observed that the edges of the LBs show strong linear polarisation signals compared to the center. The small scale fields surrounding this active region show opposite polarity profiles connected to the parent spot as well as to the surrounding magnetic field regions.
This active region was also monitored using the Michelson Doppler Imager (MDI) on-board SoHO. The spot decayed into plages few days after our observations. The MDI movie also showed bunch of opposite polarity moving magnetic features surging out of the parent spot. The opposite polarity small scale fields observed in the DLSP may belong to one such field region during the surge. A more detailed analysis combining the timing of the MDI observations with the DLSP observation is required to confirm this. The data from the co-ordinated TRACE observations may provide some more evidence on the morphological structures of these small scale loops at higher atmospheric layers.
Acknowledgments
The authors thank the DLSP team and the observers, Doug Gilliam, Mike Bradford, and Joe Elrod for their help during the observations.
References
- [1] Bharti, L. et al., 2007, MNRAS, in press.
- [2] Choudhury, A. R., 1986, Astrophys. J., 302, 809.
- [3] Jurcak, J., Martinez Pillet, V., & Sobotka, M., 2006, Astron. Astrophys., 453, 1079.
- [4] Langhans, K. et al., 2005, Astron. Astrophys., 436, 1087.
- [5] Leka, K. D., 1997, Astrophys. J., 484, 900.
- [6] Lites, B. W., & Socas-Navarro, H., 2004, Astrophys. J., 613, 600.
- [7] Lites, B. W. et al., 2004, Solar Phys., 221, 65.
- [8] Livingston, W., et al., 2006, Solar Phys., 239, 41.
- [9] Parker, E., 1979, Solar Phys., 37, 127.
- [10] Rimmele, T., & Marino, J., 2006, Astrophys. J., 646, 593.
- [11] Rimmele, T., 2004, Astrophys. J., 604, 906.
- [12] Rimmele, T., 2004, SPIE, 5490, 34.
- [13] Rimmele, T., & Sankarasubramanian, K., 2004, AAS, 204, 2701.
- [14] Sankarasubramanian, K. et al., 2006, In Casini, & Lites, editors, Solar Polarization 4, page 201, Astronomical Society of the Pacific, San Francisco.
- [15] Sankarasubramanian, K. et al., 2004, SPIE, 5171, 207.
- [16] Sankarasubramanian, K., Rimmele, T., & Lites, B., 2004, AAS, 204, 2006.
- [17] Sankarasubramanian, K., & Rimmele, T., 2003, Astrophys. J., 598, 689.
- [18] Schussler, M., & Vogler, A., 2006, Astrophys. J., 641, 73.
- [19] Sobotka, M., & Hanslmeier, A., 2005, Astron. Astrophys., 442, 323.
- [20] Sobotka, M., Brandt, P., & Simon, G., 1997, Astron. Astrophys., 328, 689.
- [21] Spruit, H., & Scharmer, G., 2006, Astron. Astrophys., 447, 343.