EUV spectra of highly-charged ions W54+-W63+ relevant to ITER diagnostics
Abstract
We report the first measurements and detailed analysis of extreme ultraviolet (EUV) spectra (4 nm to 20 nm) of highly-charged tungsten ions W54+ to W63+ obtained with an electron beam ion trap (EBIT). Collisional-radiative modelling is used to identify strong electric-dipole and magnetic-dipole transitions in all ionization stages. These lines can be used for impurity transport studies and temperature diagnostics in fusion reactors, such as ITER. Identifications of prominent lines from several W ions were confirmed by measurement of isoelectronic EUV spectra of Hf, Ta, and Au. We also discuss the importance of charge exchange recombination for correct description of ionization balance in the EBIT plasma.
pacs:
32.30.Rj, 32.70.Fw, 31.15.Am, 52.50.HvFuture fusion reactors, such as ITER, are to reach temperatures of about 20 keV to 25 keV [1]. While light elements (e.g., D, T, and C) will be completely ionized in the plasma core interior, heavy impurity ions will still possess a number of electrons. This could result in strong line emission, primarily in the x-ray region. Such radiation is the source of power losses that represent one of the major concerns for sustainable fusion. On the other hand, high resolution x-ray spectroscopy of impurities offers reliable measurements of important plasma parameters such as ion temperature , rotation velocities in toroidal and poloidal directions, and electron temperature [2]. Among all possible impurities in ITER, tungsten is expected to be the most abundant, since according to current planning the front surface of the divertor will be made of this element.
Extreme ultraviolet (EUV) line emission of impurities has attracted less attention than the x-ray lines, in part because the flux of emitted photons in the EUV region is typically smaller due to lower transition probabilities. Feldman et al[3] recently pointed out that a number of EUV lines from highly-charged tungsten (ion charge 53) may be reliably recorded in the ITER plasma and used for diagnostics of plasma temperature and impurities transport. They proposed, in addition to the traditional grazing incidence spectrometer, a system of segmented multilayer-coated telescopes for registration of EUV lines, similar to what is used in solar corona diagnostics (see, e.g., [4]). Other possibilities for registration of EUV lines in ITER are also discussed in the literature [2].
The objective of the present work is to investigate the EUV spectra from those highly-charged W ions that will be abundant in the plasma of ITER. The measurements of the spectra were performed with the Electron Beam Ion Trap (EBIT) at the National Institute of Standards and Technology (NIST). EBIT is a versatile light source, capable of producing nearly any ion charge state of nearly any element. A fine control of the charge state distribution in the trap is due to a very narrow electron energy distribution function (EEDF) of the beam (width 60 eV) [5]. A detailed description of the NIST EBIT can be found elsewhere [6]. The ions under study were injected into the EBIT using a multi-cathode, metal vapor vacuum arc (MEVVA) [7] designed for a rapid change of the injected element without downtime or alteration of experimental conditions. The EUV spectra between 4 nm and 20 nm were recorded with a grazing-incidence spectrometer described in detail in [8]. The instrument’s resolution is about 350, corresponding to a resolving limit of about 0.03 nm. The W spectra were calibrated with lines of highly-charged ions of Fe, with wavelengths taken from the NIST Atomic Spectra Database [9].
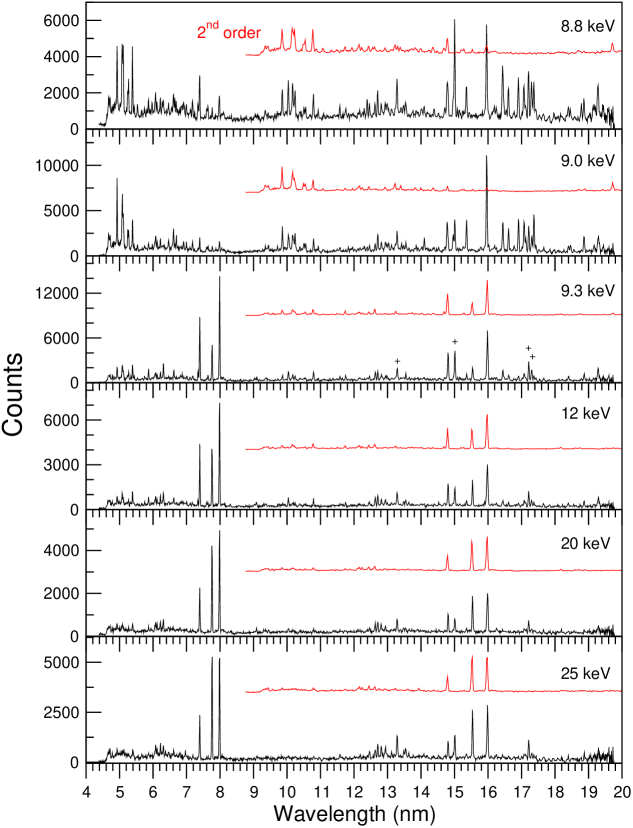
The measured spectra for six nominal electron beam energies varying from 8.8 keV to 25 keV are presented in figure 1. A typical value of the beam current was about 150 mA. Unlike our recent work on low-energy EUV tungsten spectra [10], here we did not use a zirconium foil to filter out light from wavelengths above 25 nm; this resulted in significantly higher signal-to-noise ratio near the edges of the spectral range. For easier visual identification of the second-order lines, the shifted spectra (red line) show the same experimental spectra with wavelengths multiplied by 2. The spectra also show a number of impurity lines, mainly from oxygen. The oxygen lines at 13.3 nm, 15.0 nm, 17.2 nm, and 17.3 nm are marked by crosses in the spectrum for = 9.3 keV (figure 1).
As with our previous studies of x-ray and EUV spectra of tungsten ions with lower charges ( = 37 to 47) [10, 11], identification of the spectral lines relies upon collisional-radiative modelling performed with the non-Maxwellian code NOMAD [12]. The Flexible Atomic Code (FAC) [13], based on the relativistic model-potential method and jj-coupling scheme, was used to generate all relevant atomic data such as energy levels, wavelengths, transitions probabilities, and collisional cross sections for the ions W54+ through W65+. Previous comparisons with the EBIT tungsten spectra at lower beam energies [10, 11] showed that FAC provides sufficiently accurate results for highly-charged ions. Using the FAC data, NOMAD calculates the ionization balance, level populations, and line intensities for the EBIT conditions. The EEDF in our simulations was modelled as a Gaussian peak with a full width at half maximum of 60 eV, and the electron density was set at = 21011 cm-3. The calculated spectra were convolved with a Gaussian instrumental function and relative efficiency curve of the spectrometer [8].
The identifications of the spectral lines, the measured and calculated wavelengths, transition types, and calculated radiative decay rates are presented in table 1. The total uncertainties in the wavelengths reported in the table are typically dominated by the uncertainty in the spectrometer calibration, rounded up to one significant digit. An additional statistical uncertainty due to fitting the reported line centers has been added in quadrature. To facilitate classification, for each state we also report a calculated level number in the energy-ordered list of levels within the corresponding ion stage. All identified spectral lines correspond to = 0 transitions within the = 3 shell. The -coupling identifications of the upper and lower levels that were obtained using the Cowan code [14] are only approximate due to strong spin-orbit interaction.
| Isoelectronic | A | ||||||
|---|---|---|---|---|---|---|---|
| Ion | sequence | Lower level | Upper level | Type | (nm) | (nm) | (s-1) |
| W54+ | Ca | 3d2 3F2 [1] | 3d2 3F3 [3] | M1 | 17.078(3) | 17.149 | 3.86106 |
| 3d2 3F2 [1] | 3d2 3P2 [4] | M1 | 14.961(3) | 14.980 | 1.81106 | ||
| W55+ | K | 3p63d 2D3/2 [1] | 3p63d 2D5/2 [2] | M1 | 15.961(3) | 16.007 | 2.60106 |
| 3p63d 2D5/2 [2] | 3p53d2 2G7/2 [6] | E1 | 6.622(3) | 6.5873 | 5.65106 | ||
| W56+ | Ar | 3p53d 3F3 [4] | 3p53d 3F4 [6] | M1 | 17.372(3) | 17.453 | 2.09106 |
| 3p53d 3D2 [5] | 3p53d 1D2 [7] | M1 | 17.137(3) | 17.189 | 8.71105 | ||
| 3p53d 3P1 [3] | 3p53d 1D2 [7] | M1 | 15.359(3) | 15.358 | 1.85106 | ||
| 3p53d 3D2 [5] | 3p53d 3D3 [8] | M1 | 14.785(3) | 14.787 | 2.54106 | ||
| 3p53d 3F3 [4] | 3p53d 3D3 [8] | M1 | 14.098(3) | 14.087 | 7.79105 | ||
| 3p6 1S0 [1] | 3p53d 3P1 [3] | E1 | 4.931(2) | 4.9279 | 6.14109 | ||
| W57+ | Cl | 3p43d 2F7/2 [5] | 3p43d 4D7/2 [7] | M1 | 17.428(3) | 17.530 | 6.07105 |
| 3p43d 2F7/2 [5] | 3p43d 4F9/2 [8] | M1 | 16.911(3) | 16.996 | 2.27106 | ||
| 3p43d 4D5/2 [3] | 3p43d 4D7/2 [7] | M1 | 16.613(3) | 16.669 | 1.84106 | ||
| 3p5 2P3/2 [1] | 3p43d 4D3/2 [2] | E1 | 5.254(2) | 5.2558 | 2.60109 | ||
| 3p5 2P3/2 [1] | 3p43d 4D5/2 [3] | E1 | 5.121(2) | 5.1209 | 4.20109 | ||
| W58+ | S | 3p33d 3F3 [5] | 3p33d 3F4 [7] | M1 | 16.444(3) | 16.466 | 2.59106 |
| 3p4 3P2 [1] | 3p33d 3D2 [3] | E1 | 5.280(2) | 5.2841 | 8.73109 | ||
| 3p4 3P2 [1] | 3p33d 3F3 [5] | E1 | 5.086(2) | 5.0912 | 1.53109 | ||
| W59+ | P | 3s23p23d 4F3/2 [2] | 3s23p3 2D5/2 [5] | E1 | 10.042(3) | 10.016 | 6.24107 |
| 3s23p3 2D5/2 [5] | 3s3p4 4P5/2 [7] | E1 | 7.607(3) | 7.6260 | 9.81109 | ||
| 3s23p3 2P3/2 [1] | 3s23p23d 4F3/2 [2] | E1 | 5.396(2) | 5.4037 | 1.241010 | ||
| W60+ | Si | 3s23p2 1D2 [3] | 3s3p3 3P2 [4] | E1 | 7.648(3) | 7.6660 | 1.231010 |
| 3s23p2 3P1 [2] | 3s3p3 3P2 [4] | E1 | 7.189(3) | 7.2436 | 1.541010 | ||
| W61+ | Al | 3s23p 2P1/2 [1] | 3s3p2 4P1/2 [2] | E1 | 7.404(2) | 7.3953 | 3.881010 |
| 3s3p2 4P1/2 [2] | 3s23p 2P3/2 [3] | E1 | 6.318(3) | 6.3246 | 3.05108 | ||
| W62+ | Mg | 3s2 1S0 [1] | 3s3p 3P1 [3] | E1 | 7.991(2) | 7.9904 | 1.821010 |
| W63+ | Na | 3s 2S1/2 [1] | 3p 2P1/2 [2] | E1 | 7.769(2) | 7.7617 | 4.371010 |
A straightforward method to match experimental and calculated line intensities consists in varying the theoretical beam energy until a reasonable agreement is achieved. While the calculated wavelengths agree well with the measurements, our modelling required significantly lower beam energies to reproduce the observed relative line intensities. For instance, for the highest nominal beam energy of EB = 25 keV, the best-fit theoretical energy was only 10.5 keV, while for EB = 8.8 keV the fit energy was about 6.2 keV. Although space-charge effects in the trap may effectively reduce the beam energy, for the present values of the nominal voltage and beam current this would result in a less than 300 eV shift.
Calculation of ionization balance in an EBIT plasma was a subject of several studies (e.g., [15, 16, 17, 18] and references therein). Each ion is normally modelled as one state with no internal structure, and approximate formulas, such as Lotz formula for ionization cross sections, are used for description of atomic processes. In constrast, our collisional-radiative modelling emphasizes the atomic physics component of simulations by implementing detailed descriptions of charge stages (about 1000 levels per ion) and relevant physical processes affecting populations of atomic levels. This is a necessary condition for the accurate modelling of well-resolved EBIT spectra.
It is known (e.g., [10]) that the relative line intensities within a particular ionization stage are only weakly sensitive to variations in the EBIT beam energy. Therefore the observed disagreement with the simulations is most likely due to modification of the ionization distribution in the EBIT plasma. This discrepancy can be explained by charge exchange (CX) with neutral particles (mostly nitrogen and oxygen) that are always present in the trap. First, note that the only important electron-ion recombination process in the EBIT is the radiative recombination. Dielectronic recombination (DR) would generally be very important for the high ion charges in question; however, it is an energy-selective process, and for all cases considered here the electron beam energy is outside the range of importance for DR. Our present calculations show that the typical radiative recombination cross sections for the relevant ions of tungsten are on the order of 10-21 cm2 (see also [19]). It is well known that the CX cross sections are normally much larger. The Classical Trajectory Monte-Carlo (CTMC) theory [20] gives the approximate dependence as:
| (1) |
and thus for 60 to 70 times ionized atoms the CX cross section is close to 10-13 cm2. This simple formula agrees within 40% with the semiempirical scaling law for charge exchange [16, 21] that is often used in charge distribution simulations of EBIT plasmas.
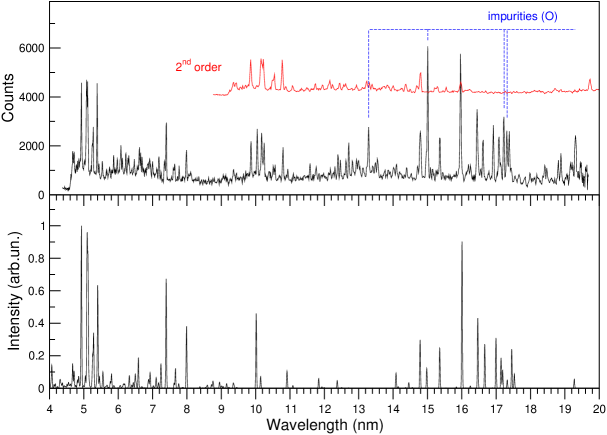
The CX rate depends on the density of the neutrals , relative velocity of neutrals and tungsten ions , and the cross section . For simplicity, the product , averaged over the relative energy distribution of neutrals and W ions, can be replaced by the product of and effective averaged velocity , so that the CX rate becomes . Both and are unknown parameters that may actually vary from measurement to measurement. (A slight enhancement of lower ionization stages at = 9.0 keV vs. = 8.8 keV may be due to this uncertainty.) However, since they enter only as a product, one can use this single parameter to fit the ionization balance. As there exist no calculations of CX for such highly-charged ions, we used the CX cross section of Eq. (1) and varied the product to reach agreement with experimental spectra. The example of correspondence for the most complex spectrum at = 8.8 keV is presented in Fig. 2. One can see that the calculated spectrum that uses only one fit parameter (the theoretical beam energy was fixed at 8.8 keV) correctly reproduces relative intensities for practically all observed lines. The derived value of 41013 cm-2s-1 is consistent with general estimates for and expected inside the EBIT. The best theoretical fit for the experimental spectrum at = 25 keV is obtained with 11013 cm-2s-1.
As mentioned above, our simulations were performed at = 21011 cm-3. Without CX, the ionization balance is practically independent of for a several-orders-of-magnitude span of densities. With CX, variations in would certainly modify ionization rates. However, since is a free parameter in our simulations, it can be appropriately adjusted to restore agreement with the experimental spectra. Thus, dependence on is effectively removed from the modelling.
At the lowest energies = 8.8 keV and 9.0 keV (see figure 1), one can clearly identify two groups of strong lines, namely, in the range of 4 nm to 8 nm and 14.5 nm to 17.5 nm. These lines originate from ions W54+ through W60+. As the beam energy increases, the ionization distribution shifts to higher charge states, and the three lines from Al-like W61+ ( = 7.404 nm), Mg-like W62+ ( = 7.991 nm), and Na-like W63+ ( = 7.769 nm) ions become the most prominent. The variation of their intensities agrees with the changes in the beam energy. These three lines will be easily resolved in plasmas of fusion reactors, and in addition, they cover a range of only 0.6 nm, so that determination of their relative intensities will be less dependent on the spectral sensitivity of EUV spectrometers.
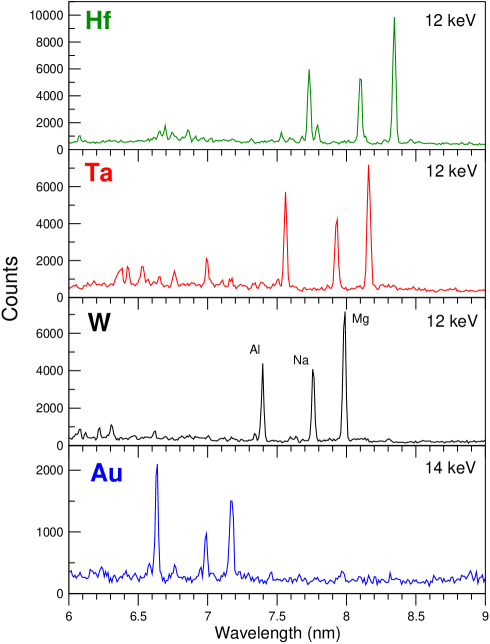
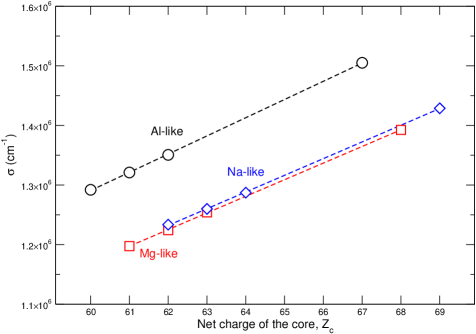
To confirm our identification of these strong lines in W, we also measured the EUV spectra for Hf (=72), Ta (=73), and Au (=79). The nominal beam energy for Au was 14 keV, while the Hf and Ta spectra were recorded at = 12 keV. This selection of energies provided ionization distributions similar to the 12 keV measurements for W. Figure 3 shows the recorded spectra between 6 nm and 9 nm, including the W results. The measured and calculated wavelengths for Hf, Ta, and Au are presented in Table 2. As these lines correspond to the transitions, the leading term in the transition energy difference should be proportional to the net charge of the atomic core = . This dependence is well confirmed in Fig. 4 which shows the linear fit results for wavenumbers . The fit [cm-1] = A – B agrees with the experimental data to within 0.1 % for the following fit coefficients (A,B): (3.056104, 5.428105) for the Al-like line, (2.791104, 5.052105) for the Mg-like line, and (2.801104, 5.043105) for the Na-like line. The derived coefficients can be used to predict wavelengths of these strong lines in other elements.
-
Hf Ta Au Sequence Transition expt calc expt calc expt calc Al 3s23p – 3s3p2 7.741 7.7297 7.570 7.5598 6.644 6.6459 Mg 3s2 – 3s3p 8.352 8.3456 8.169 8.1652 7.181 7.1902 Na 3s – 3p 8.107 8.0973 7.937 7.9270 6.999 7.0030
There exist only a few theoretical works on calculated energy levels, wavelengths, and transition probabilities for W ions with 54 63, with most efforts related to Na-like W63+. Ali and Kim [23] used multiconfiguration Dirac-Fock (MCDF) method to calculate the wavelength of the – transition in W55+, and their value of = 15.959 nm is within the experimental uncertainty. The wavelength of the 3s2 - 3s3p transition in Mg-like W62+ was calculated at = 8.0509 nm using the relativistic model-potential method [24], compared to our measured value of 7.991(2) nm. Among the recent calculations for the 3s1/2 - 3p1/2 transition in the Na-like ion, the MCDF [25, 26] and many-body perturbation theory (MBPT) [27] results should be mentioned. The latter give a wavelength = 7.7659 nm in very good agreement with the present experiment, and the MBPT transition probability A = 4.296 1010 s-1 agrees with our calculations within 2 %. The ab initio MCDF wavelength of Seely et al[25] = 7.7479 nm is also close to the measured value, while Baik et al’s result of = 7.8184 nm [26] is higher by 0.05 nm. Finally, the wavelength predicted in [25] by extrapolation along isoelectronic sequence, = 7.7661 nm, agrees well with the experiment.
The low electron density in the EBIT, two to three orders of magnitude lower than that in typical tokamaks, allows one to observe weak spectral lines that might be collisionally quenched in fusion reactors. A recently discussed example is provided by the magnetic-octupole line in the Ni-like W46+ [22], with a radiative transition probability on the order of s-1, that becomes quenched at densities above 1012 cm-3. The higher degree of ionization for the lines considered here should be more favorable for their survival as the most important =0 collisional cross sections decrease with an increase of ion charge. To test this assumption, we used the NOMAD code to solve the steady-state system of rate equations for approximately 6000 levels of the ions W54+ through W65+ at an electron temperature = 104 eV and density = 1014 cm-3. It was found that for all lines in table 1, including the weakest lines with transition probabilities A 106 s-1, the radiative decays are still the dominant depopulation process for the upper levels of corresponding transitions. This result remains valid for a large range of electron temperatures since the typical energy difference for collisional processes is much smaller than . Therefore, these lines will not be collisionally quenched in the ITER plasma.
To conclude, we presented here the first measurements of EUV spectra from highly-charged ( = 54 to 63) ions of W that are important for plasma diagnostics in ITER-class fusion reactors. Using advanced collisional-radiative modelling of line spectra from the non-Maxwellian plasma of EBIT, we identified 26 new electric-dipole and magnetic-dipole lines from 10 consecutive ionization stages W54+ through W63+. We also measured wavelengths of three important spectral lines for Al-, Mg-, and Na-like ions of Hf, Ta, and Au and used them to confirm our identifications of corresponding lines in W. These prominent lines may be used as tracer identifications in the ITER plasma interior. The increasing importance of charge exchange for ionization balance of high-Z ions in the EBIT plasmas was pointed out as well. A detailed description of the modelling and a discussion of various spectral features will be provided elsewhere.
References
References
- [1] See the special issue in 2007 Nucl. Fusion 47, volume 6.
- [2] Donné AJH, Costley AE, Barnsley R, Bindslev H, Conway G, Fisher R, Gianella, Hartfuss H, von Hellerman MG, Hodgson E, Ingesson LC, Itami K, Johnson D, Kawano Y, Kondoh T, Krasilnikov A, Kusama Y, Litnovsky A, Lotte P, Nielse P, Nishitani T, Orsitto F, Peterson BJ, Razdobarin G, Sanchez J, Sasao M, Sugie T, Vayakis G, Voitsenya V, Vukolov K, Walker C, Young K, and the ITPA Topical Group on Diagnostics 2007 Nucl Fusion 47 S337.
- [3] Feldman U, Seely JF, Landi E and Ralchenko Yu 2007 Nucl Fusion (submitted).
- [4] Delaboudiniere JP et al1995 Solar Physics 162 291.
- [5] McLaughlin DJ, Hahn Y, Takács E, Meyer ES and Gillaspy JD 1996 Phys. Rev.A 54 2040.
- [6] Gillaspy JD 1997 Phys. Scr.T 71 99.
- [7] Holland GE, Boyer CN, Seely JF, Tan JN, Pomeroy JM and Gillaspy JD 2005 Rev. Sci. Instrum.76 073304.
- [8] Blagojević B, Le Bigot E-O, Fahy K, Aguilar A, Makonyi K, Takács E, Tan JN, Pomeroy JM, Burnett JH, Gillaspy JD and Roberts JR 2005 Rev. Sci. Instrum.76 083102.
- [9] Ralchenko Yu, Jou F-C, Kelleher DE, Kramida AE, Musgrove A, Reader J, Wiese WL and Olsen K 2006 NIST Atomic Spectra Database (version 3.1.3), [Online]. Available: http://physics.nist.gov/asd3 [2007, September 15]. National Institute of Standards and Technology, Gaithersburg, MD.
- [10] Ralchenko Yu, Reader J, Pomeroy JM, Tan JN and Gillaspy JD 2007 J. Phys. B: At. Mol. Phys.40 3795.
- [11] Ralchenko Yu, Tan JN, Gillaspy JD, Pomeroy JM and Silver E 2006 Phys. Rev.A 74 042514.
- [12] Ralchenko YuV and Maron Y 2001 J. Quant. Spectrosc. Radiat. Transfer71 609.
- [13] Gu MF 2003 Astrophys J 582 1241.
- [14] Cowan RD 1981 The Theory of Atomic Structure and Spectra (Berkeley:University of California Press).
- [15] Penetrante BM, Bardsley JN, DeWitt D, Clark M and Schneider D 1990 Phys. Rev.A 43 4861.
- [16] Liu YF, Yao K, Hutton R and Zou Y 2005 J. Phys. B: At. Mol. Opt. Phys.38 3207.
- [17] Lu X, Watanabe H and Currell FJ 2003 Nucl Instr Meth Phys B 205 234.
- [18] Kalagin IV, Küchler D, Ovsyannikov VP and Zschornack Z 1998 Plasma Sources Sci. Technol.7 441.
- [19] Kim YS and Pratt RH 1983 Phys. Rev.A 27 2913.
- [20] Otranto S, Olson RE and Beiersdorfer P 2006 Phys. Rev.A 73 022723.
- [21] Selberg N, Biedermann C and Cederquist H 1996 Phys. Rev.A 54 4127.
- [22] Ralchenko Yu 2007 J. Phys. B: At. Mol. Phys.40 F175.
- [23] Ali MA and Kim YK 1992 J Opt Soc Am B 9 185.
- [24] Ivanova EP, Ivanov LN and Tsirekidze MA 1986 At Data Nucl Data Tables 35 419.
- [25] Seely JF, Brow CM, Feldman U, Ekberg JO, Keane CJ, MacGowan BJ and Kania DR 1991 At Data Nucl Data Tables 47 1.
- [26] Baik DH, Ohr YG, Kim KS, Lee JM, Indelicato P and Kim YK 1991 At Data Nucl Data Tables 47 177.
- [27] Johnson WR, Liu ZW and Sapirstein J 1996 At Data Nucl Data Tables 64 279.
- [28] Johnson WR, Liu ZW and Sapirstein J 1996 At Data Nucl Data Tables 64 279.