Galaxy Concentrations are Trimodal
Abstract
We have analysed the distribution of inclination-corrected galaxy concentrations in the Sloan Digital Sky Survey. We find that unlike most galaxy properties, which are distributed bimodally, the distribution of concentrations is trimodal: it exhibits three distinct peaks. The newly-discovered intermediate peak, which consists of early-type spirals and lenticulars, may contain of the number density and of the luminosity density of galaxies in the local universe. These galaxies are generally red and quiescent, although the distribution contains a tail of blue star-forming galaxies and also shows evidence of dust. The intermediate-type galaxies have higher apparent ellipticities than either disc or elliptical galaxies, most likely because some of the face-on intermediate types are misidentified as ellipticals. Their physical half-light radii are smaller than the radii of either the disc or elliptical galaxies, which may be evidence that they form from disc fading. The existence of a distinct peak in parameter space associated with early-type spiral galaxies and lenticulars implies that they have a distinct formation mechanism and are not simply the smooth transition between disc-dominated and spheroid-dominated galaxies.
keywords:
galaxies: structure — galaxies: fundamental parameters — galaxies: elliptical and lenticular, cD — galaxies: spiral1 Introduction
Morphological classification of galaxies dates back to the Hubble (1926) “Tuning Fork” that classified galaxies into ellipticals and spirals (and further into barred and unbarred spirals). More recent and quantitative classifications of large numbers of galaxies from current galaxy redshift surveys have upheld this bimodality, finding that morphological properties such as the global concentration of the light (e.g. as measured by the Petrosian concentration parameter ), the functional form of the surface brightness profile (e.g. exponential versus law, or the value of the Sérsic (1968) index), and the asymmetry are best decomposed into two populations: concentrated, smooth, de Vaucouleurs (or high ) ellipticals and diffuse, clumpy, exponential spirals. Properties of galaxies sensitive to their star formation histories, such as the global colour, the presence of nebular emission lines, the presence of spectral features symptomatic of young stars, and the detailed stellar populations when they can be resolved, are also decomposed into two populations: red, quiescent ellipticals full of old stars and blue, star-forming spirals with young stellar populations (see Shimasaku et al., 2001; Strateva et al., 2001; Blanton et al., 2003b; Baldry et al., 2004; Driver et al., 2006, and references therein).
At the joining point of the tuning fork lies the S0 or lenticular class. These are galaxies that are too flattened not to have a disc morphology, but that appear dominated by their spheroidal component and appear more similar to ellipticals than discs in their colour and environment. These intermediate galaxies may be a unique class of object with a particular formation scenario, such as disc fading, or they may simply represent the smooth transition from galaxies with low bulge-to-disc ratios, , to those with high .
If lenticulars have a unique formation scenario, they are likely to congregate in a particular region of galactic parameter space. In this paper, we test this possibility by studying the morphological distribution of galaxies in the Sloan Digital Sky Survey. Section 2 details the galaxy sample. In Section 3, we investigate the distribution of galaxy concentrations and find that they are trimodal. In Section 4, we investigate the properties of the newly-discovered intermediate class of galaxies. In Section 5 we discuss the implications of our results, and Section 6 contains our conclusions.
2 Selection of SDSS Galaxies
The Sloan Digital Sky Survey (SDSS) is a 5-band optical and near-infrared imaging and spectroscopic survey covering one quarter of the sky. (York et al., 2000). We use data from Data Release 6 (DR6; Adelman-McCarthy et al., 2007). Our sample consists of the galaxies that meet the Main Galaxy Sample targeting criteria (Strauss et al., 2002), and have spectra that are classified as galaxies with confident redshifts (). Petrosian magnitudes are used throughout, and -band quantities are used for all photometric parameters. K-corrections and terms are calculated using KCORRECT v4_1_4 (Blanton et al., 2003a). We assume , and when calculating distance moduli and angular diameter distances.
3 Morphological Trimodality
Intrinsic galaxy properties have been shown to be distributed bimodally. Measurements that are sensitive to the star formation properties of galaxies indicate that they are either (1) red, not currently forming stars, and have passively-evolving stellar populations, or (2) blue and actively star forming, while relatively few galaxies have intermediate properties. Similarly, morphological measurements, such as concentration, surface brightness profile, and visual appearance indicate that galaxies are either concentrated smooth elliptical galaxies with de Vaucouleurs-type profiles, or that they are extended disc galaxies with spiral structure and exponential profiles.
Here we focus on the -band Petrosian concentration , defined to be the ratio
| (1) |
where and are the radii enclosing and of the Petrosian flux respectively. Examination by eye of samples of galaxies with large values of , usually considered to be early-types, reveals that many appear to be disc systems. One way to further distinguish elliptical systems from discs is to consider their apparent axis ratio. Ellipticals, which are approximately spherical, cannot appear to have small apparent axis ratios from any viewing angle. Disc galaxies, on the other hand, can appear very flattened when viewed edge-on.
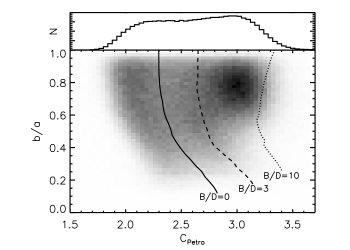
In Figure 1, we plot the distribution of galaxies in the - plane, where is the ratio of the isophotal minor and major axes. Three features are apparent in this diagram:
-
•
At the left, there is a band of galaxies extending from and to and . These low-concentration galaxies that extend to very extreme axis ratios are the classical late-type disc galaxies.
-
•
At the top right, there is a cloud of galaxies centered at and . These high-concentration round galaxies are the classical early-type elliptical galaxies.
-
•
Intermediate between these classes, there is a strip of galaxies extending from , to , , approximately along the curve. It is separated from both the late-type strip and early-type cloud by gaps, regions of parameter space that are much less populated.
We have also plotted on Figure 1 a histogram of the concentration parameters. Although the distribution of is bimodal, the “early-type” peak at high contains galaxies belonging both to the early-type cloud and to the intermediate-type strip.
The late-type and intermediate-type strips, both of which extend over a large range in axis ratio, follow a tilted locus in this plane: galaxies with smaller axis ratios are more concentrated. A similar trend among late-type disc galaxies (Sb and later) was noted and quantified by Yamauchi et al. (2005), who studied a sample of galaxies drawn from SDSS DR1 (Abazajian et al., 2003). Because there should be no difference between the intrinsic properties of galaxies with different apparent axis ratios111At least for disc galaxies, which are more or less axisymmetric and so differences in apparent axis ratio simply reflect different inclinations of the disc, this trend must be purely an inclination effect; indeed, when Yamauchi et al. (2005) calculated the Petrosian concentration using elliptical apertures instead of circular apertures, they found that it was independent of axis ratio. Rather than use their method, which would require re-analysing the images of each spectroscopic galaxy in DR6, we model the effect of inclination by constructing models of bulge+disc systems viewed at a variety of inclination angles and determining their apparent axis ratios, , and concentrations, . (see Appendix A for details). The relation we find for a pure exponential disc with no bulge is plotted as the solid curve labelled in Figure 1. The shape of this line matches the shapes of both the late-type and intermediate strips in the - plane. The disc locus is offset to slightly lower values of ; the reason for this is investigated in Appendix B. Using the relation between and , we define for each galaxy with observed concentration and axis ratio , a “normalised” concentration, :
| (2) |
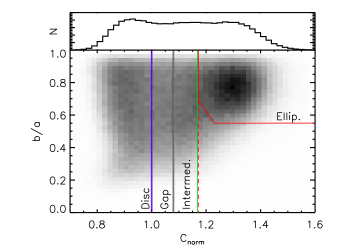
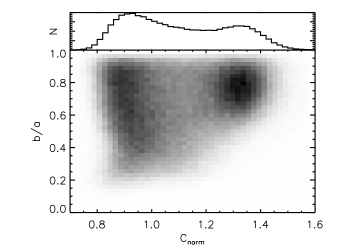
The distribution of galaxies in the - plane is shown in Figure 2, along with a histogram of values. The strong variation of with axis ratio is almost entirely eliminated when we use , validating its use as an inclination-independent measure of galaxy concentration.
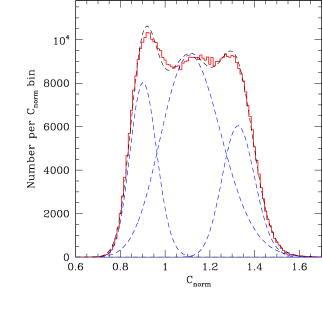
The distribution of indices is broad and appears at first glance to be multimodal. To carry out quantitative fits to the concentration distribution, we employed the RMIX package (MacDonald, 2007), a statistics code written with the programming language R. RMIX is designed to find best-fit combinations of multimodal histograms that can be built up from combinations of simple functional components (the allowed model functions include Gaussian, Poisson, gamma distributions among others). The number of components adopted to fit the data is user-defined, as are the means and variances of the model components, any of which can be constrained or determined by the fit, in arbitrary combinations as appropriate. 222The code is available from Peter MacDonald’s website at http://www.math.mcmaster.ca/peter/mix/mix.html.
In our case, the most basic question we are interested in is this: what is the minimum number of simple components needed to describe the distribution? It can quickly be found that no bimodal model built from any of these simple unimodal functions can fit the distribution adequately (typical goodness-of-fit values for bimodal models are ). A trimodal Gaussian model performs much better at . A four-mode Gaussian does still better, reaching the optimum . However, we have no particular reason aside from numerical convenience to adopt the Gaussian model. Another almost equally convenient model is the standard gamma distribution, given by
| (3) |
where () are parameters determining the shape and degree of symmetry. The function has a mean and variance . It is a more versatile function allowing for modest asymmetry. This extra degree of freedom allows us to match the data with a trimodal model and an optimum goodness-of-fit equal to , superior to the 4-mode Gaussian333We note in passing that a lognormal and trimodal distribution does almost as well. From a numerical standpoint, the main conclusion is that models built from standard fiducial functions that are unimodal but allow for some asymmetry can provide excellent fits to the data. This result is shown in Figure 3. The mean values for the three modes are (0.906, 1.127, 1.330), standard deviations (0.059, 0.135, 0.073) and proportions (0.220, 0.577, 0.203). The sample size is so large that each parameter is internally uncertain to less than 1%. The parameters of these fits are given in Table 1
| Peak | Fraction | Mean | Standard Deviation |
|---|---|---|---|
| Raw Number Counts | |||
| Low | |||
| Intermediate | |||
| High | |||
| Comoving Number Density | |||
| Low | |||
| Intermediate | |||
| High | |||
| Comoving Luminosity Density | |||
| Low | |||
| Intermediate | |||
| High | |||
| Subsample | |||
| Low | |||
| Intermediate | |||
| High | |||
The strong conclusion from this analysis is that, if we describe the distribution by assuming that it is built up from a combination of unimodal components with relatively simple forms, then bimodal solutions are strongly ruled out and three components are are a necessary and sufficient condition. This is in contrast to the bimodal distribution usually associated with many other galaxy properties. We identify the galaxies in the middle peak (the green strip in Figure 2) as “intermediate” type galaxies that are structurally distinct both from early- and late-type galaxies.
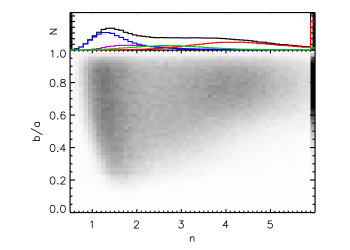
Because the Petrosian concentration parameter sometimes behaves unintuitively (see Appendix B), it is worth confirming that other measures of galaxy concentration also exhibit trimodality. One common measure is the Sérsic (1968) index, which equals for a pure exponential profile and for a de Vaucouleurs (1948) profile. The NYU Value Added Galaxy Catalog (NYU-VAGC Blanton et al., 2005) contains Sérsic profile fits to most galaxies in the SDSS. We have cross-matched the version of NYU-VAGC based on SDSS DR6444http://sdss.physics.nyu.edu/vagc/ against the galaxies in our sample. The distribution of galaxies in the - plane is shown in Figure 4, along with a histogram of indices. The profile fitting procedure used in the NYU-VAGC has a maximum of , resulting in the artificial peak visible in this figure. As with , is affected by disk inclination, with higher measured concentrations for more highly inclined galaxies. The coloured histograms in Figure 4 show the distributions of for each population identified in Figure 2 by their values. It is clear that the distinct populations of concentration identified by also exist when concentration is measured by the Sérsic index, and that the trimodality we detect is not an artefact of the Petrosian concentration measure, but is an intrinsic feature of the galaxy distribution.
4 Properties of Intermediate Type Galaxies
In § 3 we discovered a third “intermediate” type of galaxy that lies in a distinct region of morphological parameter space from late-type disc galaxies and early-type elliptical galaxies. In this section, we examine the properties of the galaxies that fall into this classification.
4.1 Global properties
We begin by noting that the locus of intermediate type galaxies in the - plane has the same shape as the locus of late-type galaxies that are clearly discs, and we may therefore infer that their morphology is at least partly disc-like. To estimate the degree of disciness in these galaxies, we have plotted model bulge+disc systems for comparison on Figure 1 for three different ratios (see Appendix A for details). The curve lies along the locus of intermediate-type galaxies, suggesting that these systems are 75% bulge and 25% disc; note, however, that observed late-type disc galaxies are less concentrated than the model (see discussion in Appendix B), and therefore our inferred for intermediate-type galaxies may be an underestimate.
We have split the galaxies into the regions denoted in Figure 2: “Disc” galaxies with ; “Gap” galaxies that lie between the disc peak and the intermediate peak, ; “Intermediate”-type galaxies with ; and “Elliptical” galaxies that lie at higher and have higher axis ratios (see Figure 2 for the exact definition). When we require samples that are unbiased in axis ratio, we extend the elliptical sample to all axis ratios, although the galaxies with and lower axis ratios appear to have more in common with intermediate-type galaxies than with true ellipticals.
In Figure 5, we show images of SDSS galaxies that span the - parameter space. They were chosen to have typical absolute magnitudes (555 is the absolute dereddened -band magnitude, where is the -band redshifted to and is used to minimize errors due to uncertainties in the -correction.; see Figure 6) and to be close enough to us for their morphology to be apparent (), but were otherwise chosen randomly. The “disc” galaxies all appear to be late-type star-forming spiral galaxies. Both “gap” and “intermediate” galaxies appear redder than their disc counterparts. Although they generally show evidence of discs, most are bulge-dominated and would be classified as early-type spirals or possibly lenticulars. Finally, all galaxies in the “elliptical” sample with large axis ratios appear to be classical early-type passive elliptical galaxies, while those with smaller axis ratios appear more like lenticulars.
Most properties of galaxies in the gap mirror those of intermediate types. This is expected from examination of Figure 3, which reveals that although “gap” galaxies are located at a local minimum in the distribution, their numbers are dominated by the relatively wide intermediate peak. We will therefore refer to “gap” and “intermediate” galaxies together as “intermediate” types for the remainder of this paper, except for the few cases where their properties differ.
The basic properties of the intermediate class of galaxies are shown in Figure 6. Panel (a) shows the observed -band magnitude. Intermediate-type galaxies in the SDSS Main Galaxy sample are on average fainter than disc galaxies, which are themselves fainter than elliptical galaxies. Panel (b) shows the absolute magnitude distribution. The absolute magnitudes of intermediate-type galaxies are similar to those of disc galaxies at the luminous end, but there are fewer intermediate-type galaxies in the low-luminosity tail; in contrast, the distribution of elliptical galaxies peaks magnitudes brighter. The redshift distribution is shown in panel (c). Although the shape of the distribution for intermediate-type galaxies is more similar to that of late-type discs than of early-type ellipticals, the peak of the distribution is shifted to higher redshifts, which is responsible for the fainter apparent magnitudes seen in panel (a).
In panel (d), we attempt to quantify the density of the environment surrounding each galaxy in order to investigate how the three galaxy types participate in the well-known morphology-density relation (e.g. Dressler, 1980). We quantify the local environment by the number of neighbouring galaxies at within a projected radius of Mpc and with observed redshifts within of the galaxy in question. We only use galaxies at in this figure, for which the sample of neighbours is complete to the SDSS Main Galaxy magnitude limit. We recover the morphology-density relation: galaxies surrounded by more than bright neighbours are far more likely to be elliptical galaxies than to be disc galaxies, while galaxies surrounded by less than bright neighbours are far more likely to be discs. The environments of intermediate-type galaxies are almost exactly intermediate between those of discs and ellipticals: the fraction of galaxies in low density regions, i.e. with less than bright neighbours, is , and for “disc”, “intermediate” and “elliptical” galaxies respectively.
4.2 Number and luminosity density
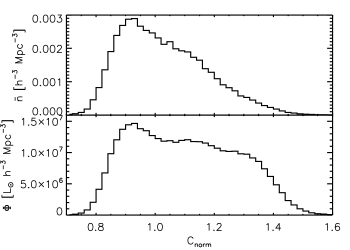
In order to determine the fraction of the total galaxy population represented by the intermediate-type galaxies, we have plotted the comoving number density and luminosity density of SDSS galaxies as a function of in Figure 7, correcting for the effective surveyed volume for each galaxy. When calculating the volume densities, we have restricted the survey to , , and in order to minimize statistical fluctuations in the term. By number, late-type disc galaxies appear most prominent, although a large bump at intermediate concentrations is visible. When weighted by luminosity, the trimodality of the galaxy population is very apparent. We have performed unconstrained trimodal fits to both distributions and listed the parameters in Table 1. The location and width of each peak match those found from fitting the raw number counts very well, indicating that the fits are identifying the same populations. We conclude from these fits that intermediate-galaxies have a comoving number density of and a comoving -band luminosity density of , representing of the total number density and of the total luminosity density of galaxies.
4.3 Colours, spectra and apparent shapes
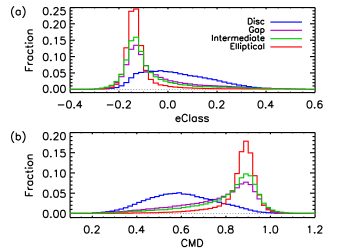
In Figure 8, we show how observables that are sensitive to star formation history vary among galaxy types. We quantify the star formation history using two properties: the spectroscopic PCA eClass parameter, which is positive for star-forming galaxies and negative for quiescent galaxies, and the location of the galaxy on the colour-magnitude diagram (), which we quantify as
| (4) |
i.e. it is the colour after taking out the slope of the colour-magnitude relation for SDSS galaxies, normalized at . Late-type blue galaxies have while early-type red galaxies have . The distribution of star formation histories among intermediate-type galaxies does not appear to be the sum of disc and elliptical contributions, which would result in two distinct peaks (particularly in the CMD distribution), but instead is dominated by a distinct peak of quiescent red galaxies with a tail of residual blue star-forming galaxies.
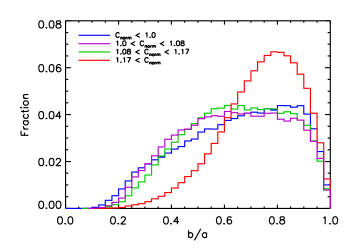
In Figure 9, we plot the distribution of apparent axis ratios for galaxies of different concentration . For this figure, we include all galaxies with in the “elliptical” bin in order to have a sample that is unbiased in . The distribution of elliptical galaxy shapes is strongly peaked at , and very few galaxies have small axis ratios; as seen in Figure 5, those few very flattened galaxies appear more similar to “intermediate”-type galaxies than to circular elliptical galaxies. The disc galaxies also peak at high , but with a very broad distribution that includes many very flattened systems, as expected for their intrinsically disc-like morphology.
On the other hand, the apparent axis ratios of “intermediate” galaxies is peculiar. It peaks at , with a decline to both lower and higher apparent axis ratios, and the peak at low would be even further enhanced if the low- “elliptical” galaxies were considered as intermediate types. If the morphology of intermediate galaxies is relatively disc-like, as implied by the distribution of intermediate-type galaxies in the - plane, then why is there a deficit of apparently round galaxies? If the morphology is a combination of flattened disc with almost spherical bulge, as suggested by the dashed line in Figure 1, how can the combination appear more flattened than either pure discs or pure bulges?
We suggest five possible explanations for the unusual distribution of apparent axis ratios of intermediate-type galaxies:
-
1.
The discs may be elliptical, and the decline as reflects the deficit of intrinsically axisymmetric galaxies. Indeed, the dark matter haloes that host galaxies are expected to be triaxial (Allgood et al., 2006, and references therein), and therefore galactic discs that form in these haloes should be elliptical. However the required typical disc ellipticity of is much higher than the median disc ellipticity of that Ryden (2004) inferred from -band isophotal axis ratios or than the ellipticities that can be generated in self-consistent massive discs by triaxial dark matter haloes (Bailin et al., 2007).
-
2.
The galaxies may be intrinsically prolate objects, and therefore appear elongated from most viewing angles. We consider this unlikely both because the locus of intermediate-type galaxies in the - plane has the same shape as that of the late-type galaxies that are known to be discs, and because early-type galaxies with high ellipticities have predominantly discy isophotes (Hao et al., 2006).
-
3.
Alam & Ryden (2002) found that red disc galaxies in SDSS have higher apparent ellipticities than blue disc galaxies simply due to the combination of dust and inclination effects, which causes edge-on disc galaxies to appear redder. As our intermediate galaxies are redder than our disc galaxies (see Figure 8) and show evidence of dust (see below), they could simply be the analog of Alam & Ryden (2002)’s dusty edge-on discs. However, we know that the disc and intermediate galaxies are intrinsically different for two reasons: (1) the effect of dust, which is centrally concentrated, would be to decrease the measured concentration when discs are viewed edge-on, while our intermediate galaxies have higher concentrations than our disc galaxies; and (2) the gap between the disc and intermediate galaxies in the - plane persists even to the most face-on galaxies, where dust can no longer be important. We therefore discount this explanation.
-
4.
Intermediate-type galaxies with face-on discs may appear more concentrated than their edge-on counterparts, and therefore have large enough to fall into the elliptical classification. There are two potential effects that could cause this:
-
(a)
The measured concentration of bulge+disc systems is not a monotonic function of bulge-to-disc ratio; as seen from the line in Figure 1, the addition of a small face-on disc to a spheroidal galaxy increases the measured concentration over that of a small edge-on disc or even of a pure spheroid! The reason for this is investigated in Appendix B. A consequence is that lines of constant in the - plane can be tilted to higher at higher . However, we do not find a single value of that can both explain galaxies on the intermediate-type locus and in the elliptical cloud.
-
(b)
The face-on intermediate galaxies may contain a luminous feature in the central region that is obscured by dust when seen edge-on. As noted below, we see evidence for dust-obscured central star formation in the high-eccentricity intermediate-type population; such star formation is likely to contribute a non-negligible amount of flux in the inner regions of the galaxy, which would increase the measured concentration when it is visible.
Evidence for an explanation of this form comes from the apparent bridge between the elliptical and intermediate groups at and .
-
(a)
Our favoured explanation, which is consistent with all the observations, is the last one: face-on intermediate-type galaxies appear to be ellipticals in the - plane due to central star formation that increases the measured concentration.
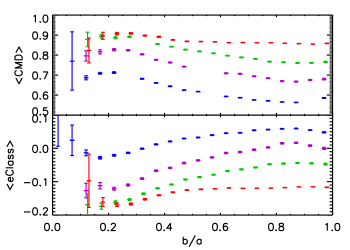
To further investigate how the properties of galaxies depend on the axis ratio, we have plotted in Figure 10 the mean and eClass parameters as a function of apparent axis ratio. As in Figure 9, the “elliptical” class here includes all galaxies with regardless of . We do not expect the intrinsic star formation properties of galaxies of a given morphological type to depend strongly on the intrinsic axis ratios, and therefore any variation we see is likely due to obscuration effects. Indeed, we find that the properties of elliptical galaxies, which do not contain much dust, are almost independent of apparent axis ratio for . Among the more flattened ellipticals, there is a trend, but it is almost identical to that of the intermediate galaxies, and we believe that the galaxies in this region of parameter space are more likely to be intermediate galaxies with unusually high concentrations than elliptical galaxies with unusually small axis ratios. Disc galaxies show a significant tendency to appear redder and to have less apparent star formation when viewed edge-on than face-on. This is most easily interpreted as due to dust obscuration of star forming regions. The apparent star formation properties of intermediate galaxies show a perfectly analogous trend with apparent axis ratio as disc galaxies: they appear significantly redder and more quiescent when viewed edge-on. However, at a given axis ratio the intermediate galaxies are magnitudes redder and have an eClass that is lower than the equivalent disc galaxies. Among the most edge-on galaxies, the redness and apparent quiescence of intermediate-type galaxies even surpass those of the ellipticals. Therefore, many intermediate-type galaxies must contain dust that obscures star formation when they are viewed edge-on. It is interesting to note that this is the only figure (and, to a much lesser degree, Figure 8) in which we find a significant difference between the properties of “gap” and “intermediate” galaxies: the colours and spectra of “gap” galaxies of a given apparent axis ratio lie exactly between those of the equivalent “disc” and “intermediate” galaxies.
4.4 Sizes
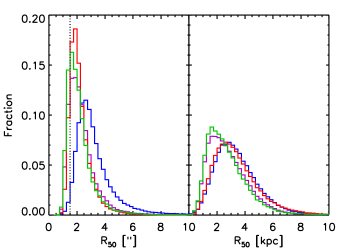
In Figure 11, we plot the Petrosian half-light radii of our galaxies, both in angular size and in physical kpc. A clear feature in both panels is that the intermediate class of galaxies are smaller than the other classes of galaxies.
The typical seeing FWHM in the SDSS images is , so a point source would have a measured half-light radius of , and values that are in this regime may have been artificially inflated by seeing. As the median of the intermediate-type galaxies is only , perhaps the concentration of these galaxies is subject to resolution effects and the presence of a peak at intermediate concentrations is merely an artefact.
In Figure 12, we have reconstructed the - distribution and histogram of Figure 2 using only the most well-resolved galaxies, those with . The intermediate peak in the histogram has indeed disappeared, as has the strong vertical feature at , However, there is still a significant population at and , and the very bottom-heavy distribution of among the galaxies at intermediate concentrations is still evident. We also note that among these well-resolved galaxies, the elliptical galaxy cloud is much smaller and has moved to higher .
There are two possible explanations for the distribution of intermediate galaxies:
-
1.
The trimodality is an artefact of seeing. Specifically, some population of galaxies from an intrinsically bimodal distribution artificially congregates in the “intermediate” region of parameter space when poorly resolved.
-
2.
The intrinsic sizes of intermediate-type galaxies are smaller than elliptical and disc galaxies, and they therefore happen to typically be poorly-resolved given their redshift distribution.
We consider the first explanation unlikely for the following reasons. Firstly, the difference between the size distributions of intermediate galaxies vs. of discs and ellipticals is most prominent when plotted in physical units, rather than angular units. Secondly, a trimodal fit to the distribution of just the most well-resolved galaxies is strongly preferred over a bimodal fit, with an intermediate peak located at the same mean and with the same width as the fit to the full sample (see Table 1). Thirdly, seeing spreads the central light of a galaxy out, and therefore the net effect should be to decrease . This is indeed what we see among the elliptical galaxies in Figure 12: the elimination of the poorly-resolved galaxies increases the typical concentration. Seeing also circularizes the light profile, but at a much smaller radius than the isophotal radius for most of these galaxies. Therefore, the effect of seeing is to move galaxies to the left (and possibly upwards) on Figure 2. In order for a population of galaxies to be artificially moved onto the intermediate-type locus by seeing, that population must lie to the right of (and possibly down from) the intermediate galaxies. However, this part of parameter space, at high and low , is among the most sparsely populated in Figures 2 and 12, making this explanation very unlikely.
Since does not always behave as expected (see Appendix B), another possibility is that for these galaxies, is actually increased by the effects of seeing, and the intermediate region of parameter space is populated by poorly-resolved disc galaxies. However, this explanation is also untenable: intermediate-type galaxies are red and have passive spectra while disc galaxies are blue and have star forming spectra. Moreover, the distribution of axis ratios among intermediate-type galaxies is dominated by low values of while those of disc galaxies are dominated by high , and seeing cannot decrease .
While the second explanation is uncomfortable in that it proposes that a new class of galaxies identified morphologically are coincidentally not well-resolved, it is the only explanation that is consistent with the other properties of these galaxies, and we therefore conclude that it is correct.
5 Discussion
The key question prompted by our results is why there is an overdensity of galaxies at with unique properties. These galaxies appear to be a combination of early-type spiral galaxies and S0/lenticular galaxies; does the existence of this overdensity imply that early spirals and lenticulars have a unique formation mechanism?
The most commonly proposed scenario for forming lenticulars is that they are the remnants of later-type disc galaxies whose discs fade (and therefore whose ratios increase) when they run out of fuel for star formation due to rapid gas loss after they enter the cluster environment, either through ram pressure stripping (Gunn & Gott, 1972) or strangulation (Larson et al., 1980). The morphological transformation may also be augmented by the effects of galaxy-galaxy interactions within the denser environment (Bekki, 1998). Some properties of the intermediate-type galaxies in our sample are consistent with this scenario. In particular, the small physical scale sizes of intermediate-type galaxies are precisely what would be expected if the luminosity of the extended disc declines relative to that of the concentrated bulge. On the other hand, if a cluster environment is required to produce intermediate-type galaxies, then they should be found exclusively in clusters and be even more biased towards lying in clusters than ellipticals, while we find that of intermediate-type galaxies are in low-density environments, significantly more than the of elliptical galaxies found in these regions. Finally, if intermediate-type galaxies are produced by faded disc-type galaxies, then the bright end of the intermediate-type sample would be fainter than the bright end of the disc-type sample, while we find that the brightest intermediate-type galaxies are, if anything, brighter than the brightest discs. However, if the bright end of the disc sample has already been depopulated by this process at then the observed luminosity distributions may be consistent with the disc-fading scenario.
Interestingly, Bendo et al. (2007) find a qualitative difference between the compactness of the dust emission, a good tracer of the interstellar medium (ISM), in early-type spirals (S0–Sab) and late-type spirals (Sc and later): a large fraction of the early-type spirals have a centrally-concentrated ISM, while virtually all of the late-type spirals have extended ISM distributions. This dichotomy they see between the ISM concentration of the two classes of disc galaxies mirrors the dichotomy we see between the concentration of the stellar light between late-type disc galaxies and the more bulge-dominated intermediate-type galaxies.
One further consequence of our results is that a non-negligible fraction of galaxies that have been identified as early-type galaxies in studies that classify galaxies using colours, spectra, or even , are actually members of a distinct intermediate class. Even in this study, it may be that many of the face-on intermediate galaxies are misidentified as elliptical galaxies.
6 Conclusions
We have analysed the locations of SDSS galaxies in the Petrosian concentration vs. isophotal axis ratio plane. Disc galaxies occupy a slanted curve in this plane due to inclination effects: more edge-on galaxies have higher . We have corrected for this and defined a new inclination-independent concentration index . Unlike most galaxy properties (including ), which are distributed bimodally, the distribution of is trimodal, with a third peak intermediate between the low-concentration disc galaxies and the high-concentration elliptical galaxies.
We have studied the properties of this newly-identified intermediate class of galaxy, which represents of the total number density and of the luminosity density of galaxies detectable in SDSS. Most intermediate-type galaxies have colours and spectra typical of early-type galaxies, although a non-negligible number are blue and star forming. The location of these galaxies on the - plane indicates that they have discs. The concentrations are indicative of typical bulge-to-disc ratios of , although this may be an underestimate. The colours and spectra of intermediate-type galaxies vary with inclination (edge-on galaxies are redder and appear to be more passive), indicative of dust. The fraction of blue star-forming galaxies among the intermediate class may be underestimated due to dust obscuration of star-forming regions. The typical absolute magnitudes and half-light radii of the SDSS intermediate-type galaxies are and respectively. The physical sizes of the intermediate-type galaxies are significantly smaller than those of both ellipticals and discs.
Intermediate-type galaxies have much higher apparent ellipticities than either disc or elliptical galaxies. Our preferred explanation is that these galaxies contain residual central star formation that is obscured by dust when viewed edge-on; therefore, the measured concentration is higher when viewed face-on and these galaxies merge into the region of parameter space occupied by high-concentration ellipticals.
Associating our intermediate class of galaxies with lenticulars and early-type spirals, we propose that the existence of a distinct peak in parameter space implies that there is a particular formation mechanism responsible for the creation of the earliest-type spiral galaxies.
Ackowledgments
We thank Greg Rudnick and Dennis Zaritsky for useful conversations, and the anonymous referee of a previous paper, whose comments sparked this line of inquiry.
Funding for the Sloan Digital Sky Survey (SDSS) and SDSS-II has been provided by the Alfred P. Sloan Foundation, the Participating Institutions, the National Science Foundation, the U.S. Department of Energy, the National Aeronautics and Space Administration, the Japanese Monbukagakusho, and the Max Planck Society, and the Higher Education Funding Council for England. The SDSS Web site is http://www.sdss.org/.
The SDSS is managed by the Astrophysical Research Consortium (ARC) for the Participating Institutions. The Participating Institutions are the American Museum of Natural History, Astrophysical Institute Potsdam, University of Basel, University of Cambridge, Case Western Reserve University, The University of Chicago, Drexel University, Fermilab, the Institute for Advanced Study, the Japan Participation Group, The Johns Hopkins University, the Joint Institute for Nuclear Astrophysics, the Kavli Institute for Particle Astrophysics and Cosmology, the Korean Scientist Group, the Chinese Academy of Sciences (LAMOST), Los Alamos National Laboratory, the Max-Planck-Institute for Astronomy (MPIA), the Max-Planck-Institute for Astrophysics (MPA), New Mexico State University, Ohio State University, University of Pittsburgh, University of Portsmouth, Princeton University, the United States Naval Observatory, and the University of Washington.
References
- Abazajian et al. (2003) Abazajian, K. et al. 2003, AJ, 126, 2081
- Adelman-McCarthy et al. (2007) Adelman-McCarthy, J. K. et al. 2007, ApJS, 707, submitted, arXiv:0707.3413
- Alam & Ryden (2002) Alam, S. M. K., Ryden, B. S. 2002, ApJ, 570, 610
- Allgood et al. (2006) Allgood, B., Flores, R. A., Primack, J. R., Kravtsov, A. V., Wechsler, R. H., Faltenbacher, A., Bullock, J. S. 2006, MNRAS, 367, 1781
- Bailin et al. (2007) Bailin, J., Simon, J. D., Bolatto, A. D., Gibson, B. K., Power, C. 2007, ApJ, 667, 191
- Balcells et al. (2007) Balcells, M., Graham, A. W., Peletier, R. F. 2007, ApJ, 665, 1104
- Baldry et al. (2004) Baldry, I. K., Glazebrook, K., Brinkmann, J., Ivezić, Ž., Lupton, R. H., Nichol, R. C., Szalay, A. S. 2004, ApJ, 600, 681
- Bekki (1998) Bekki, K. 1998, ApJ, 502, L133
- Bendo et al. (2007) Bendo, G. J. et al. 2007, MNRAS, 380, 1313
- Blanton et al. (2003a) Blanton, M. R. et al. 2003a, AJ, 125, 2348
- Blanton et al. (2003b) Blanton, M. R. et al. 2003b, ApJ, 594, 186
- Blanton et al. (2005) Blanton, M. R. et al. 2005, AJ, 129, 2562
- de Vaucouleurs (1948) de Vaucouleurs, G. 1948, Annales d’Astrophysique, 11, 247
- Dressler (1980) Dressler, A. 1980, ApJ, 236, 351
- Driver et al. (2006) Driver, S. P. et al. 2006, MNRAS, 368, 414
- Gunn & Gott (1972) Gunn, J. E., Gott, J. R. I. 1972, ApJ, 176, 1
- Hao et al. (2006) Hao, C. N., Mao, S., Deng, Z. G., Xia, X. Y., Wu, H. 2006, MNRAS, 370, 1339
- Hernquist (1990) Hernquist, L. 1990, ApJ, 356, 359
- Hubble (1926) Hubble, E. P. 1926, ApJ, 64, 321
- Larson et al. (1980) Larson, R. B., Tinsley, B. M., Caldwell, C. N. 1980, ApJ, 237, 692
- MacDonald (2007) MacDonald, P. D. M. 2007, documentation and code at http://www.math.mcmaster.ca/peter/mix/mix.html, Department of Mathematics and Statistics, McMaster University
- Pohlen & Trujillo (2006) Pohlen, M., Trujillo, I. 2006, A&A, 454, 759
- Ryden (2004) Ryden, B. S. 2004, ApJ, 601, 214
- Sérsic (1968) Sérsic, J. L. 1968, Atlas de galaxias australes (Cordoba, Argentina: Observatorio Astronomico, 1968)
- Shimasaku et al. (2001) Shimasaku, K. et al. 2001, AJ, 122, 1238
- Strateva et al. (2001) Strateva, I. et al. 2001, AJ, 122, 1861
- Strauss et al. (2002) Strauss, M. A. et al. 2002, AJ, 124, 1810
- Yamauchi et al. (2005) Yamauchi, C. et al. 2005, AJ, 130, 1545
- York et al. (2000) York, D. G. et al. 2000, AJ, 120, 1579
Appendix A Models of Bulge+Disc Systems
We have constructed models of bulge+disc systems in order to determine the Petrosian concentration and isophotal axis ratio that would be measured when a given system is viewed at an inclination , where is face-on. To do this, we first calculate the galactic density on a fine 3D grid:
| (5) |
where
| (6) |
| (7) |
and the transformation from the Cartesian observed coordinates to the cylindrical/spherical galactic coordinates are
| (8) |
| (9) |
| (10) |
The Hernquist (1990) bulge that we use has a projected surface density profile very similar to the empirical de Vaucouleurs (1948) profile, with for effective radius , but is much simpler than the 3D deprojection of the law. The normalization constants and are chosen so that the ratio of the total mass of each component is equal to the desired bulge-to-disc ratio, . We then project the 3D distribution down to 2D by summing over the axis. We set down annuli wide with inner radii ranging from to , and calculate the total flux in each annulus along with the mean flux per unit area within the annulus. The Petrosian radius is defined to be the radius at which the ratio of the local surface brightness in the annulus to the mean enclosed surface brightness (the Petrosian ratio) equals . The Petrosian flux is the enclosed flux within and the Petrosian concentration is defined to be the ratio of and , the radii enclosing and of the Petrosian flux respectively:
| (11) |
Finally, we calculate the isophotal axis ratio by finding the radius along the minor axis at which the mean flux is equal to the mean flux at radius along the major axis. The ratio between these radii is . The derived axis ratio is relatively insensitive to the radius at which it is measured.
Appendix B Subtleties of the Petrosian Concentration Index
While modelling the concentration of bulge+disc galaxies, we have discovered several unintuitive behaviours of the Petrosian concentration index. We discuss two of these here: in Section B.1, we investigate why observed late-type disc galaxies have lower values of than idealized exponential discs, while in Section B.2, we investigate why the concentration of bulge+disc systems is not monotonic with bulge-to-disc ratio.
B.1 The low concentration of disc galaxies
In Figures 1 and 2, the observed late-type disc galaxies have lower concentrations than expected for a pure exponential disc with no bulge (the curve and respectively). In the naïve picture in which a galaxy is composed of a superposition of a low-concentration disc and a high-concentration bulge, it is impossible to construct a galaxy with . Why, then, is this the region of parameter space populated by disc galaxies?
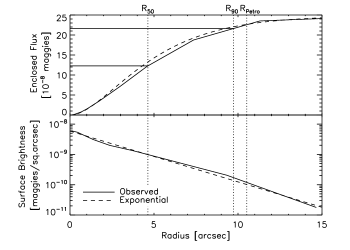
To investigate this, we have plotted in Figure 13 the surface brightness profile and enclosed flux profile of a sample galaxy in this region of parameter space (it is the galaxy at , in Figure 5), along with the best-fit exponential profile, which would have . It can be seen that the observed profile does not follow the pure exponential, but rather has three features: a central concentration (at ), an exponential disc that is shallower than the best-fit exponential (), and a steeper exponential at large radius. Such outer truncations are well-known observationally, especially among the latest-type spiral galaxies (Pohlen & Trujillo, 2006).
The radius, , is determined by the global size of the disc, and is therefore not a strong function of the detailed flux distribution. This can be seen by how similar the observed (solid) and idealized exponential (dashed) enclosed flux curves are in the region surrounding . However, lies in a region where the observed surface brightness profile is significantly shallower than the best-fit exponential, and therefore is pushed to larger radii. This combination decreases the measured concentration relative to that of a pure exponential, resulting in . Such profiles are extremely common amongst disc galaxies, and therefore the late-type disc galaxy locus is centred at rather than as one would naïvely expect.
B.2 The high concentration of bulge-dominated disc galaxies
In Figure 1, we have plotted the relation between and for idealized bulge+disc systems with , and . The most bulge-dominated of these shows a curious behaviour: the concentration is significantly higher than for pure bulge systems, especially when the disc is face-on666The same effect can be seen in figure 5 of Blanton et al. (2003b), although they do not comment on it. How can the addition of a component that is more extended than the bulge result in a higher measured concentration?

To investigate this, we have plotted in Figure 14 the surface brightness and enclosed flux profiles of both a pure bulge and a face-on bulge+disc system with . In both cases the bulge effective radius . For the bulge+disc system, the disc scale length is . The surface brightness profiles are normalized to the same bulge luminosity, while the enclosed flux profiles are normalized to the Petrosian flux in each case.
Because of the high ratio, the bulge dominates the total luminosity. Therefore, the and flux levels that define and are determined by the bulge. The bulge is also much more concentrated than the disc and completely dominates the flux inside the effective radius , which contains half the bulge flux and therefore determines . However, there is a region of the surface brightness profile that is dominated by the disc. The flux distribution in this region is more extended than it would be in the absence of the disc, and therefore radii enclosing a fixed fraction of the flux increase due to the presence of the extended component. This is precisely the situation for in Figure 14. Therefore, the presence of the disc increases without affecting , resulting in a higher concentration!
The conditions required for this behaviour are
-
1.
the bulge dominates the total luminosity,
-
2.
the bulge dominates the surface brightness profile within , and
-
3.
the disc dominates the surface brightness profile at .
While these may appear to be quite restrictive conditions, they are met for very reasonable sets of parameters. The effect is less pronounced for inclined discs precisely because an inclined disc component appears less extended, and therefore has less of an effect on .
As a result, and are not monotonic functions of , and in particular the galaxies with the largest concentrations are not pure spheroidal galaxies (although they are bulge-dominated).