Abundances of Planetary Nebula NGC 2392††thanks: Based on observations with the Spitzer Space Telescope, which is operated by the Jet Propulsion Laboratory, California Institute of Technology
The spectra of the planetary nebula NGC 2392 is reanalysed using spectral measurements made in the mid-infrared with the Spitzer Space Telescope. The aim is to determine the chemical composition of this object. We also make use of IUE and ground based spectra. Abundances determined from the mid-infrared lines, which are insensitive to electron temperature, are used as the basis for the determination of the composition, which are found to differ somewhat from earlier results. The abundances found, especially the low value of helium and oxygen, indicate that the central star was originally of rather low mass. Abundances of phosphorus, iron, silicon and chlorine have been determined for the first time in this nebula. The variation of electron temperature in this nebula is very clear reaching quite high values close to the center. The temperature of the central star is discussed in the light of the high observed stages of ionization. The nebular information indicates the spectrum of the star deviates considerably from a blackbody.
Key Words.:
ISM: abundances – planetary nebulae: individual: NGC 2392 – Infrared: ISM: lines and bands1 Introduction
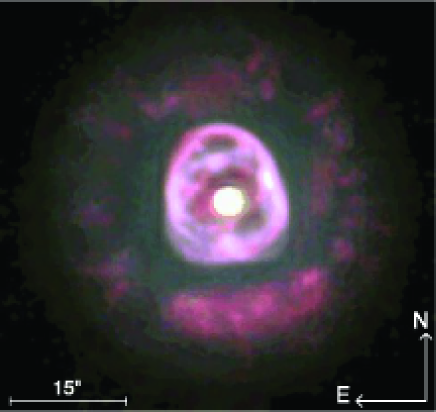
NGC 2392 (PN G197.8+17.3) is a bright planetary nebula with a rather high radial velocity, located in the direction of the galactic anticenter. A photograph of the nebula is shown in Fig. 1. The nebula has a bright inner ellipsoidal, almost round, shell of about 18′′ diameter. This is surrounded by an almost spherical region of considerably lower emission with a diameter of about 40′′. Both the inner and outer regions contain some structure. Analysis of the kinematics of the nebula (O’Dell & Ball, odell (1985)) indicates that the inner region is expanding quite rapidly with respect to the outer region which is also slowly expanding. The nebula is located 17 degrees above the galactic plane and has only a small extinction. Because of its brightness it is considered a nearby nebula: most of the uncertain distance estimates vary between 1 and 2 kpc.
The nebula has a bright central star (V=10.53) which has been studied by several authors. Pauldrach et al. (paul (2004)) have compared the stellar spectrum with a model atmosphere and conclude that the star has an effective temperature Teff=40 000 K. While this is slightly higher than the hydrogen Zanstra temperature of about 36 000 K, it is considerably less than the ionized helium Zanstra temperature which is close to 70 000 K. Pauldrach et al. (paul (2004)) have noted this discrepancy and admit that they are unable to explain the additional He-ionizing photons which are needed to explain the high Tz(HeII). Tinkler & Lamers (tinkler (2002)) prefer assigning a much higher effective temperature to the star based on the high ionized helium Zanstra temperature and the high energy balance temperature: Teff=73 000 K. It is clear that the excitation in the nebula is much higher than can be accounted for by a temperature of Teff=40 000 K. This was already noted by Natta et al. (natta (1980)) who showed that higher temperature ionizing radiation was necessary for all ions found in the nebula: the higher the ionization potential of the ion studied the higher the ionizing radiation temperature must be. Why this result is not found in the analysis of the stellar spectrum is not understood.
The purpose of this paper is to study the element abundances in this nebula with the help of mid-infrared spectra, in the hope that the chemical abundances will shed some light on the evolution of this nebula-central star combination. Abundances have been studied earlier by Barker (barker (1991)) and by Henry et al. (henry (2000)). Both of these groups use optical nebular spectra (taken by themselves) and ultraviolet IUE spectra. Barker (barker (1991)) has measurements taken at five different positions in the nebula. He uses low dispersion IUE measurements taken with the small aperture (3′′ diameter). Henry et al. (henry (2000)) also take spectra at five different positions in the nebula but they use low dispersion IUE measurements taken with the large aperture (10′′x 23′′). No abundance changes as function of the position in the nebula are found by either group. Both groups agree on the abundances of N, O and Ne to within 20%. However their carbon abundances differ by more than a factor of 6 and the helium abundances differ by almost 30%. Henry et al. (henry (2000)) do not discuss the abundance of other elements, while Barker also determines sulfur and argon.
We have measured the spectrum of NGC 2392 in the mid-infrared with the IRS spectrograph of the Spitzer Space Telescope (Werner et al. werner (2004)). The use of the mid-infrared spectrum permits a more accurate determination of the abundances. The reasons for this have been discussed in earlier studies (e.g. see Pottasch & Beintema pott1 (1999); Pottasch et al. pott2 (2000), pott4 (2001); Bernard Salas et al. bernard (2001)), and can be summarized as follows.
The most important advantage is that the infrared lines originate from very low energy levels and thus give an abundance which is not sensitive to the temperature in the nebula, nor to possible temperature fluctuations. Furthermore, when a line originating from a high-lying energy level in the same ion is observed, it is possible to determine an average electron temperature at which the lines in that particular ion are formed. When this average temperature for many ions is determined, it is possible to make a plot of electron temperature against ionization potential, which can be used to determine the average electron temperature (or range of temperatures) for which ions of a particular ionization potential are observed. As will be shown, this is particularly important in NGC 2392 for which a large gradient in electron temperature is found. This has not been taken into account in the earlier abundance studies of this nebula.
Use of the infrared spectra have further advantages. One of them is that the number of observed ions used in the abundance analysis is approximately doubled, which removes the need for using large Ionization Correction Factors (ICFs), thus substantially lowering the uncertainty in the abundance. A further advantage is that the extinction in the infrared is almost negligible, eliminating the need to include sometimes large correction factors. This is not very important in this nebula. The number of elements which can be measured increases when including the infrared. In NGC 2392 phosphorus, iron and silicon can be measured in the mid-infrared. This nebula has not been measured by ISO, because this part of the sky was not available to this satellite.
This paper is structured as follows. First the Spitzer spectrum of NGC 2392 is presented and discussed (in Sect. 2). Then the intrinsic H flux is determined using both the measurements of the infrared hydrogen lines and the radio continuum flux density (Sect. 3). The visible spectrum of the nebula is presented in Sect. 4 together with a new reduction of the ultraviolet (IUE) spectrum. This is followed by a discussion of the nebular electron temperature and density and the chemical composition NGC 2392 (Sect. 4). A comparison of the resultant abundances with those in the literature is given in Sect. 5. In Sect. 6 the central star is discussed especially in relation to the nebular spectrum. In Sect. 7 a general discussion and concluding remarks are given.
2 The Infrared spectrum
2.1 IRS observations of NGC 2392
The observations of NGC 2392 were made using the Infrared Spectrograph (IRS, Houck et al. houck (2004)) on board the Spitzer Space Telescope with AORkeys of 4108544 (on target) and 4108800 (background). The data were processed using the s14.0 version of the pipeline and using a script version of Smart (Higdon et al. higdon (2004)). The reduction started from the droop images which are equivalent to the bcd images and just lack stray-cross removal and flatfield. The tool irsclean was used to remove rogue pixels. The different cycles for a given module were combined to enhance S/N. At this point the background images were subtracted to remove the sky contribution. Then the resultant HR images were extracted using full aperture. The final spectrum is shown in Fig. 2.
The great advantage of the IRS high resolution spectra compared to the ISO SWS spectra is the very high sensitivity of the IRS. Otherwise the two instruments are quite comparable. The IRS high resolution spectra have a spectral resolution of about 600. The IRS high resolution measures in two spectral ranges with two different modules: the short high module (SH) going from 9.9m to 19.6m and the long high module (LH) from 18.7m to 37.2m. The SH has a slit size of 4.7′′x 11.3′′, while the LH is 11.1′′x 22.3′′.
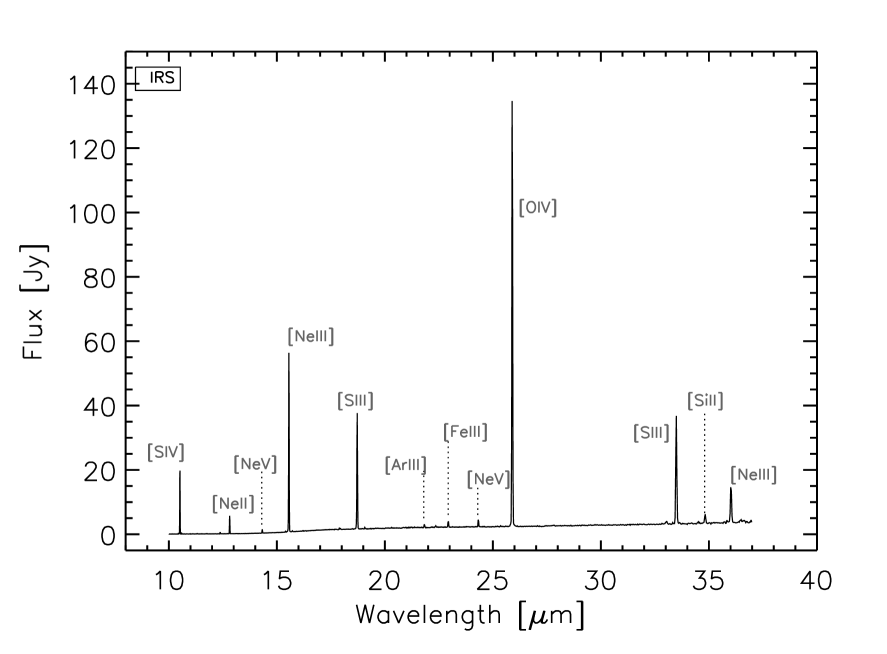
The IRS measurement of NGC 2392 was centered at RA(2000) 07h29m10.77s and Dec(2000) +20∘54′42.5′′. This is almost the same as the value measured by Kerber et al. (kerber (2003)) of RA(2000) 07h29m10.768s and Dec(2000) 28∘54′42.44′′. Thus the IRS measurement was well centered on the nebula and both the LH and SH diaphragms measured essentially the inner, brighter nebula. Since the LH diaphragm is larger, more of the nebula is seen in this diaphragm, therefore a correction must be made to bring the two measurements to the same scale. This was done by making use of the fact that the two spectrographs had a small wavelength region in common at about 19m. To make the continuum emission at this wavelength equal, the SH emission had to be increased by 4.3. This is close to the difference in area between the two slits (4.7). The measured emission line intensities are given in Table 1, after correcting the SH measurements by the factor 4.3 in the column labeled ’intensity’. The fluxes were measured using the Gaussian line-fitting routine and derived for each nod position independently. The uncertainty in the fluxes was assumed to be the largest of either the difference between the flux in the nod positions, or the uncertainty in the fit. The last column gives the ratio of the intensity to H where the H is found from the strongest hydrogen line(s) measured in the IRS spectrum. It has been assumed that the ratio of the sum of the two hydrogen lines at 12.372m to H has a value of 8.80 x 10⁻³, which is the value given by Hummer & Storey (hummer (1987)) for an electron temperature of 15 000 K. No correction for extinction is made since it is very small. This means that the value of H through the LH diaphragm is 2.87x10⁻¹¹ erg cm-2s-1 and the correction for reddening has been included. Note that the three lines with wavelength less than 10m are measured in the low resolution spectrograph.
| Identification | (m) | Intensity† | I/H |
|---|---|---|---|
| [Ar ii] | 6.989 | 18.33.5 | 0.64 |
| H i(6-5) | 7.481 | 47.52.2 | 1.66 |
| [Ar iii] | 8.995 | 2318.8 | 8.05 |
| [S iv] | 10.511 | 95056 | 33.0 |
| H i(9-7) | 11.309 | 8.120.47 | 0.28 |
| [Cl iv] | 11.762 | 4.690.60 | 0.163 |
| H i (7-6+11-8) | 12.374 | 25.31.4 | |
| [Ne ii] | 12.815 | 22010 | 8.63 |
| [Ar v] | 13.096 | 2.6 | |
| [Ne v] | 14.323 | 44.60.86 | 1.56 |
| [Ne iii] | 15.556 | 193030.8 | 67.2 |
| H i 10-8 | 16.219 | 4.22.0 | 0.146: |
| [P iii] | 17.893 | 1620 | 0.56: |
| [Fe ii] | 17.943 | 10.040 | 0.35: |
| [S iii] | 18.718 | 109827 | 38.2 |
| [Cl iv] | 20.319 | 4.910.36 | 0.167 |
| [Ar iii] | 21.827 | 25.61.96 | 0.89 |
| [Fe iii] | 22.934 | 44.71.37 | 1.55 |
| [Ne v] | 24.326 | 44.53.25 | 1.55 |
| [O iv] | 25.895 | 2634119 | 88.4 |
| H i 9-8 | 27.806 | 6.761.69 | 0.236 |
| [Fe iii] | 33.043 | 14.71.31 | 0.511 |
| [S iii] | 33.487 | 53011.5 | 18.4 |
| [Si ii] | 34.825 | 45.41.69 | 1.58 |
| [Ne iii] | 35.941 | 97.7115: | 3.42: |
† Intensities measured in units of 10-14 erg cm-2 s-1. The intensities below 19m have been increased by a factor of 4.3 to bring them on the same scale as the LH intensities measured through a larger diaphragm. The intensities below 10m are measured with the low resolution instrument.
: Indicates an uncertain value.
There are other ways of determining the factor which accounts for the emission missing in the SH diaphragm. The method given above, that of making use of the fact that the continua in the region of wavelength overlap should be equal, is theoretically satisfying. This is because the continuum is due primarily to dust which probably has the same properties throughout the nebula. But to check this any pair of lines can be used as long as they originate from the same ion and two other conditions exist. One is that each of the lines is measured in a different diaphram. The other is that the theoretical value of the ratio of the two lines is only weakly dependent on the electron temperature and density. Five candidate pairs of lines exist. One is the ratio of the [Ne iii] lines at 15.5 and 36.0m. This cannot be used in this case because the 36.0m line is very uncertain. The [Ne v] and [Cl iv] ions both have a pair of lines, one of which is in the SH range and one of which is in the LH range. The predicted line ratio is only slightly dependent on the nebular properties so that they may be used; they are consistent with the value of 4.3. The hydrogen lines are rather weak but they also are consistent with a value of 4.3 with an error of about 20%. It thus appears that the total emission in the SH wavelength band is obtained by increasing the measured intensities by a factor of 4.30.2. This is quite close to the ratio of the areas of the two diaphragms which is 4.6.
3 Extinction
There are several methods for obtaining the extinction: (1) comparison of radio emission with H flux, (2) comparison of observed and theoretical Balmer decrement, (3) dip at 2200Å, (4) photometry of the exciting star. All of these methods are applicable here. First we will discuss the radio emission and how the H flux is obtained.
3.1 The 6 cm radio emission
The 6 cm flux density has been measured by Becker et al. (becker (1991)) and Gregory & Condon (greg (1991)). Becker et al. (becker (1991)) find a value of 242 mJy and Gregory & Condon (greg (1991)) give 246 mJy. The nebula has also been measured at 21 cm by Condon & Kaplan (condon (1998)) who find a value of 280.9 mJy, which implies a 6 cm flux density of 238 mJy if the nebula is optically thin. We will use a value of 242 mJy. Using values of Te and helium abundance determined below together with the equation quoted in Pottasch (potta (1984)) this implies an H flux of 6.83x10⁻¹¹ erg cm-2 s-1, indicating that about 42% of the nebula is being measured in the LH slit.
3.2 Extinction
The extinction determined from the Balmer decrement differs somewhat according to the author. Henry et al. (henry (2000)) give C=0, Aller & Czyzak (aller (1979)) give C=0.15, Barker (barker (1991)) finds C=0.12.
The photometry of the star gives a higher extinction. Using B=10.38 and V=10.53, BV=0.15. The intrinsic value of B-V for a hot star is 0.32 giving a value of 0.17 or C=0.25. The extinction found from the 2200Å dip is 0.08 or C=0.12 (Pottasch et al. pott5 (1978)).
The measured value of the integrated H flux is 4.07x10⁻¹¹ erg cm-2 s-1 (Cahn et al. cahn (1992)). Using the value of H from the radio measurements leads to a value of C=0.225 or =0.154. This is slightly higher than the values found from the Balmer decrement and the 2200Å dip but it agrees with the extinction found from the stellar photometry. We find that the radio/H method is the most accurate determination, so that this value will be used when necessary in this paper. But the extinction is so low that it does not affect any results in this paper.
3.3 The visual spectrum
The visual spectrum has been measured by several authors. The highest resolution spectrum is by Henry et al. (henry (2000)), and reliable spectra have also been reported by Barker (barker (1991)) and Aller & Czyzak (aller (1979)). The measurements of Henry et al. (henry (2000)) and those of Barker (barker (1991)) are made at several different places in the nebula but there do not appear to be important differences between them. The results are shown in Table 2 where Cols. 3, 4 and 5 give the intensities measured by the various authors relative to H=100 for those lines which are of interest. The line intensities have been corrected by the individual authors for extinction. Henry et al.(henry (2000)) felt that no extinction correction was necessary, the other authors using the reddening curve of Seaton (seaton (1979)) find the extinctions which are listed in the previous section. No attempt has been made to use a common extinction correction because all give a correct Balmer decrement. In the last column average values are given; more weight is given to the measurements of the first two authors. All authors estimate that the strongest lines have a 10% error, the intermediate strength lines (about 5% of H) have about 20% error and the weakest lines have about 30% error. The average intensities have about the same error.
| Ion | Intensities† | Average | |||
|---|---|---|---|---|---|
| (Å) | (1) | (2) | (3) | Intens. | |
| 3727∗ | [O ii] | 107 | 120 | 108 | 110 |
| 3869 | [Ne iii] | 100 | 130 | 90 | 105 |
| 4101 | H & 24.0 | 26.5 | 25.2 | 25.2 | |
| 4267 | C ii | 0.3: | 0.3: | ||
| 4340 | H & 46.0 | 48.0 | 48.0 | 47.2 | |
| 4363 | [O iii] | 14 | 25 | 19.5 | 19.5 |
| 4686 | He ii | 38 | 38 | 35 | 37 |
| 4740 | [Ar iv] | 2.2 | 2.5 | 2.3 | |
| 4861 | H & 100 | 100 | 100 | 100 | |
| 5007 | [O iii] | 950 | 1200 | 1260 | 1150 |
| 5517 | [Cl iii] | 0.6 | 0.72 | 0.65 | 0.65 |
| 5538 | [Cl iii] | 0.68 | 0.50 | 0.59 | |
| 5755 | [N ii] | 2.0 | 1.6 | 1.51 | 1.6 |
| 5876 | He i | 6.8 | 7.8 | 7.45 | 7.4 |
| 6312 | [S iii] | 2.5 | 3.6 | 3.3 | 3.2 |
| 6563 | H & 275 | 295 | 283 | 285 | |
| 6584 | [N ii] | 95 | 95 | 85.5 | 92 |
| 6717 | [S ii] | 8.0 | 6.7 | 4.8 | 6.7 |
| 6731 | [S ii] | 10.0 | 7.9 | 7.8 | 8.6 |
| 7005 | [Ar v] | 0.15 | 0.15 | ||
| 7135 | [Ar iii] | 14 | 14.3 | 12.3 | 14 |
| 7237 | [Ar iv] | 0.19: | 0.19: | ||
| 8045 | [Cl iv] | 0.4 | 0.47 | 0.45 | |
| 9532 | [S iii] | 91 | 91 | ||
3.4 The IUE ultraviolet spectrum
There are 80 low resolution IUE observations of this nebula as well as six high resolution observations. Most were taken with the large aperature (10′′x 23′′) with varying exposure times, but quite a few were taken with a small aperature (3′′ diameter). The small aperature measurements were used by Barker (barker (1991)), who did not find any important abundance variations in the nebula. We find the small aperature measurements are too noisy and we do not use them. The large aperture measurements do not cover the entire nebula. Most of the measurements which exclude the central star cover about 10% to 15% of the nebula. We have used three of the best observations made with long exposure times. These are SWP05231 and SWP25236 for the short wavelength region and LWR04515 for the longwavelength region. We have checked that the strongest lines are not saturated by measuring these same lines on spectra with shorter exposure times. They are shown in Table 3. The uncertainties are about the same as given by Henry et al. (henry (2000)): about 10% for the strongest lines and about 25% for the weaker lines.
The extinction correction was made by assuming a theoretical ratio for the He ii line ratio 1640/4686 Å at T=12 500 K and an Ne of 103 cm-3. The ratio of 1640 to H can then be found using the 4686/H ratio in Table 2 which leads to a value of the 1640 Å line as given in column (2) of Table 3. A further correction for extinction relative to 1640Å is then made using the reddening curve of Fluks et al.(fluks (1994)) but because of the small extinction this is never more than 20%, which indicates the uncertainties of the UV intensities above the errors of measurement given above. The results are shown in the last two columns of Table 3.
| Ion | Intensities | |||
|---|---|---|---|---|
| (Å) | (1) | (2) | (I/H) | |
| 1335 | C ii | 10.2 | 11.0 | 16.0 |
| 1400 | O iv | 36.3 | 36.6 | 53.4 |
| 1485 | N iv] | 24.8 | 24.2 | 35.2 |
| 1548 | C iv | 77.7 | 75.5 | 110 |
| 1640 | He ii | 185 | 176 | 256 |
| 1663 | O iii] | 53.8 | 34.6 | 50.4 |
| 1750 | N iii] | 49.4 | 45.4 | 66.1 |
| 1881 | Si iii] | 14.7 | 14.0 | 20.4 |
| 1890 | Si iii] | 12.0 | 11.4 | 16.6 |
| 1909 | C iii] | 156 | 148 | 216 |
| 2325 | C ii] | 36.4 | 31.8 | 46.4 |
| 2423 | [Ne iv] | 187 | 145 | 211 |
| 2472 | [O ii] | 20 | 14.7 | 21.5 |
| 2512 | He ii | 24.2 | 17.3 | 25.2 |
(1)Measured intensity from low resolution spectra SWP05231 and LWR04515 in
units of 10-13 erg cm-2 s-1.
(2)Intensity corrected for diaphragm size and extinction in units of
10-12 erg cm-2 s-1.
I/H is normalized to H=100.
4 Chemical composition of the nebulae
The method of analysis is the same as used in the papers cited in the introduction. First the electron density and temperature as function of the ionization potential are determined. Then the ionic abundances are determined, using density and temperature appropriate for the ion under consideration. Then the element abundances are found for those elements in which a sufficient number of ionic abundances have been derived.
4.1 Electron density
The ions used to determine are listed in the first column of Table 4. The ionization potential required to reach this stage of ionization, and the wavelengths of the lines used, are given in Cols. 2 and 3 of the table. Note that the wavelength units are Å when 4 ciphers are given and microns when 3 ciphers are shown. The observed ratio of the lines is given in the fourth column; the corresponding is given in the fifth column. The temperature used is discussed in the following section, but is unimportant since these line ratios are essentially determined by the density. No density is given from the Ne iii lines because of the uncertainty of the 36m line intensity. The density from the C iii] lines is uncertain because it is possible the stronger of the two lines may be saturated.
There is no indication that the electron density varies with ionization potential in a systematic way. The electron density appears to be about 1200 cm-3. The error is about 20%. It is interesting to compare this value of the density with the rms density found from the H line. This depends on the distance of the nebula which isn’t accurately known, and on the angular size of the nebula. For this calculation we shall use a distance of 1.5 kpc and a diameter of 18′′ for the inner region. This gives an rms density of 2000 cm-3 for the inner region. The comparison is difficult because the measurement may include some H flux from the outer region which will lower the density. This uncertainty is illustrated by two different O ii measurements. Kingsburgh & Barlow (kings (1994)) measured a 3726/3729Å=1.35 at the center of the nebula, corresponding to a density of 1650 cm-3, while O’Dell & Castaneda (odellc (1984)) measuring at the (brighter) rim of the nebula, find a value of 1.78 for the ratio, corresponding to a density of 3000 cm-3. We will use a density of 1500 cm-3 in further discussion of the abundances, but any value between 1000 cm-3 and 3000 cm-3 will give the same values of abundance.
| Ion | Ioniz. | Lines | Observed | Ne |
|---|---|---|---|---|
| Pot.(eV) | Used | Ratio | (cm-3) | |
| [S ii] | 10.4 | 6731/6716 | 1.28 | 1600 |
| [O ii] | 13.6 | 3626/3729 | 1.35 | 1650 |
| [S iii] | 23.3 | 33.5/18.7 | 0.48 | 2600 |
| [Cl iii] | 23.8 | 5538/5518 | 0.86 | 1200 |
| C iii] | 24.4 | 1906/1909 | 1.46 | 1000: |
| [Ne iv] | 63.5 | 2425/2422 | 1.4 | 1000: |
| [Ne v] | 97.1 | 24.3/14.3 | 0.99 | 1000: |
: Indicates uncertain values.
4.2 Electron temperature
A number of ions have lines originating from energy levels far enough apart that their ratio is sensitive to the electron temperature. These are listed in Table 5 which is arranged similarly to the previous table. The values are also shown in Fig. 3 where it can be seen that the electron temperature has a strong gradient as a function of ionization potential. Other PNe have also shown a gradient of electron temperature but it is especially strong in this nebula, going from a value of about 10 000 K for the lowest ionization potentials (presumably formed in the outer regions of the nebula) through a value of 14 000 to 15 000 K at an ionization potential of about 35 eV, to a value well over 20 000 K at ionization potentials above 50 eV. For these latter ions it is impossible to specify the temperature accurately, so that the abundance of these ions can only be determined from the infrared lines since the population of the lower levels is only slightly dependent on the temperature.
| Ion | Ioniz. | Lines | Observed | |
|---|---|---|---|---|
| Pot.(eV) | Used | Ratio | (K) | |
| [N ii] | 14.5 | 5755/6584 | 0.017 | 10 000 |
| [S iii] | 23.3 | 6312/18.7 | 0.0.084 | 12 000 |
| [Ar iii] | 27.6 | 7136/21.8 | 15.8 | 10 000 |
| [O iii] | 35.1 | 4363/5007 | 0.0165 | 14 700 |
| [O iii] | 35.1 | 1663/5007 | 0.0496 | 15 200 |
| [Ne iii] | 41.0 | 3869/15.5 | 1.56 | 13 500 |
| [O iv] | 54.9 | 1400/25.9 | 0.44 | 22 000: |
| [Ne v] | 97.1 | 3425/24.3 | 2.2: | 25 000 |
: Indicates uncertain value.
When the wavelength has 4 ciphers it has the
units of Angstrom and 3 ciphers is micron.

4.3 Ionic and element abundances
The ionic abundances have been determined using the following equation:
| (1) |
where / is the measured intensity of the ionic line compared to H, is the density of ionized hydrogen, is the wavelength of the line, is the wavelength of H, is the effective recombination coefficient for H, is the Einstein spontaneous transition rate for the line, and / is the ratio of the population of the level from which the line originates to the total population of the ion. This ratio has been determined using a five level atom. The atomic data used is given in the paper of Pottasch & Beintema (pott1 (1999). The use of a 5 level atom in the case of iron is justified because collisional rates to higher levels followed by cascade through the lower levels are quite small in comparison to direct collisions to the lower levels.
The results are given in Table 6, where the first column lists the ion concerned, the second column the line used for the abundance determination, and the third column gives the intensity of the line used relative to H=100. The fourth column gives the value of the electron temperature used for the abundance determination of the ion, which is shown in the fifth column. This temperature is determined by plotting the temperatures given in Table 5 as function of ionization potential, drawing a line through these points as shown in Fig. 3, and then reading the temperature of the ion under consideration from its ionization potential. The fifth column gives the ionic abundance assuming the ion is formed at this temperature, while the sixth column gives the Ionization Correction Factor (ICF), which has been determined empirically. Notice that the ICF is unity (or almost unity) for all elements listed in the table except for Fe, Si, Cl and P.
The error of measurement of the IRS intensities as can be seen in Table 1 is usually small, often not more than 5-7%. In the few cases when the error is large this has either been indicated with a ’:’ or by not using the line. The correction for adjusting the SH to LH intensity scales and the diaphragm size is probably small, about 10%. This includes the assumption that the unmeasured parts of the nebula have the same spectrum as the measured parts. This has been checked in the optical region by Barker (barker (1991)) and can be seen to be a reasonable approximation in the ultraviolet region by comparing the IUE spectra made in different parts of the nebula. The uncertainty of the collisional strengths introduces an error of 10-15% so that the total error for the ions of neon, sulfur and argon determined with the IRS measurements is less than 20%. This will also be true of the abundances of these elements because the ICF for these elements is close to unity. The error for the nitrogen and oxygen abundances is somewhat higher because the visual and ultraviolet measurements are less certain. In addition the temperature is more important for these ions and the total errors may be twice as large. The element abundances are given in the last column, The carbon recombination line abundance is given at the end of the table. These abundances will be discussed in the next sections.
The helium abundance has been derived using the theoretical work of Benjamin et al. (benjamin (1999)). For recombination of singly ionized helium, most weight is given to the 5875Å line, because the theoretical determination of this line is the most reliable.
| Ion | I/H | Te | / | ICF | / | |
|---|---|---|---|---|---|---|
| He+ | 5875 | 7.4 | 12 000 | 0.048 | ||
| He++ | 4686 | 37 | 14 000 | 0.032 | 1.0 | 0.080 |
| C+ | 2324 | 41.7 | 10 000 | 7.5(-5) | ||
| C++ | 1909 | 240 | 11 500 | 2.3(-4) | ||
| C+3 | 1548 | 115 | 17 000 | 1.7(-5) | 1.0 | 3.3(-4) |
| N+ | 6584 | 92 | 10 000 | 1.8(-5) | ||
| N++ | 1750 | 62.3 | 12 500 | 1.5(-4) | ||
| N+3 | 1485 | 30 | 17 000 | 1.4(-5) | 1.0 | 1.85(-4) |
| O+ | 3727 | 110 | 10 000 | 5.0(-5) | ||
| O++ | 5007 | 1150 | 14 000 | 1.9(-4) | ||
| O++ | 1663 | 57 | 14 000 | 2.3(-4) | ||
| O+3 | 25.8 | 88.4 | 19 500 | 2.3(-5) | 1.0 | 2.9(-4) |
| Ne+ | 12.8 | 8.63 | 11 000 | 1.2(-5) | ||
| Ne++ | 15.5 | 67.2 | 15 000 | 4.7(-5) | ||
| Ne++ | 3869 | 105 | 15 000 | 3.5(-5) | ||
| Ne+3 | 2423 | 211 | 21 000 | 2.4(-5) | ||
| Ne+4 | 24.3 | 1.55 | 27 000 | 1.9(-7) | 1.0 | 8.5(-4) |
| S+ | 6731 | 8.6 | 9 000 | 4.9(-7) | ||
| S++ | 18.7 | 38.2 | 11 300 | 3.5(-6) | ||
| S++ | 6312 | 3.2 | 11 300 | 5.2(-6) | ||
| S+3 | 10.5 | 33.0 | 14 000 | 0.87(-6) | 1.0 | 5.0(-6) |
| Ar++ | 21.8 | 0.89 | 12 000 | 1.3(-6) | ||
| Ar++ | 7135 | 14.0 | 12 000 | 1.0(-6) | ||
| Ar+3 | 4740 | 2.3 | 15 300 | 2.9(-7) | ||
| Ar+3 | 7237 | 0.19 | 15 300 | 8.1(-7): | ||
| Ar+4 | 7005 | 0.15 | 20 500 | 1.4(-8) | 1.2 | 2.2(-6) |
| Cl++ | 5538 | 0.59 | 11 400 | 7.2(-8) | ||
| Cl+3 | 20.3 | 0.167 | 14 800 | 0.88(-8) | ||
| Cl+3 | 8045 | 0.45 | 14 800 | 2.7(-8) | 1.3 | 1.3(-7) |
| Fe++ | 22.9 | 1.55 | 10 500 | 4.7(-7) | : | |
| Fe++ | 33.0 | 0.51 | 10 500 | 5.8 (-7) | 1.6 | 8.0(-7) |
| Si+ | 34.8 | 1.58 | 9 000 | 3.8(-7) | ||
| Si++ | 1888 | 37.0 | 10 400 | 1.4(-5) | 1.3 | 1.9(-5) |
| P++ | 17.9 | 0.56 | 10 500 | 3.4(-8): | 1.9: | 6.5(-8): |
| C++ | 4267 | 0.3 | 11 500 | 3.4(-4): |
Intensities given with respect to H=100.
: Indicates uncertain value.
5 Comparison with other abundance determinations
Table 7 shows a comparison of our abundances with the most important determinations in the past 20 years. Only about half of the elements have been reported before. Good agreement is found for oxygen; this is because the same electron temperature is used for the most important oxygen ion. For the other elements the agreement is less good. We find a rather higher carbon abundance, much higher than found by Barker (barker (1991)) and slightly higher than found by Henry et al. (henry (2000)). A C/O ratio greater than unity is found but the error is large enough that it could be slightly less than unity. Nitrogen is somewhat higher than found by the other authors and clearly a factor of two higher than the solar abundance. Most of the other elements are consistent with a galactocentric abundance gradient (-0.085 dex/kpc) as described for example by Pottasch & Bernard-Salas (pbs (2006)). Iron is depleted by more than a factor of 30 with respect to the solar abundance, as it is in most of the nebulae already studied. Phosphorus seems rather strongly depleted as well, but it is uncertain because of the large measurement error. The comparison made in the table with the solar abundance is taken from Asplund et al. (asplund (2005)). Note that for sulfur and chlorine more weight has been given to the abundance determination in meteorites since this determination is more accurate than for the Sun itself. Neon and argon abundances are taken from the references given in Pottasch and Bernard-Salas (pbs (2006)).
| Elem. | Present | H† | B† | Solar† |
|---|---|---|---|---|
| He | 0.080 | 0.076 | 0.097 | 0.098 |
| C(-4) | 3.3 | 2.2 | 0.42 | 2.5 |
| N(-4) | 1.85 | 1.1 | 1.1 | 0.84 |
| O(-4) | 2.9 | 2.8 | 3.4 | 4.6 |
| Ne(-5) | 8.5 | 6.4 | 7.6 | 12 |
| S(-6) | 5.0 | 4.3 | 14 | |
| Ar(-6) | 2.2 | 1.4 | 4.2 | |
| Cl(-7) | 1.3 | 3.5 | ||
| Si(-6) | 19 | 32 | ||
| Fe(-7) | 8.0 | 280 | ||
| P(-8) | 6.5 | 23 |
The main differences with earlier work come about in the interpretation of the spectrum. First of all because the gradient of electron temperature has been included here. Considering the fact that a very large temperature gradient is present the abundances are not much affected by it. This is probably because the important ions contributing to the total abundances are formed at temperatures not so far from the temperature at which the O++ ion is formed. An exception to this is the C++ which is formed at a lower temperature, which explains why Barker (barker (1991)) has obtained a much smaller carbon abundance.
A further cause of error is the ICF, can give important errors for Si, Fe and especially P for which only one ion has been observed. For these elements the ICF has been determined by comparison with the results of model calculations made for other PNe which have similar excitation. This makes the results for these elements uncertain, but since the ions observed are important contributers to the total abundance, the error even for these elements is probably less than a factor of two.
The abundances found agree with those expected from the gradient of PNe abundances found by Pottasch & Bernard-Salas (pbs (2006)).
5.1 Recombination line abundances of carbon
The C++ population can be obtained from the recombination line 4267Å as well as from the collisionally excited line at 1909Å. The advantage of the recombination line is that it is not sensitive to the electron temperature, and is in the visual spectrum as well. It has the disadvantage that it is quite faint and thus difficult to measure accurately. It has been used for at least 30 years, and has been found to sometimes give higher C++ populations than the collisional line. The reason for this is not clear (e.g. see the discussion of Liu et al. (liu1 (2000))). We have redetermined the C++ abundance using using the recombination rates for this line and the result is shown in the last line of Table 6. This is essentially the same value as that determined from the 1909Å collisional line, since the error of measurement of the weak 4267Å line is quite large. It is therefore true that for carbon both determinations give a similar result. This is in contrast to M 1-42 where the C++ found from the recombination line is an order of magnitude higher than that found from the collisional line (Pottasch et al. pot07 (2006)). Since both nebulae have almost the same electron density it may be concluded that the electron density does not contribute to this effect.
6 Discussion of stellar evolution
The rather low abundances of helium, oxygen, neon and sulfur are consistent with the position of the nebula in the galaxy which is about 10 kpc from the galactic center, assuming that the sun is 8 kpc from the galactis center. These elements fit very well on the abundances as a function of position in the galaxy as given by Pottasch & Bernard-Salas (pbs (2006)). Especially the low helium abundance indicates that no helium has been produced which implies that the second dredge-up and hot-bottom burning have not taken place. The carbon abundance is somewhat higher than oxygen suggesting that the third dredge-up has begun. Following the models of Karakas (karakas (2003)) this will occur at a stellar mass of about 1.7M⊙. This model has increased its nitrogen abundance by about a factor of five in the first dredge-up so that it is reasonable that the actual model is to be sought in this direction.
7 The central star
7.1 Stellar temperature
As discussed in the introduction, the spectrum of the central star has been studied by several authors. Pauldrach et al. (paul (2004)) have fitted model atmospheres to the measured ultraviolet stellar spectrum and Kudritzki et al. (kud (1997)) have studied the optical spectrum. Pauldrach et al.(paul (2004)) have determined the effective stellar temperature from the FeIV/FeV ionization balance to be 40 000 K while Kudritzki et al. (kud (1997)) using the ionization equilibrium of HeI and HeII obtain a similar value of 45 000 K.
The stellar temperature can also be determined from the nebular spectrum. Enough information is available to compute both the Zanstra temperature and the Energy Balance temperature of the central star. The Zanstra temperature requires the knowledge of the stellar apparent magnitude, the extinction and the H flux. The last two quantities have already been given in Sect. 3. The apparent magnitude is listed by Acker et al. (acker (1992)) as V10.53. Assuming that the star radiates as a blackbody the hydrogen Zanstra temperature (H)37 000 K and the ionized helium Zanstra temperature is 78 000 K. The Energy Balance temperature requires the knowledge of the ratio of the forbidden-line intensities to H. This value is found by summing the intensities given above, and is about 28 to 30 after making a correction for unmeasured lines using the table of Preite-Martinez & Pottasch (pmp (1983)). This could be slightly higher but not lower. To convert this value to a stellar temperature, the formulation of Preite-Martinez & Pottasch (pmp (1983)) is used, assuming blackbody radiation from the central star. The value of Case II (the nebula is optically thin for radiation which will ionize hydrogen but optically thick for ionized helium radiation) for the energy balance temperature () is 80 000 K. If a model atmosphere had been used instead of a blackbody, the energy balance temperature could be lower. The low value of the hydrogen Zanstra temperature ((H)) may be due to the nebula being optically thin to radiation ionizing hydrogen. An average stellar temperature of about 75,000 to 80 000 K is a reasonable first approximation. This is also the conclusion of Tinkler & Lamers (tinkler (2002)) who estimate a central star temperature of 74 000 K.
This strange behavior of the central star has been known for many years. Heap (heap (1977)) estimated the stellar spectrum at spectral class O6 giving the star a much lower temperature than the HeII Zanstra temperature. This was confirmed by Pottasch et al. (pott5 (1978)) who pointed out that the stellar continuum between 1500 Å and 5500 Å has a spectral distribution more consistent with a blackbody at 40,000 K than one at 70,000 K. But the measured nebular spectrum showing ions of high ionization potential such as O iv and Ne v indicates that there is much more far ultraviolet radiation than is consistent with a blackbody at 40,000 K, a conclusion already reached by Natta et al. (natta (1980)).
Heap (heap (1977)) suggested that there is a second star of a higher temperature which is the source of the nebular ionization. Ciardullo et al. (ciar (1999)) using the HST wide field camera have found a faint companion at a separation of 2.65′′ in the I band but it was invisible in the V band. Its properties are as yet unknown. It is also unknown if it is physically associated with the nebula. It is therefore possible that the bright star at the center of NGC 2392 is not the actual exciting star of the nebula. A determination of the radius and luminosity of such a star may be derived in the following Pottasch & Acker (pa (1989)). The luminosity of a blackbody of temperature T=80 000 K embedded in a nebula is 105 times the luminosity of the H flux emitted by the nebula. The luminosity of the H flux emitted from NGC 2392, if placed at a distance of 1500 pc is 4.7L⊙. This leads to a total luminosity of the star L=493L⊙. The star must then have a radius of R=0.116R⊙. Such a star would have an unreddened magnitude m(V)= 14.5. The star found by Ciardullo et al. (ciar (1999)) was fainter than m(V)=17.3 so that this could not be the exciting star. If such an exciting star exists it must be much closer to the bright star which would make it impossible to observe with the current facilities.
8 Conclusions
The nebular abundances of eleven elements have been determined. It has been shown that those elements which have not been created in stellar evolution (O, Ne, S, Ar, Cl and possibly Si) have abundances of about a factor two lower than the solar abundance. This is in line with the expectation of a gradient in the stellar abundances as a function of distance from the galactic center. The helium abundance is lower than solar; this indicates that no helium has been formed during the evolution of the central star. Carbon has apparently been formed in a third dredge-up as it is more abundant than oxygen. Nitrogen has also been formed, probably in the first dredge-up. The abundances are consistent with the central star having evolved from an object having about 1.7M⊙. The low iron abundance is also found in almost all PNe studied and seems to be caused by its being tied up in dust.
The electron temperature is found to vary strongly with the ionization potential of the ion used for its determination. This indicates a strong gradient in the nebula, higher than in any PNe yet studied. The reason for this high gradient is not clear. It could be related to the fact that diffuse X-ray emission has been detected within its inner shell (Guerrero et al. guer (2005)), which in turn may be caused by the existence of the exceptionally large expansion velocity of the inner shell.
Finally, the presence of high stages of ionization is confirmed. Both O iv and Ne v are clearly present. This seems to indicate that the stellar temperature is considerably higher that the value of 40,000 K found from a study of the central star. The suggestion that an additional star is present is discussed, but no solution to this problem can be given.
9 Acknowledgement
This work is based on observations made with the Spitzer Space Telescope, which is operated by the Jet Propulsion Laboratory, California Institute of Technology under NASA contract 1407. Support for this work was provided by NASA through Contract Number 1257184 issued by JPL/Caltech.
References
- (1) Acker, A., Marcout, J., Ochsenbein, F. et al. 1992, Strasbourg-ESO catalogue
- (2) Aller, L.H., & Czyzak, S.J. 1979, Ap&SS 62, 397
- (3) Asplund, M., Grevesse, N., & Sauval, A.J. 2005, ASP Conf. Ser. (Bash & Barnes eds.)
- (4) Barker, T. 1991, ApJ 371, 217
- (5) Becker, R.H., White, R.L., & Edwards, A.L. 1991, ApJS 75, 1
- (6) Benjamin, R.A., Skillman, E.D., & Smits, D.P. 1999, ApJ 514, 307
- (7) Bernard Salas, J., Pottasch, S.R., Beintema, D.A., & Wesselius, P.R. 2001, A&A 367, 949
- (8) Cahn, J.H., Kaler, J.B., & Stanghellini, L. 1992, A&AS 94, 399
- (9) Ciardullo, R., Bond, H.E., Sipior, M.S. et al. 1999, AJ 118, 488
- (10) Condon, J.J., & Kaplan, D.L. 1998, ApJS 117, 361
- (11) Davey, A.R., Storey, P.J., & Kisielius, R. 2000, A&AS 142, 85
- (12) Fluks, M.A., Plez, B., de Winter, D., et al. 1994, A&AS 105, 311
- (13) Gregory, P.C., & Condon, J.J. 1991, ApJS 75, 1011
- (14) Guerrero, M.A., Chu, Y.-H., Gruendl, R.A., et al. 2005, A&A 430, L69
- (15) Heap, S.R., 1977, ApJ 215, 864
- (16) Henry, R.B.C., Kwitter, K.B., & Bates, J.A. 2000, ApJ 531, 928
- (17) Higdon, S.J.U., Devost, D., Higdon, J.L., et al. 2004, PASP 116, 975
- (18) Houck, J.R., Appelton, P.N., Armus, L., et al. 2004, ApJS 154, 18
- (19) Hummer, D.G., & Storey, P.J. 1987, MNRAS 224, 801
- (20) Karakas, A.I. 2003, Thesis, Monash Univ. Melbourne
- (21) Kerber, F., Mignani, R.P., Guglielmetti, F. et al. 2003, A&A 408, 1029
- (22) Kingsburgh, R.L., & Barlow, M.J. 1994, MNRAS 271, 257
- (23) Kudritzki, R.-P., Mendez, R.H., Puls, J., & McCarthy, J.K. 1997, IAU Symp.180, 64
- (24) Liu, X.-W., Storey, P.J., Barlow, M.J. et al. 2000, MNRAS 312, 583
- (25) Natta, A., Pottasch, S.R., & Preite-Martinez, A. 1980, A&A 84, 284
- (26) O’Dell, C.R., & Ball, M.E. 1985, ApJ 289, 526
- (27) O’Dell, C.R., & Castaneda, H.O. 1984, ApJ 283, 158
- (28) Pauldrach, A.W.A., Hoffmann, T.L., & Mendez, R.H. 2004, A&A 419, 1111
- (29) Pottasch, S.R. 1984, Planetary Nebulae, Reidel Publ. Co. (Dordrecht)
- (30) Pottasch, S.R., & Acker, A. 1989 A&A, 221, 123
- (31) Pottasch, S.R., Wesselius, P.R., Wu, C.C., et al. 1978, A&A 62, 95
- (32) Pottasch, S.R., & Beintema, D.A. 1999, A&A 347, 974
- (33) Pottasch, S.R., Beintema, D.A., & Feibelman, W.A. 2000, A&A 363, 767
- (34) Pottasch, S.R., Beintema, D.A., Bernard Salas, J., & Feibelman, W.A. 2001, A&A 380, 684
- (35) Pottasch, S.R., & Bernard-Salas, J. 2006, A&A, 457, 189
- (36) Pottasch, S.R., Bernard-Salas, J., Roellig, T.L. 2006, A&A, 471, 865
- (37) Preite-Martinez, A., & Pottasch, S.R. 1983 A&A, 126, 31
- (38) Seaton, M.J. 1979, MNRAS 187, 73
- (39) Tinkler, C.M., & Lamers, H.J.G.L.M. 2002, A&A 384, 987
- (40) Werner, M., Roellig, T.L., Low, F.J., et al. 2004, ApJS 154, 1