Clarifying the nature of the brightest submillimetre sources: interferometric imaging of LH850.02
Abstract
We present high-resolution interferometric imaging of LH 850.02, the brightest 850- and 1200- submillimetre (submm) galaxy in the Lockman Hole. Our observations were made at 890 with the Submillimetre Array (SMA). Our high-resolution submm imaging detects LH 850.02 at 6 as a single compact (size 1 arcsec or 8 kpc) point source and yields its absolute position to 0.2-arcsec accuracy. LH 850.02 has two alternative radio counterparts within the SCUBA beam (LH850.02N & S), both of which are statistically very unlikely to be so close to the SCUBA source position by chance. However, the precise astrometry from the SMA shows that the submm emission arises entirely from LH850.02N, and is not associated with LH850.02S (by far the brighter of the two alternative identifications at 24– ). Fits to the optical-infrared multi-colour photometry of LH850.02N & S indicate that both lie at , and are therefore likely to be physically associated. At these redshifts, the 24–to–submm flux density ratios suggest that LH 850.02N has an Arp 220-type starburst-dominated far-IR SED, while LH 850.02S is more similar to Mrk 231, with less dust-enshrouded star-formation activity, but a significant contribution at 24– (rest-frame ) from an active nucleus. This complex mix of star–formation and AGN activity in multi–component sources may be common in the high redshift ultraluminous galaxy population, and highlights the need for precise astrometry from high resolution interferometric imaging for a more complete understanding.
keywords:
galaxies: starburst – galaxies: formation – galaxies: high-redshift – cosmology: observations – submillimetre1 Introduction


It has been well established that up to half of the far-infrared (far-IR) extragalactic background is produced by dusty starbursts and active galactic nuclei (Hauser et al., 1998; Dwek et al., 1998; Fixsen et al., 1998; Pei et al., 1999). A significant fraction of this background was resolved at 850 into discrete point sources (Smail et al., 1997; Hughes et al., 1998; Barger et al., 1998) by the Submm Common-User Bolometric Array (SCUBA: Holland et al., 1999) on the 15-m James Clerk Maxwell Telescope (JCMT). These so-called submm galaxies (SMGs) are thought to be high-redshift ultraluminous and hyperluminous IR galaxies (see Chapman et al., 2005) that represent massive systems in the process of formation (Scott et al., 2002; Blain et al., 2004), and may dominate cosmic star formation for nearly the first half of the lifetime of the Universe (; Blain et al., 1999; Blain et al., 2002).
Since their discovery a decade ago, a series of surveys using SCUBA at 850 (Barger et al., 1999; Eales et al., 1999, 2000; Chapman et al., 2002; Cowie et al., 2002; Scott et al., 2002; Borys et al., 2002; Webb et al., 2003; Borys et al., 2003; Serjeant et al., 2003; Wang et al., 2004; Knudsen et al., 2006; Coppin et al., 2006; Knudsen et al., 2008) and mm instruments at longer wavelengths (Greve et al., 2004; Dannerbauer et al., 2004; Laurent et al., 2005; Scott et al., 2006; Bertoldi et al., 2007; Scott et al., 2008) have amassed catalogues of hundreds of SMGs. Unfortunately, the detailed study of these objects has been hindered somewhat by the poor angular resolution (11–18 arcsec) of current submm/mm telescopes. This problem was first addressed via deep radio continuum surveys, which exploited the radio–FIR correlation (see Condon, 1992, for a review) in combination with statistical arguments (e.g., Ivison et al., 2002, 2007) to associate 1.4-GHz sources with the submm emission. Radio counterparts allowed SMGs to be localised with sub-arcsec precision and hence allowed a more detailed study of their properties. Optical spectroscopy of these radio-identified samples confirmed that SMGs lie preferentially at high redshift (median ; Chapman et al., 2005) and enabled CO spectroscopy which revealed them to be compact, massive, gas-rich, possibly merging systems (e.g., Neri et al., 2003; Sheth et al., 2004; Kneib et al., 2005; Greve et al., 2005; Tacconi et al., 2006).
Despite the undoubted success of deep radio imaging of SMGs, there is still a clear need for high-resolution submillimetre/millimetre observations of at least a subset of the SMGs found in current, complete samples. Specifically, two classes of object require such observations to locate the source of the submillimetre emission with the required astronomical precision for optical/infrared follow-up.
First, because of the rapid dimming of the radio continuum with redshift (, , where ; Condon, 1992), even the deepest existing radio imaging is relatively insensitive to SMGs at ; as a result, typically only around two thirds of SMGs have been detected at radio wavelengths (Ivison et al., 2002). Other techniques (Ashby et al., 2006; Pope et al., 2006) have been suggested, which make use of data from the IR Array Camera (IRAC: Fazio et al., 2004), in combination with 24- observations using the Multiband Imaging Photometer (MIPS: Rieke et al., 2004), on board the Spitzer Space Telescope to select counterparts. However, they too may have hidden biases which are difficult to quantify, and the only unambiguous way to select the correct optical counterparts for these radio-unidentified SMGs is via time-intensive submm/mm high-resolution interferometric imaging. Interferometric observations at mm (Downes et al., 1999; Frayer et al., 2000; Dannerbauer et al., 2002; Genzel et al., 2003; Greve et al., 2005; Tacconi et al., 2006; Dannerbauer et al., 2008) and submm (Iono et al., 2006; Wang et al., 2007, see also Iono et al. 2008, in prep.) wavelengths have successfully detected a growing catalogue of SMGs (in the process also confirming the reliability of the radio–submm association where a unambiguous radio counterpart has already been discovered). Most recently, Younger et al. (2007) followed up a flux-limited sample of seven mm-selected SMGs detected by the AzTEC camera (Wilson et al., 2008) at the JCMT – including five without reliable radio identifications – at 890 with the Submillimeter Array (SMA: Ho et al., 2004), the counterparts of which suggested a population of very luminous SMGs at higher redshift than radio-identified samples (see also Yun et al. 2008, in prep.). That this bright (median 890- flux density 12.0 mJy), AzTEC-selected sample contains a significant high-redshift tail of SMGs supports earlier evidence that the brightest SMGs may be the most distant (e.g. Figure 9 of Ivison et al., 2002; Dunlop, 2001).
Second, within the radio-identified sub-samples of SMGs there remains some confusion. Specifically, there exists a statistically significant fraction of SMGs which possess more than one statistically robust radio counterpart (; Ivison et al., 2007). Monte–carlo simulations suggest that these associations are observed significantly more frequently than would be expected from chance associations. The nature of these multiply-identified SMGs remains somewhat uncertain, although the steepness of the SMG number counts suggests that the bright submillimetre sources are only rarely expected to arise from the blending/confusion of more moderate luminosity subcomponents. Interferometric imaging of the rest–frame far–IR continuum offers the best way to investigate the true nature of these interesting systems by precisely locating the source of the submm emission (see e.g., SMM J094303+4700 H6 and H7; Tacconi et al., 2006).
In this paper, we present high-resolution SMA 890- interferometric imaging of LH 850.02/LH 1200.04 (hereafter simply LH 850.02), the brightest source in both the MAMBO 1200- (Greve et al., 2004) and SCUBA 850- (Coppin et al., 2006) maps of the Lockman Hole. In § 3 we describe our observations and data reduction, and in § 4 we discuss some possible implications of our results. Throughout this paper, we use the Vega magnitude system, and assume a flat concordance cosmology with km s-1 Mpc-1).
2 Target Selection
SHADES is a wide-area blank-field submm survey, covering both the Lockman Hole (LH) and Subaru/XMM–Newton Deep Field (SXDF), undertaken using SCUBA on the JCMT between 2002 and 2005 (Dunlop, 2005; Mortier et al., 2005). The map of the LH region covers an area of 485 arcmin2, mostly to an r.m.s. noise level of 2.2 mJy beam-1. The field has extensive complementary observations, including 1.4-GHz radio continuum imaging from the Very Large Array (VLA) to an r.m.s. noise level of 4.2 beam-1 (Ivison et al., 2002; Biggs & Ivison, 2006; Ivison et al., 2007), Spitzer/IRAC and MIPS 3.6- and 24- imaging to sensitivity limits of 1.3 and 55 , respectively (Huang et al., 2004; Egami et al., 2004, 2007), and -band optical imaging with the 8-m Subaru telescope to a depth of 27.9 mag (in a 2 aperture; see Ivison et al., 2004). Finally, additional multi-frequency optical () imaging of the Lockman Hole has now been obtained with the Subaru 8-m telescope, and a -band image is now available from Deep Extragalactic Survey component of the UKIRT Deep Infrared Sky Survey (see Dye et al. 2008 for details).

The target, LH 850.02, is the brightest SMG in the SHADES Lockman Hole sample (deboosted flux density of mJy) and was detected at significance with SCUBA (Coppin et al., 2006). It was first discovered as a MAMBO source ( mJy; Greve et al., 2004), and was included in the Ivison et al. (2005) sample of ‘robust’ SMGs. It is also the brightest 1100- SHADES-AzTEC source in the area covered by both SCUBA and MAMBO (Austermann et al. 2008, in prep.), but is not detected in the extremely deep (600 ks) XMM/Newton imaging of the LH (Brunner et al., 2008).
There are two candidate 1.4-GHz radio continuum counterparts within the SCUBA beam identified by Ivison et al. (2007): a northern candidate with flux density (LH 850.02N: 3.5 offset, probability of association), and a southern candidate with (LH 850.02S: 3.5 offset, ). Imaging at 610 MHz with the Giant Metre-wave Radio Telescope (Ibar et al., in prep.) fails to separate the two 1.4-GHz emitters, but shows a clear detection with a peak flux density of 140 beam-1 and total integrated flux of 277 . In a matched-resolution 1.4-GHz image, we find a source with a peak flux density of 57 beam-1 and total integrated flux of 97 , making LH 850.02 a fairly-steep-spectrum radio source (); marginally consistent with a starburst (; Condon, 1992), and possibly analogous to high-redshift radio galaxies (e.g., De Breuck et al., 2000), though orders of magnitude fainter.
Finally, we can exploit multi-wavelength photometry (see Table 1) of the LH 850.02 system to gain some insight into the nature of SMGs with multiple radio counterparts, which make up 10 per cent of the SMG population (Ivison et al., 2002; Pope et al., 2006) and 20 per cent of radio-identified SMGs (Ivison et al., 2007). Photometric redshifts derived from optical and near-IR photometry (see Figure 1; Dye et al., 2008) indicate that LH 850.02N () and LH 850.02S () may be physical associated. Furthermore, it is unlikely that LH850.02N and S are duplicate images of a strongly lensed object because they have very different mid–IR SEDs – LH850.02S has 24– emission – and their substantial relative separation () would require a very strong lensing potential (see e.g., Grogin & Narayan, 1996; Keeton et al., 2000).
While the slightly more northerly position of the MAMBO detection
favours LH 850.02N (Ivison
et al., 2005), statistical arguments and a
strong MIPS detection favour LH 850.02S
(e.g., Ashby
et al., 2006; Pope
et al., 2006); these ambiguous multi-wavelength
counterparts make LH 850.02 a compelling target for high-resolution
submm imaging. As we will make use of it later in this work, we
present the multiwavelength photometry for both LH 850.02N and
LH 850.02S in Table 1.
| Band | LH 850.02N | LH 850.02S |
|---|---|---|
| [Jy] | [Jy] | |
| B | ||
| R | ||
| I | ||
| z | ||
| K | ||
| 3.6m | ||
| 4.5m | ||
| 5.8m | ||
| 8.0m | ||
| 24m | ||
| 850m | … | |
| 890m | ||
| 1200m | … | |
| 20cm |
3 Observations and Data Reduction
The SMA observations were performed during 2007 March in the compact configuration (beam size 2 arcsec) in excellent weather () with a total on-source integration time of approximately 6 hr. The USB was tuned to 345 GHz, and combined with the LSB for an effective bandwidth of GHz at 340 GHz, which yielded a final synthesised image r.m.s. of 1.95 mJy. The pointing centre was the original SCUBA position from Coppin et al. (2006): and . The data were calibrated using the mir software package (Scoville et al., 1993), modified for the SMA. Passband calibration was done using 3C 84, 3C 111, and Callisto. The absolute flux scale was set using observations of Callisto and is estimated to be accurate to better than 20%. Time-dependent complex gain calibration was done using 0958+655 (0.6 Jy, 21.8∘ away) and 0927+390 (1.8 Jy, 37.7∘ away). The calibrator 0958+655 was also calibrated independently using 0927+390 and used for empirical verification of the astrometric uncertainty and the angular size of the target. Positions and flux densities were derived from the calibrated visibilities using the miriad (Sault et al., 1995) software package.
We detect LH 850.02 in the synthesized image at . The calibrated visibilities were best fit by a single point source (see Figures 2 and 3) with an integrated flux density of mJy at a position of and , which is offset from the original SCUBA position by 3.28 arcsec. The astrometric uncertainties are arcsec (0.20 arcsec systematic; 0.13 arcsec statistical) and arcsec (0.19 arcsec systematic; 0.10 arcsec statistical), in agreement with the expectations of Downes et al. (1999) and Younger et al. (2007).
4 Discussion
The synthesised SMA image (see Figure 3) clearly shows a single point source within the SCUBA beam. As noted in § 3, this source is offset from the SCUBA centroid by 3.28 arcsec, as compared to the SCUBA positional uncertainty of 2.1 arcsec (, where is the SCUBA beam fwhm of 14 arcsec and S/N is the signal-to-noise ratio, corrected for flux boosting; Ivison et al., 2007). The point-source fit to the visibility data ( mJy) is perfectly consistent with the expectation from the deboosted SCUBA flux of mJy ( mJy when centered on the SMA position), assuming a reasonable range of spectral slopes and temperatures (; , k). This supports the compactness of the submm emission seen in the visibility function (see Figure 2); virtually none of the flux seen in the SCUBA map has been resolved out.
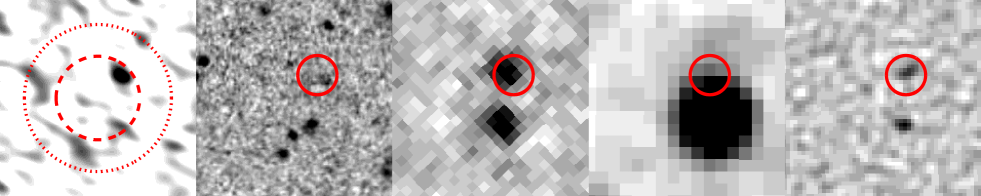
In Figure 3, we present (from left to right) the SMA “dirty” map and the derived submm position overlaid on optical (-band), IRAC 3.6-, MIPS 24- and VLA 1.4-GHz imaging data. The SMA image clearly singles out the weaker of the two candidate radio counterparts, and this is the one which is not associated with the bright 24- source111There is a peak nearly coincident with LH850.02S; the upper limit is listed in Table 1. However we note that the primary detection accounts entirely for the SCUBA flux.. This is consistent with the photometric redshift of LH850.02N if we assume a starburst–dominated mid-IR spectrum similar to local ultraluminous IR galaxies (ULIRGs; e.g. Armus et al., 2007; Desai et al., 2007), analogous systems (e.g., Weedman et al., 2006; Farrah et al., 2008, Huang et al. 2008, in prep.), or other SMGs (Lutz et al., 2005; Valiante et al., 2007; Menéndez-Delmestre et al., 2007).
The SCUBA and SMA imaging data – including upper limits at the location of LH850.02S – are marginally consistent with the observed far–IR SEDs of two luminous starbursts at (LH850.02N) and (LH850.02S) respectively. However, SMA imaging in combination with optical/near–IR photometric redshifts for both sources favors a scenario in which the submm emission from LH 850.02 arises almost entirely from LH 850.02N and is not a blend of two lower-luminosity sources. This is consistent with the predicted rarity of SMGs arising from confusion (Ivison et al., 2007). At these redshifts, their 24–to–submm ratios (see also Wang et al., 2007) suggest that LH 850.02N has an Arp 220-type starburst-dominated far-IR SED, while LH 850.02S has a Mrk 231-type far-IR SED with a significant contribution from a warmer dust component such as a warm starburst (OFRGs; Chapman et al., 2004) or active nucleus. This is qualitatively similar to SMM J094303+4700 (Tacconi et al., 2006), in which only one of the two radio counterparts (H6: Ledlow et al., 2002) shows strong CO emission, which could be explained by AGN heating of the dust in the intrinsically CO poor radio source (H7). Therefore, LH 850.02 and, by analogy many other SMGs with multiple radio identifications, may be physically associated systems in which the SMG starburst phase is associated with a period of intense AGN activity (Sanders & Mirabel, 1996; Page et al., 2004; Hopkins et al., 2006).
Furthermore, although the relatively low S/N () limits the robustness of size measurements, the visibility function (Figure 2) for LH 850.02 is consistent with a compact point–source out to 120 k, from which we infer a maximum angular extent of 1 arcsec; similar to other SMGs detected by SMA at 890 (Iono et al., 2006; Younger et al., 2007; Wang et al., 2007) and others observed at mm wavelengths (Greve et al., 2005; Tacconi et al., 2006). At a redshift of , this corresponds to a physical scale for the rest-frame far-IR continuum of 8 kpc, consistent with a merger-driven starburst analogous to local ULIRGs (Downes & Solomon, 1998; Sakamoto et al., 1999, 2006; Iono et al., 2007, see also C. Wilson et al. 2008, in prep.; Iono et al. 2008, in prep.), and may be in conflict with cool, extended cirrus dust models (Efstathiou & Rowan-Robinson, 2003; Kaviani et al., 2003) or a monolithic collapse scenario. Our constraints on size are only barely consistent with extended (1 arcsec) starbursts of the kind inferred from high-resolution radio imaging – though some sources are reported as compact even at arcsec resolution (Chapman et al., 2004; Biggs & Ivison, 2007).
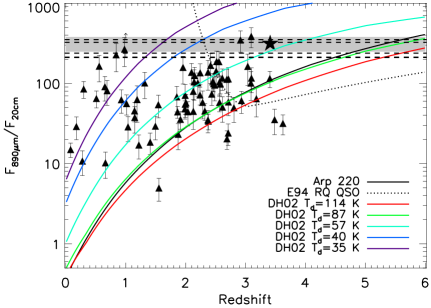
We can then use the observed submm–to–radio flux density ratio, coupled with photometric redshift and observed constraints on the physical scale of the rest–frame far–IR to infer some of the physical properties of the starburst. Figure 4 shows the submm-to-radio flux density ratio for LH 850.02, as compared to the possible high-redshift SMGs from Younger et al. (2007), SMGs with optical redshifts from Chapman et al. (2005), tracks for Arp 220, the models of Dale & Helou (2002) and the median radio-quiet quasar spectral energy distribution from Elvis et al. (1994). The observed submm–to–radio flux density ratio of LH850.02N indicates a dust temperature of K, which is consistent with the observed compactness of the submm emission (see Kaviani et al., 2003). Using the template SEDs of Dale & Helou (2002) for this best–fit dust temperature at the photometric redshift of , we find that the observed submm emission of corresponds to a total IR luminosity of , which – assuming a Salpeter (1955) IMF – indicates a total SFR of yr-1 (Kennicutt, 1998; Bell, 2003). Should even higher-resolution imaging place tighter limits on the physical scale of the submm emission in LH850.02N, such a confined, luminous starburst may have important physical consequences; Eddington arguments (e.g., Murray et al., 2005; Thompson et al., 2005) suggest a minimal scale for such regions.
Finally, considering its far–IR luminosity and compactness, the lack of detectable 24 emission, and its observed submm–to–radio flux density ratio, we find that LH 850.02 appears to share many of the observed characteristics of other putative high-redshift SMGs (Iono et al., 2006; Younger et al., 2007; Wang et al., 2007; Dannerbauer et al., 2008). As discussed in more detail in Younger et al. (2007), the existence of such a population provides tight constraints on models of galaxy formation and evolution, and on dust production. In addition, it fuels speculation that the brightest SMGs may be the most distant (see also Ivison et al., 2002) and suggests significant and rapid down-sizing (e.g., Cowie et al., 1996) in the SMG population over a relatively short interval in cosmic time (see also Wall et al., 2008).
5 Conclusion
We present high-resolution 890- interferometric imaging of LH 850.02, a bright SMG in the LH, with the SMA. We detect LH 850.02 at as a single compact (size 1 arcsec, or 8 kpc) point source, and determine a position accurate to 0.2 arcsec. From this, we identify multi-wavelength counterparts and find that only one (LH850.02N) of two candidate radio counterparts is associated with the submm emission. The nearby radio source with strong 24- emission (LH850.02S) does not contribute significantly to the submm flux. In this case, and by analogy other SMGs with multiple radio counterparts, the radio continuum more reliably locates the source of the submm – and with it the properties of the associated starburst – than does the mid–IR; similar to the results of Younger et al. (2007). Since both radio sources have similar photometric redshifts, and therefore may be physically associated, their respective 24–to–submm suggest that LH 850.02N has an Arp 220-type starburst-dominated far-IR SED, while LH 850.02S has a Mrk 231-type SED with a significant mid-infrared contribution from an active nucleus.
As a result of the relatively shallow, wide-field surveys conducted to date with the AzTEC camera – wherein objects of this type were first found in significant numbers (Younger et al., 2007) – existing 1100- samples are typically 2 brighter than samples selected with SCUBA or MAMBO. We suggest that the recent prevalence of candidate high-redshift SMGs is more closely related to their high flux densities than to the long survey wavelength, a tendency noted by Ivison et al. (2002) and Wall et al. (2008). It is therefore perhaps not surprising that we have here constrained the brightest source in the SHADES survey of the LH, LH 850.02, to lie at high redshift .
Acknowledgements
The SMA is a joint project between the Smithsonian Astrophysical Observatory and the Academia Sinica Institute of Astronomy and Astrophysics and is funded by the Smithsonian Institution and the Academia Sinica. This work is based in on observations made with the Spitzer Space Telescope, which is operated by the Jet Propulsion Laboratory, California Institute of Technology, under contract 1407, and data collected at Subaru Telescope, which is operated by the National Astronomical Observatory of Japan. The James Clerk Maxwell Telescope is operated by The Joint Astronomy Centre on behalf of the Science and Technology Facilities Council of the United Kingdom, the Netherlands Organisation for Scientific Research, and the National Research Council of Canada. IS acknowledges support from the Royal Society.
References
- Armus et al. (2007) Armus L., et al., 2007, ApJ, 656, 148
- Ashby et al. (2006) Ashby M. L. N., et al., 2006, ApJ, 644, 778
- Barger et al. (1999) Barger A. J., Cowie L. L., Sanders D. B., 1999, ApJ, 518, L5
- Barger et al. (1998) Barger A. J., et al., 1998, Nature, 394, 248
- Bell (2003) Bell E. F., 2003, ApJ, 586, 794
- Bertoldi et al. (2007) Bertoldi F., et al., 2007, ApJS, 172, 132
- Biggs & Ivison (2006) Biggs A. D., Ivison R. J., 2006, MNRAS, 371, 963
- Biggs & Ivison (2007) Biggs A. D., Ivison R. J., 2007, MNRAS, in press [astro-ph/0712.3047]
- Blain et al. (2004) Blain A. W., Chapman S. C., Smail I., Ivison R., 2004, ApJ, 611, 725
- Blain et al. (1999) Blain A. W., Smail I., Ivison R. J., Kneib J.-P., 1999, MNRAS, 302, 632
- Blain et al. (2002) Blain A. W., Smail I., Ivison R. J., Kneib J.-P., Frayer D. T., 2002, Phys. Rep., 369, 111
- Borys et al. (2003) Borys C., Chapman S., Halpern M., Scott D., 2003, MNRAS, 344, 385
- Borys et al. (2002) Borys C., Chapman S. C., Halpern M., Scott D., 2002, MNRAS, 330, L63
- Brunner et al. (2008) Brunner H., et al., 2008, A&A, 479, 283
- Chapman et al. (2005) Chapman S. C., Blain A. W., Smail I., Ivison R. J., 2005, ApJ, 622, 772
- Chapman et al. (2002) Chapman S. C., Scott D., Borys C., Fahlman G. G., 2002, MNRAS, 330, 92
- Chapman et al. (2004) Chapman S. C., Smail I., Blain A. W., Ivison R. J., 2004, ApJ, 614, 671
- Chapman et al. (2004) Chapman S. C., Smail I., Windhorst R., Muxlow T., Ivison R. J., 2004, ApJ, 611, 732
- Condon (1992) Condon J. J., 1992, ARA&A, 30, 575
- Coppin et al. (2006) Coppin K., et al., 2006, MNRAS, 372, 1621
- Cowie et al. (2002) Cowie L. L., Barger A. J., Kneib J.-P., 2002, AJ, 123, 2197
- Cowie et al. (1996) Cowie L. L., Songaila A., Hu E. M., Cohen J. G., 1996, AJ, 112, 839
- Dale & Helou (2002) Dale D. A., Helou G., 2002, ApJ, 576, 159
- Dannerbauer et al. (2002) Dannerbauer H., et al., 2002, ApJ, 573, 473
- Dannerbauer et al. (2004) Dannerbauer H., et al., 2004, ApJ, 606, 664
- Dannerbauer et al. (2008) Dannerbauer H., Walter F., Morrison G., 2008, ApJ, 673, L127
- De Breuck et al. (2000) De Breuck C., van Breugel W., Röttgering H. J. A., Miley G., 2000, A&AS, 143, 303
- Desai et al. (2007) Desai V., et al., 2007, ApJ, 669, 810
- Downes et al. (1999) Downes D., et al., 1999, A&A, 347, 809
- Downes & Solomon (1998) Downes D., Solomon P. M., 1998, ApJ, 507, 615
- Dunlop (2001) Dunlop J. S., 2001, New Astronomy Reviews, 45, 609
- Dunlop (2005) Dunlop J. S., 2005, in de Grijs R., González Delgado R. M., eds, Starbursts: From 30 Doradus to Lyman Break Galaxies Vol. 329 of Astrophysics and Space Science Library, SHADES: The Scuba HAlf Degree Extragalactic Survey. pp 121–+
- Dwek et al. (1998) Dwek E., et al., 1998, ApJ, 508, 106
- Dye et al. (2008) Dye S., et al., 2008, MNRAS, [astro-ph/0802.0497]
- Eales et al. (1999) Eales S., et al., 1999, ApJ, 515, 518
- Eales et al. (2000) Eales S., et al., 2000, AJ, 120, 2244
- Efstathiou & Rowan-Robinson (2003) Efstathiou A., Rowan-Robinson M., 2003, MNRAS, 343, 322
- Egami et al. (2004) Egami E., et al., 2004, ApJS, 154, 130
- Egami et al. (2007) Egami E., et al., 2007, in preparation
- Elvis et al. (1994) Elvis M., et al., 1994, ApJS, 95, 1
- Farrah et al. (2008) Farrah D., et al., 2008, ApJ, in press [astro-ph/0801.1842]
- Fazio et al. (2004) Fazio G. G., et al., 2004, ApJS, 154, 10
- Fixsen et al. (1998) Fixsen D. J., et al., 1998, ApJ, 508, 123
- Frayer et al. (2000) Frayer D. T., Smail I., Ivison R. J., Scoville N. Z., 2000, AJ, 120, 1668
- Genzel et al. (2003) Genzel R., et al., 2003, ApJ, 584, 633
- Greve et al. (2004) Greve T. R., et al., 2004, MNRAS, 354, 779
- Greve et al. (2005) Greve T. R., et al., 2005, MNRAS, 359, 1165
- Grogin & Narayan (1996) Grogin N. A., Narayan R., 1996, ApJ, 464, 92
- Hauser et al. (1998) Hauser M. G., et al., 1998, ApJ, 508, 25
- Ho et al. (2004) Ho P. T. P., Moran J. M., Lo K. Y., 2004, ApJ, 616, L1
- Holland et al. (1999) Holland W. S., et al., 1999, MNRAS, 303, 659
- Hopkins et al. (2006) Hopkins P. F., et al., 2006, ApJS, 163, 1
- Huang et al. (2004) Huang J.-S., et al., 2004, ApJS, 154, 44
- Hughes et al. (1998) Hughes D. H., et al., 1998, Nature, 394, 241
- Iono et al. (2006) Iono D., et al., 2006, ApJ, 640, L1
- Iono et al. (2007) Iono D., et al., 2007, ApJ, 659, 283
- Ivison et al. (2002) Ivison R. J., et al., 2002, MNRAS, 337, 1
- Ivison et al. (2004) Ivison R. J., et al., 2004, ApJS, 154, 124
- Ivison et al. (2005) Ivison R. J., et al., 2005, MNRAS, 364, 1025
- Ivison et al. (2007) Ivison R. J., et al., 2007, MNRAS, 380, 199
- Kaviani et al. (2003) Kaviani A., Haehnelt M. G., Kauffmann G., 2003, MNRAS, 340, 739
- Keeton et al. (2000) Keeton C. R., et al., 2000, ApJ, 542, 74
- Kennicutt (1998) Kennicutt Jr. R. C., 1998, ARA&A, 36, 189
- Kneib et al. (2005) Kneib J.-P., et al., 2005, A&A, 434, 819
- Knudsen et al. (2006) Knudsen K. K., et al., 2006, MNRAS, 368, 487
- Knudsen et al. (2008) Knudsen K. K., van der Werf P. P., Kneib J. ., 2008, MNRAS, in press [astro-ph/0712.1904]
- Laurent et al. (2005) Laurent G. T., et al., 2005, ApJ, 623, 742
- Ledlow et al. (2002) Ledlow M. J., et al., 2002, ApJ, 577, L79
- Lutz et al. (2005) Lutz D., et al., 2005, ApJ, 625, L83
- Menéndez-Delmestre et al. (2007) Menéndez-Delmestre K., et al., 2007, ApJ, 655, L65
- Mortier et al. (2005) Mortier A. M. J., et al., 2005, MNRAS, 363, 563
- Murray et al. (2005) Murray N., Quataert E., Thompson T. A., 2005, ApJ, 618, 569
- Neri et al. (2003) Neri R., et al., 2003, ApJ, 597, L113
- Page et al. (2004) Page M. J., Stevens J. A., Ivison R. J., Carrera F. J., 2004, ApJ, 611, L85
- Pei et al. (1999) Pei Y. C., Fall S. M., Hauser M. G., 1999, ApJ, 522, 604
- Pope et al. (2006) Pope A., et al., 2006, MNRAS, 370, 1185
- Rieke et al. (2004) Rieke G. H., et al., 2004, ApJS, 154, 25
- Sakamoto et al. (1999) Sakamoto K., et al., 1999, ApJ, 514, 68
- Sakamoto et al. (2006) Sakamoto K., Ho P. T. P., Peck A. B., 2006, ApJ, 644, 862
- Salpeter (1955) Salpeter E. E., 1955, ApJ, 121, 161
- Sanders & Mirabel (1996) Sanders D. B., Mirabel I. F., 1996, ARA&A, 34, 749
- Sault et al. (1995) Sault R. J., Teuben P. J., Wright M. C. H., 1995, in Shaw R. A., Payne H. E., Hayes J. J. E., eds, ASP Conf. Ser. 77: Astronomical Data Analysis Software and Systems IV A Retrospective View of MIRIAD. p. 433
- Scott et al. (2006) Scott D., et al., 2006, in Bulletin of the American Astronomical Society Vol. 38 of Bulletin of the American Astronomical Society, A Deep AzTEC Map of the GOODS-North Field. pp 1072–+
- Scott et al. (2008) Scott K. S., et al., 2008, MNRAS, in press [astro-ph/0801.2779]
- Scott et al. (2002) Scott S. E., et al., 2002, MNRAS, 331, 817
- Scoville et al. (1993) Scoville N. Z., Carlstrom J. E., Chandler C. J., Phillips J. A., Scott S. L., Tilanus R. P. J., Wang Z., 1993, PASP, 105, 1482
- Serjeant et al. (2003) Serjeant S., et al., 2003, MNRAS, 344, 887
- Sheth et al. (2004) Sheth K., et al., 2004, ApJ, 614, L5
- Smail et al. (1997) Smail I., Ivison R. J., Blain A. W., 1997, ApJ, 490, L5
- Tacconi et al. (2006) Tacconi L. J., et al., 2006, ApJ, 640, 228
- Thompson et al. (2005) Thompson T. A., Quataert E., Murray N., 2005, ApJ, 630, 167
- Valiante et al. (2007) Valiante E., et al., 2007, ApJ, 660, 1060
- Wall et al. (2008) Wall J. V., Pope A., Scott D., 2008, MNRAS, 383, 435
- Wang et al. (2004) Wang W.-H., Cowie L. L., Barger A. J., 2004, ApJ, 613, 655
- Wang et al. (2007) Wang W.-H., et al., 2007, ApJ, 670, L89
- Webb et al. (2003) Webb T. M., et al., 2003, ApJ, 587, 41
- Weedman et al. (2006) Weedman D., et al., 2006, ApJ, 653, 101
- Wilson et al. (2008) Wilson G. W., et al., 2008, MNRAS, in press [astro-ph/0801.2783], 801
- Younger et al. (2007) Younger J. D., et al., 2007, ApJ, 671, 1531