2007 \SetConfTitleProceedings of the Huatulco meeting on AGN \suppressfulladdresses \addkeywordgravitational lensing \addkeywordquasars:individual: RXS J113155.4-123155
Microlensing probes the AGN structure of the lensed quasar J1131-1231
Abstract
We present the analysis of single epoch long slit spectra of the three brightest images of the gravitationally lensed system J1131-1231. These spectra provide one of the clearest observational evidence for differential micro-lensing of broad emission lines (BELs) in a gravitationally lensed quasar. The micro-lensing effect enables us: (1) to confirm that the width of the emission lines is anti-correlated to the size of the emitting region; (2) to show that the bulk of Fe is emitted in the outer parts of the Broad Line Region (BLR) while another fraction of Fe is produced in a compact region; (3) to derive interesting informations on the origin of the narrow intrinsic Mg absorption doublet observed in that system.
0.1 Introduction
J1131-1231 is one of the nearest gravitationally lensed AGN. The lensing galaxy () splits the light rays from the source () into four macro-images: three bright images (A-B-C) separated on the sky by typically 1 and a fainter component (D) located at 3.6 from A (Sluse et al. SLU03, 2003). The present study focuses on the lensed images A-B-C. The lensing effects in a system like J1131-1231 occur for two different regimes. First, the lensing galaxy produces four resolved macro-images of the background source. Second, the compact masses in that galaxy (typically ) split each macro-lensed image into multiple of unresolved micro-images separated by a few micro-arcseconds. Because gravitational lensing magnifies the source, each (unresolved) macro-image is amplified by a factor associated with macro-lensing and by a factor due to micro-lensing. The typical length scale for micro-lensing (in the quasar plane) is the Einstein radius of the micro-lens:
| (1) |
where , , are the angular-size distances between observer and source (os), lens and source (ls) and observer and lens (ol) (see e.g. Wambsganss WAM06, 2006 for a review on micro-lensing). Micro-lensing acts as a magnifying glass which amplifies regions of the source on scales smaller or equal to the micro-lens Einstein radius. For J1131-1231, a solar mass Einstein radius has a size similar to the usually assumed size of the BLR, meaning that regions as large as the BLR can be amplified by micro-lensing. Because micro-lensing occurs independently in each macro-lensed images, we can track for spectral differences between multiple images of a lensed quasar. Such differences reveal the selective micro-amplification of small regions of the source. Unfortunately, spectral differences between macro-lensed images are not only due to micro-lensing. The time delay between the macro-lensed images can also induce spectral differences between images (because each lensed image is a snapshot of the source at a different epoch). Hopefully, the time delay between images A-B-C of J1131-1231 is less than a few days (e.g. Saha et al. SAH06, 2006) and thus can be neglected. Differential reddening between lensed images due to the lensing galaxy might also exist. This effect seems however to be negligible in the case of J1131-1231 (Sluse et al. SLU06, 2006, SLU07, 2007). After a brief description of the data (Sect. 0.2), we interpret the main spectral differences observed between images A-B-C of J1131-1231 in the micro-lensing framework (Sect. 0.3). More results can be found in Sluse et al. (SLU07, 2007; SLU07).
0.2 Data
We present long slit spectra of J1131-1231 obtained with the FORS2 instrument (ESO Very Large Telescope) on April 26th 2003. These data consist of spectra obtained with the 1 slit oriented along the lensed images B-A-C. We used 2 grisms which cover the wavelength ranges Å and Å with a resolving power around 800 and 1500 at the respective central wavelengths. A total exposure time of 960s has been devoted to each grism. This observational set up enables us to cover the (AGN) rest-frame range 2500-5600 Å. Standard reductions steps have been followed. Due to blending between the spectra of images A-B-C, we extracted the spectra by fitting three Moffat profiles along the spatial direction for each wavelength bin independently. Comparison of the fitted 2D spectra with the observations confirmed that this procedure provides an optimal extraction of the individual spectra (except in the [O ] region where residuals up to 0.5 of the [O ] flux are observed).
0.3 Results
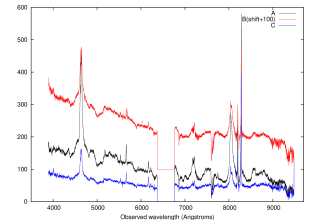
The spectra of A-B-C are shown on Fig. 1. Because spectral differences between A-B-C are only due to micro-lensing, one can assume that the observed spectra are simply made of a superposition of a spectrum which is only macro-lensed and of a spectrum both macro and micro-lensed. Using pairs of observed spectra, it is then easy to extract both components and . Defining as the macro-amplification ratio between image 1 and image 2 and as the micro-lensing factor affecting image 1 (image 2 assumed not to be micro-lensed), then we have:
| (2) |
The latter equations can be rewritten:
| (3) |
where must be chosen to satisfy the positivity constraint and . Assuming that the narrow line region is too large to be micro-lensed, one easily retrieves and for any pair of images. One can show that image B is not affected by micro-lensing (SLU07) so that this decomposition applied to image pairs A-B and C-B reveals which regions of the quasar are micro-lensed in images A and C (Fig. 2). We see that the broad emission lines (BELs) are nearly completely micro-lensed in image C and partially micro-lensed in image A. This difference of behaviour is likely due to the larger of the micro-lens affecting C. Indeed, the micro-lensed fraction of a given emitting region increases with the of the micro-lens (Eq. 1). In this context, an emission region that is micro-lensed in image A should also be micro-lensed in image C and should be very compact, while a larger emitting region might be micro-lensed only in image C. Finally, even larger regions should not be micro-lensed neither in A nor in C. Consequently, this analysis provides information about the AGN structure based on the identification and characterization of the emitting regions micro-lensed in A & C (a complementary analysis technique is presented in SLU07).
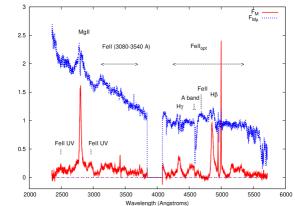
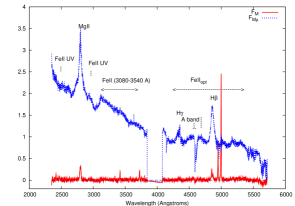
Based on Fig. 2, we conclude that the smallest regions (micro-lensed in both A and C) are the regions emitting the very broad component of Mg , the Fe emission observed in the range 3080-3540 Å and a fraction of the Fe opt in the range 4630-4800 Å. The remaining of the Fe emission as well as the bulk of the BELs are emitted in regions with a larger size (because they are micro-lensed only in C). Finally, the largest regions are those emitting the narrow core of the BELs, which is not micro-lensed. We notice that microlensing in both A and C of the wings of the BELS is easily explained with an outflowing BLR. Although less likely, micro-lensing of a BLR with a rotating accretion disk can produce a similar observational signature (Abajas et al. ABA02, 2002).
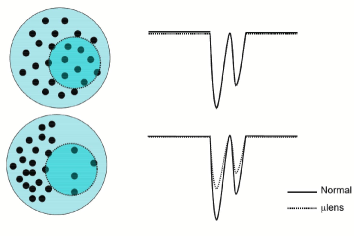
Another remarkable result is the presence in our spectra of an intrinsic Mg absorption doublet blueshifted at 0.654 (v -660 km/s). These lines disappear from the spectrum ratios A/B and C/B. This indicates that the absorbed flux is proportional to the flux coming from the continuum+BLR. This implies that the region at the origin of the absorption must cover both the continuum and the BLR and that, within the uncertainties, their depths are identical in the spectra of images A, B, C. One can see the differential micro-lensing at work in J1131-1231 as a probe of the inhomogeneities in the absorbing medium (Fig. 3). Indeed, by lensing more (less) strongly some regions of the source, differential micro-lensing increases (decreases) the contribution of a fraction of the intervening absorber to the total absorption. The nearly identical absorption depths seen in the three images indicate that both the spatial distribution and the optical depth of the absorbing clouds must be quite homogeneous over the continuum and BLR. This is compatible with an absorption region constituted of a large number of small absorbing clouds, their projected sizes being significantly smaller than the local continuum region (i.e. continuum+BLR).
We have shown (SLU07) that micro-lensing is a very useful tool to study the AGN structure. A step forward is to perform a spectroscopic monitoring of micro-lensing events (the latter occur at any time in quadruply imaged quasars). Such a program will allow to derive absolute sizes (or tight upper limits) of the BLR and maybe to probe their geometry.
Acknowledgements.
This work is supported by the Swiss National Science Foundation, by ESA PRODEX under contract PEA C90194HST and by the Belgian Federal Science Policy Office.References
- (1) Abajas, C. et al. 2002, ApJ, 576, 640
- (2) Saha, P. et al. 2006, A&A, 450, 461
- (3) Sluse, D. et al. 2003, A&A, 406, L43
- (4) Sluse, D. et al. 2006, A&A, 449, 539
- (5) Sluse, D. et al. 2007, A&A, 468, 885 (SLU07)
- (6) Wambsganss, J. in Gravitational lensing: strong, weak and micro. Saas-Fee Advanced Course 33. Editors G. Meylan, P. Jetzer and P. North.