INAF - Osservatorio Astronomico di Brera, Milano - Italy \PACSes\PACSit98.52.EhElliptical galaxies
Probing the Nature of EROs through ASTRO-F/AKARI observations
Abstract
We present a preliminary analysis of ASTRO-F data of a complete sample of 150 EROs (R-K5) down to K19, for which reliable photometric redshifts are available, in the range 0.8z2, selected over two fields (S7 and S2) of the MUNICS survey. The area covered is about 420 arcmin2. We have imaged this area with AKARI telescope in N3 (3.4 m), N60 (65 m) and WL (150 m) down to 12 Jy in the N3 filter, in order to detect the rest frame H or K-band emission, thus providing an excellent sampling of the SED of our EROs. From a first analysis we have an identification rate of 63% in the N3 filter over the S7 field. These data allow us to distinguish starburst from passive early type phenomena, to meseaure the SFR of the starburst component and to constrain the mass assembly of early type galaxies.
1 Introduction
While the general build-up of cosmic structures seems to be well described by hierarchical models of galaxy formation (CDM), the assembly of the baryonic mass on galactic scale still represents a weak point of the galaxy formation models. One of these difficulties consists in explaining the large population of Extremely Red Objects (R-K5) EROs. This population is a mixture of early type galaxies (ETG) and dusty star forming galaxies (SFG). Hierarchical models should reproduce the abundance of massive red galaxies at 12 and the balance among the number of early type and obscured star-forming galaxies [7]. Mid/Far-IR observations can play a key role in the study of this pupulation: such data can allow to disantangle between the early type and star forming phenomena and, in particular, mid-IR data allow to assess a more reliable estimate of stellar masses of EROs, as they allow to sample the rest-frame near-IR emission. Since the mid-IR observations are usually not available for large samples of EROs, the rest frame H-K emission is extrapolated from the observed optical emission (partially affected by extinction) which is dominated by young stars (0.5-1Gyr), whose contribution to the near-IR emission (dominated by older stars) is negligible. As the EROs are mainly composed of old stars, the reliability of stellar masses estimates is extremely uncertain. The way to provide the models with robust observational constraints passes through mid-IR observations of a large (100), bright (K19) and complete sample of EROs.
2 The EROs Sample. Optical and IR Data
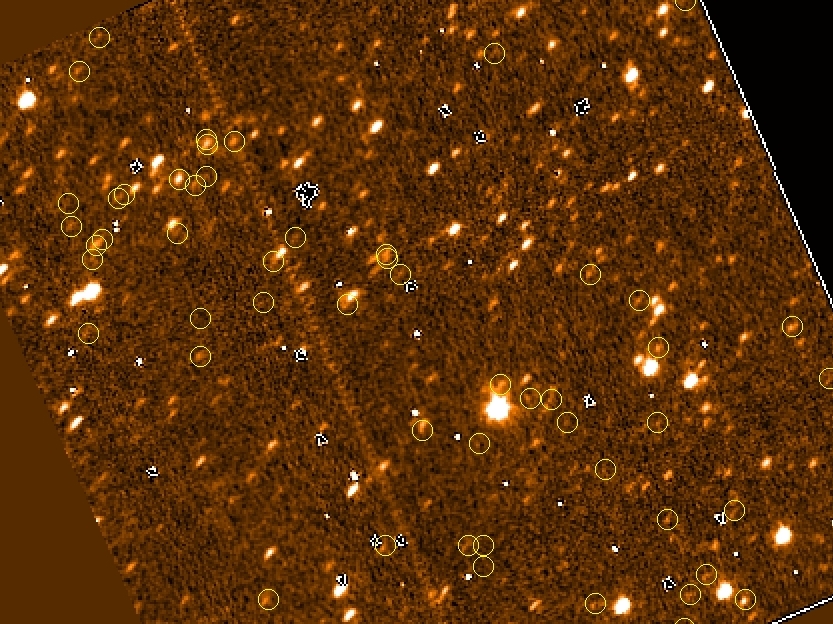
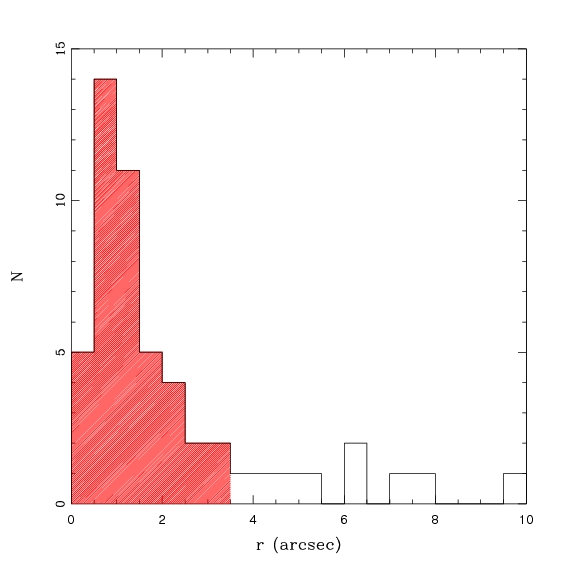
We selected a complete sample of 150 EROs (R-K5) at K19 over two well separated fields (S7 and S2) of the MUNICS survey [6]. This area ( 420 arcmin2) and the redshift range (0.8z2) covered by our sample imply a volume larger than 106 Mpc3. MUNICS provides multiband information (B,V,R,I,J,K) down to Vega limiting magnitudes 25, 24, 23, 21, 19.5 and photometric redshifts [6]. We have imaged this area with the AKARI telescope in N3 (3.4 m), N60 (65 m) and WL (150 m) down to 12 Jy in the N3 filter. This value is shallower by a factor 2 respect to what expected on the basis of AKARI Exposure Time Calculator, calculated in order to detect in this passband all the EROs present in the field. In this work we present the preliminary analysis made on the N3 images of S7 field (see Fig. 1, left panel), where 65 EROs are present. We searched for the nearest mid-IR object to identify the N3 counterparts of our selected EROs. Fig. 1 (right panel) shows the mid-IR optical distance distribution of the N3 counterparts. As it can be seen, most of identifications are found within 3.5′′which is consistent with the combined astrometric errors. Beyond this distance the distribution is flat as expected for spurious identifications. Thus, we identify 41/65 EROs with a success rate of 63% and a contamination rate of 7%. We have calculated the contamination rate, producing several mock catalogs by randomly shifting the EROs positions and searching for the nearest AKARI identification within 3.5′′.
3 Sample Composition
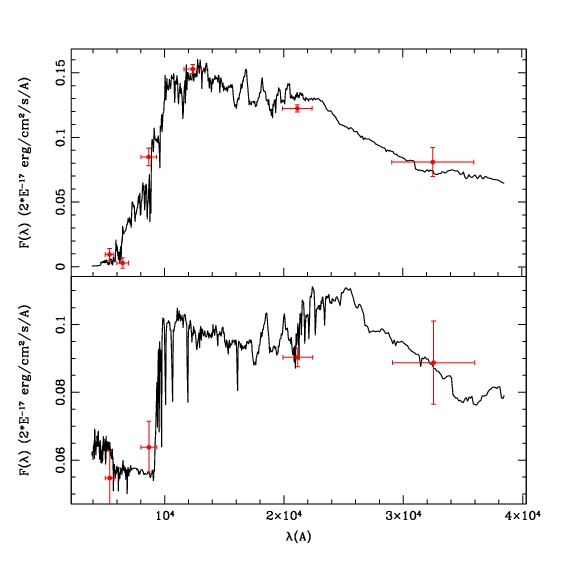
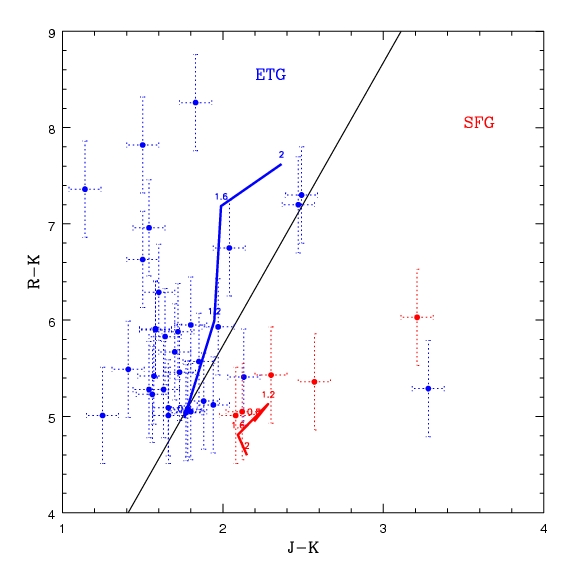
We performed a SED fitting at the fixed photometric redshifts running the Hyperz [1] routine to assess the spectral type of our 41 identified EROs. We used a template with an exponentially declining SFR with e-folding time (=0.1Gyr) and AV 0.2 to describe the early type galaxies and a constant star formation model with A 2.0 to describe star forming galaxies. The templates have been built with the Charlot & Bruzual (CB 2007 [3]) code, assuming the Chabrier initial mass function and solar metallicity. The spectral type is assigned by the fit with the lowest reduced value. 35 objects (85% of the whole sample) were classified as ETGs (Early Type Galaxies), while the remaining 6 (15%) as SFGs (Star Forming Galaxies). The choice of A for the ETGs implies that these galaxies can be reddened only by old ages (and not by dust), preventing any degeneration. In Fig. 2 (left panel) we show an example of ETG and SFG galaxy, respectively . We stress that part of the SFG component can be misclassified by the routine, thus explaining their low number. In Fig. 2 (right panel) we show the J-K vs. R-K colours of our sample. The solid line R-K = (J-K) +0.05 represent the border between passively evolving and star forming galaxies [8]. Also plotted the evolutionary tracks for ETGs (blu line) and SFGs (red line) in the redshift range 0.8z2. Our classification broadly agrees with the Mannucci plot, but as we may notice, a considerable number of galaxies populate the area very close to the partition line. In particular while none of the SFG we classified fall in the ETG zone, some of the ETGs fall in the SFG zone, confirming the hypothesis of an overestimate of the ETG class of objects.
4 Stellar Mass Density
We calculated the Stellar Mass for each galaxy from the best fitting model, following the equation:
| (1) |
where DL is the luminosity distance, b is a normalization factor as output of hyperz and Mmodel is the integral of the SFR of the model at the age fitted by the routine. The mass calculated result to be an overestimate of the real mass locked in stars, as we do not take into account the so-called return fraction, i.e. the gas processed into stars and returned to the ISM.
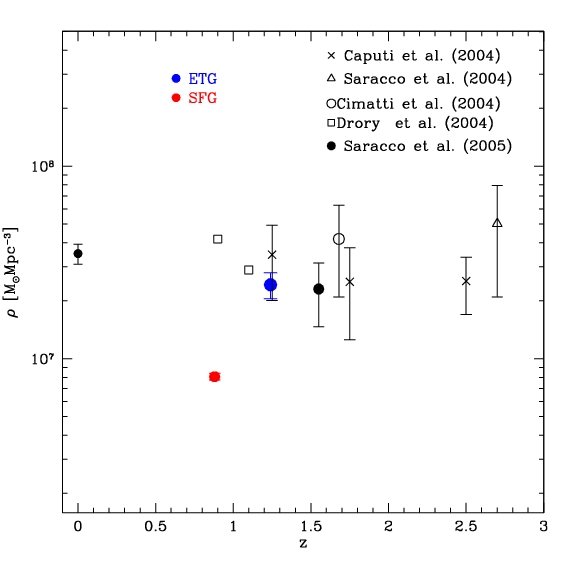
In Fig 3 we show the evolution in of the stellar mass density compared with other values in the literature. We obtained a stellar mass density for the ETG class. If we compare this value with the one obtained locally integrating the K–band luminosity function of the early type galaxies [10], we can conclude that there is no evolution till z 1.3 in the stellar mass density of the ETG population, constraining the assembly of such objects to 2.
We notice that our results are consistent with other literature values, although the authors we compare with do not refer to the same selection criteria. In particular Cimatti et al. [4] (open circle) take into account the density of spheroidal galaxies independently on their masses, Saracco et al. [9] and Caputi et al. [2] (open triangles and crosses respectively) represent the density of M evolved galaxy candidates and Drory et al. [6] (open squares) show the upper limit to the number density of galaxies with M. In fact there is no evidence of significant evolution in the stellar mass density of the most massive galaxies, in contrast with hierarchical models (e.g. [5]) which predict that most (%) of the high mass ETGs should complete their growth at .
References
- [1] \BYBolzonella M., Miralles J.-M., Pelló, R. 2000, A&A, 363, 476
- [2] \BYCaputi K.I., Dunlop J.S., McLure R.J. et al. 2004, MNRAS, 353, 30
- [3] \BYCharlot & Bruzual in prep.
- [4] \BYCimatti A., Daddi E., Renzini A., et al. 2004, Nature, 430, 184
- [5] \BYDe Lucia G., Springel V., White S., et al. 2006, MNRAS, 366, 499
- [6] \BYDrory N., Bender R., Snigula J. et al. 2001, ApJ 562, 111
- [7] \BYNagamine K, Cen R., Hernquist, L. et al. 2005, ApJ, 627, 608
- [8] \BYPozzetti M., Mannucci F. 2002, MNRAS, 317, 17
- [9] \BYSaracco P., Longhetti M., Giallongo E. et al. 2004, A&A, 420, 125
- [10] \BYSaracco P., Longhetti M., Severgnini P. et al. 2005, MNRAS, 357, 40