Detecting metal-rich intermediate-age Globular Clusters in NGC 4570 using K-band photometry
Abstract
Globular Cluster Systems (GCSs) of most early-type galaxies feature two peaks in their optical colour distributions. Blue-peak GCs are believed to be old and metal-poor, whereas the ages, metallicities, and the origin of the red-peak GCs are still being debated. We obtained deep K-band photometry and combined it with HST observations in g and z to yield a full SED from optical to near-infrared. This now allows us to break the age-metallicity degeneracy.
We used our evolutionary synthesis models GALEV for star clusters to compute a large grid of models with different metallicities and a wide range of ages. Comparing these models to our observations revealed a large population of intermediate-age (1–3 Gyr) and metal-rich ( solar metallicity) globular clusters, that will give us further insights into the formation history of this galaxy.
1 Introduction
Globular Cluster Systems (GCSs) are now recognized as powerful tracers of their parent galaxy’s formation history (West et al., 2004; Fritze-v. A., 2004; Brodie and Strader, 2006). From their age and metallicity distributions one can reconstruct the parent galaxy’s (violent) star formation and chemical enrichment history all the way from the very onset of star formation in the early universe to the present.
Most early-type galaxies show a bimodal color distribution for their GCSs (e.g. Gebhardt and Kissler-Patig, 1999; Kundu and Whitmore, 2001, 2001; Peng et al., 2006): A universal blue peak and a red peak with colors and height relative to the blue peak varying from galaxy to galaxy. The blue peak GCs are believed to be old and metal-poor, the origin of the red peak is still unclear.
1.1 Our approach to lift the age-metallicity degeneracy
Optical data alone do not allow to disentangle ages and metallicities: Colour-to-metallicity transformations have to assume an age, while colour-to-age transformations are only valid for one metallicity. This degeneracy, however, can be broken by including near-infrared data that are more sensitive to changes of metallicity rather than age.
Anders et al. (2004) used extensive artificial star cluster tests and showed that observations in
-
•
3 passbands for GCSs in dust-free E/S0s or
-
•
4 passbands for (young) star clusters in dusty environments,
-
•
spanning as wide as possible a wavelength-basis (U through K) and
-
•
including at least one NIR-band (e.g. K) with
-
•
accuracies mag in the optical and mag in the NIR
allow to disentangle ages and metallicities and determine individual GC metallicities to dex, and ages to dex, i.e. they allow to distinguish old GCs from those old.
Similar studies also using NIR-data to determine ages and metallicities of globular clusters have only been done for a few galaxies until now (Puzia et al., 2002; Kissler-Patig et al., 2002; Hempel et al., 2003; Larsen et al., 2005; Hempel et al., 2007). More than half of these are found to host a population of GCs that is younger and/or more metal-rich than the old and metal-poor GC population in the Milky Way.
We note that many of these previous studies relied on cumulative distribution. The most important change compared to our analysis is that we derive the physical parameters for each individual cluster. That also enables us to study correlations of these parameters, e.g. with their spatial distributions.
2 Models
We used our GALEV evolutionary synthesis models for star clusters (Schulz et al., 2002; Anders and Fritze-v. A., 2003) to compute a large grid of models for five different metallicities and ages between and with time-steps of . Since early-type galaxies do not contain significant amounts of dust we did not include extinctions into our grid. We therefore only need three filters (HST F475W,F850LP and SOFI Ks) to determine all relevant parameters (age, metallicity, mass) for each cluster.
Note that we do not depend on color-transformation from the HST to Standard Johnson filters. Our models first compute spectra as function of time, that later are convolved with the corresponding filter curves to yield final magnitudes. Figure 1 shows the resulting color-color diagram for the three filters discussed here.
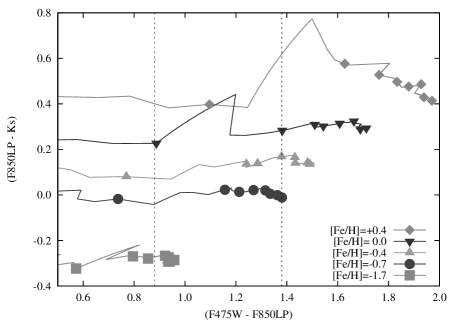
As expected, there is a degeneracy between ages and metallicities, but note how nicely the addition of the near-infrared splits up different metallicities and allows to break this degeneracy.
3 Data
3.1 Near-infrared observations
We used the SOFI (Son of ISAAC) near-infrared imager on the ESO-NTT during two nights in May 2007 (ESO-program id 079.B-0511). SOFI contains a Hawaii HgCdTe 1024x1024 chip with a resolution of arcsec per pixel, resulting in a field-of-view (FoV) of . This large FoV allowed us to significantly reduce the overhead for sky-exposures using one half of the detector for the galaxy, the other half for sky, and changing positions every minute.
3.2 K-band data reduction
The data reduction was done using ESO-MIDAS and largely followed the recipes given in the SOFI User’s manual (Sterzik, 2007), starting with the inter-quadrant row-crosstalk. To flat-field the data we used a combination of dome-flats, illumination correction surfaces and a refined master-flat obtained from normalized sky-frames of both nights. All frames were sky-subtracted using the average of six frames taken nearest in time that have been scaled to the sky-value of the object exposure. We aligned individual images by matching the positions of several stars and compact background galaxies and averaged them to give the final image.
3.3 HST data
We used archival data obtained from the Hubble Space Telescope. Both datasets (J8FS18011 and J8FS18021) were observed as part of The ACS Virgo Cluster Survey (Côté et al., 2004; Jordán et al., 2004) and automatically reduced and calibrated by the On-the-fly Reprocessing (OTFR) pipeline at STScI. After retrieval we checked the alignment of both frames relative to each other, again using a set of stars within the ACS FoV.
3.4 Cluster selection and photometry
Cluster selection was done using SExtractor (Bertin and Arnouts, 1996) requiring at least 4 pixels with intensities above the -over-background threshold. A cross-correlation of the catalogs of both HST filters to remove remaining spurious detections resulted in a “optical” catalog of sources. For all these cluster candidates we derived intrinsic radii using the ISHAPE package within BALOAB (Larsen, 1999), assuming a circular-symmetric King profile with concentration for the GCs.
To remove background galaxies and stars, we required all valid cluster candidates to have radii in the range (equivalent to physical sizes of at the assumed distance of (Tonry et al., 2001) ), leaving candidates. For all of them we performed aperture photometry with aperture sizes of 10 pixels for the HST filters and 7 pixels () in Ks. This allowed us to obtain (g, z, Ks) photometry for candidates; most of the remaining cluster candidates for which we could not derive magnitudes in all three filters were not included within the SOFI FoV.
4 Results
We derived physical parameters for all GC candidates using AnalySED (Anders et al., 2004, 2004). It compares the observed spectral energy distributions (SEDs) with all model SEDs and automatically derives probabilities for each SED on the basis of a -algorithm. From these probabilities it finds the best-fitting template and its physical parameters age and metallicity. The results are shown in Figure 2.
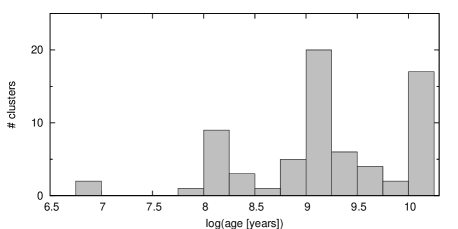
4.1 Old and intermediate ages
The age distribution is dominated by two distinct populations: An old population with ages older than 10 Gyr that has formed during galaxy formation in the early universe. This population is universal in all galaxies and can be studied in great detail within our Milky Way. The second population has intermediate ages of 1–3 Gyr and therefore must have formed later during a violent episode of star-formation; the most plausible explanation for such an event being an intense starburst as e.g. accompanying the merger of two gas-rich spirals or the accretion of a gas-rich companion, resulting in a phase of massive star cluster formation. Besides these two dominating populations there is a number of clusters that do not belong to either of these two. These can be explained by gas left over from the original galaxies that was ejected into tidal tails and later rained down onto the merger remnant.
A merger or accretion event is supported by the detection of a nuclear stellar disk in the host galaxy (van den Bosch et al., 1998; van den Bosch and Emsellem, 1998; Scorza and van den Bosch, 1998). van den Bosch and Emsellem (1998) estimated an age of for the central structure, in excellent agreement with our ages for the intermediate population, suggesting that both have formed from the same event.
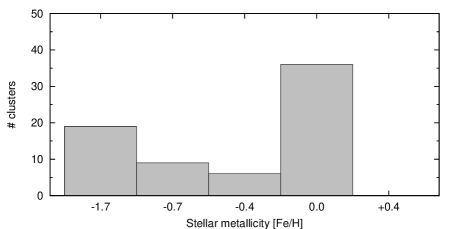
4.2 Solar metallicities
The lower panel of Fig. 2 shows the metallicity distribution of our cluster sample. It features an eye-catching prominent peak at solar metallicity. 26 out of 36 of these high-metallicity clusters belong to the intermediate-age population, however, 10 out of the 36 solar metallicity GCs have old ages. Their origin is not yet clear.
We caution the reader that the number of old and metal-poor globular clusters is underestimated with our analysis. Since we only include globular clusters with a secure Ks-band detection, we are biased toward higher-metallicity clusters, because those have significantly redder optical–near-infrared colours.
A more detailed analysis of the properties of our cluster sample, including their masses will be published in Kotulla et al., in prep.
5 Summary
We obtained deep K-band photometry of the Virgo lenticular NGC4570 and combined it with archival optical data from HST. We selected globular cluster candidates based on the HST data and their intrinsic optical sizes.
GALEV evolutionary synthesis models were used in combination with AnalySED to automatically derive physical parameters age, metallicity and mass for each individual cluster.
We detect a significant population of intermediate-age (1–3 Gyr) and metal-rich () cluster population that has not been reported for this galaxy before.
Acknowledgements We thank the International Space Science Institute (ISSI) for their hospitality and support of this research. This publication is based on observations made with ESO Telescopes at the La Silla Observatory under programme ID 079.B-0511. This paper is also based on archival observations with the NASA/ESA Hubble Space Telescope, obtained at the Space Telescope Science Institute, which is operated by the Association of Universities for Research in Astronomy (AURA), Inc, under NASA contract NAS 5-26555.
References
- Anders et al. (2004) Anders, P., Bissantz, N., Fritze-v. A., U., de Grijs, R.: Mon. Not. R. Astron. Soc. 347, 196 (2004)
- Anders et al. (2004) Anders, P., de Grijs, R., Fritze-v. A., U., Bissantz, N.: Mon. Not. R. Astron. Soc. 347, 17 (2004)
- Anders and Fritze-v. A. (2003) Anders, P., Fritze-v. A., U.: Astron. Astrophys. 401, 1063 (2003)
- Bertin and Arnouts (1996) Bertin, E., Arnouts, S.: Astron. Astrophys. Suppl. Ser. 117, 393 (1996)
- Brodie and Strader (2006) Brodie, J.P., Strader, J.: Annu. Rev. Astron. Astrophys. 44, 193 (2006)
- Côté et al. (2004) Côté, P., Blakeslee, J.P., Ferrarese, L., Jordán, A., Mei, S., Merritt, D., Milosavljević, M., Peng, E.W., Tonry, J.L., West, M.J.: Astrophys. J. Suppl. Ser. 153, 223 (2004)
- Fritze-v. A. (2004) Fritze-v. A., U.: Astron. Astrophys. 414, 515 (2004)
- Gebhardt and Kissler-Patig (1999) Gebhardt, K., Kissler-Patig, M.: Astron. J. 118, 1526 (1999)
- Hempel et al. (2003) Hempel, M., Hilker, M., Kissler-Patig, M., Puzia, T.H., Minniti, D., Goudfrooij, P.: Astron. Astrophys. 405, 487 (2003)
- Hempel et al. (2007) Hempel, M., Zepf, S., Kundu, A., Geisler, D., Maccarone, T.J.: Astrophys. J. 661, 768 (2007)
- Jordán et al. (2004) Jordán, A., Blakeslee, J.P., Peng, E.W., Mei, S., Côté, P., Ferrarese, L., Tonry, J.L., Merritt, D., Milosavljević, M., West, M.J.: Astrophys. J. Suppl. Ser. 154, 509 (2004)
- Kissler-Patig et al. (2002) Kissler-Patig, M., Brodie, J.P., Minniti, D.: Astron. Astrophys. 391, 441 (2002)
- Kundu and Whitmore (2001) Kundu, A., Whitmore, B.C.: Astron. J. 121, 2950 (2001)
- Kundu and Whitmore (2001) Kundu, A., Whitmore, B.C.: Astron. J. 122, 1251 (2001)
- Larsen (1999) Larsen, S.S.: Astron. Astrophys. Suppl. Ser. 139, 393 (1999)
- Larsen et al. (2005) Larsen, S.S., Brodie, J.P., Strader, J.: Astron. Astrophys. 443, 413 (2005)
- Peng et al. (2006) Peng, E.W., Jordán, A., Côté, P., Blakeslee, J.P., Ferrarese, L., Mei, S., West, M.J., Merritt, D., Milosavljević, M., Tonry, J.L.: Astrophys. J. 639, 95 (2006)
- Puzia et al. (2002) Puzia, T.H., Zepf, S.E., Kissler-Patig, M., Hilker, M., Minniti, D., Goudfrooij, P.: Astron. Astrophys. 391, 453 (2002)
- Schulz et al. (2002) Schulz, J., Fritze-v. A., U., Möller, C.S., Fricke, K.J.: Astron. Astrophys. 392, 1 (2002)
- Scorza and van den Bosch (1998) Scorza, C., van den Bosch, F.C.: Mon. Not. R. Astron. Soc. 300, 469 (1998)
- Sterzik (2007) Sterzik, M.: SOFI User’s Manual. 2.1 edn. (2007)
- Tonry et al. (2001) Tonry, J.L., Dressler, A., Blakeslee, J.P., Ajhar, E.A., Fletcher, A.B., Luppino, G.A., Metzger, M.R., Moore, C.B.: Astrophys. J. 546, 681 (2001)
- van den Bosch and Emsellem (1998) van den Bosch, F.C., Emsellem, E.: Mon. Not. R. Astron. Soc. 298, 267 (1998)
- van den Bosch et al. (1998) van den Bosch, F.C., Jaffe, W., van der Marel, R.P.: Mon. Not. R. Astron. Soc. 293, 343 (1998)
- West et al. (2004) West, M.J., Côté, P., Marzke, R.O., Jordán, A.: Nature 427, 31 (2004)